IDENTIFICATION OF IMPACTS :
In order to identify the impacts and status of the water and soil ecosystems (spatial and temporal changes in its composition) in Sharavathi basins, representative samples were collected and subjected to physico-chemical and biological analysis.
Water Impact Assessment
Monthly water samples were collected at representative sample sites using polyethylene containers through grab sampling method. The representative sample sites were picked so as to represent the entire aquatic ecosystem taking in to consideration number of feeders or tributaries, sources of point and non-point pollution, and outlet for various uses etc.
Representative sites
- Location where principal feeder tributary namely Sharavathi (1) (13o52' 739'' N latitude and 75o3' 903'' E longitude), Sharavathi (2) (13o54' 192'' N and 75o 03' 819'' E), Sharmanavathi (3) (13o 58' 445''N and 75o 06'368'' E), Haridravathi (4) (14o 0'677'' N and 75o 8'490'' E) and Yennehole (10) (14o 1'596''N and 74o 45'339'' E) meets the reservoir.
- Central part of reservoir near Holebagulae (8) (14o4' 54'' N and 75o 53' 864'' E) and near Holedeverbanae (11) (13o59'438'' N and 74o59'337''E) to get a general quality of the water.
- Outlet (7) (14o11'506'' N and 74o 49' 608'' E) from the dam.
- Other minor tributaries like Hurlihole (9) (13o 59' 983''N and 74o51'630''E) and a stream near Haridravathi (13) and (14) with 14o 00' 322''N and 75o 08' 150''E and 14o 00' 922''N and 75o 08' 650''E respectively.
- At Talakalale dam, a balancing reservoir (6) (14o11'587''N and 74o47'210''E) and at Madaenur dam (12) (14o05'937''N and 74o 54'097''E) to get a comparative water quality status over Linganamakki dam.
- Near Muppanae forest area (5) (14o 06'500''Nand 74o47'414''E).
Physico-chemical and biological analyses for the representative samples is being done since February 2001, as per the standard methods prepared and published by NEERI (Indian Standard Specifications [IS: 1050-1983] and [IS: 2490 -1982]) and American public health association (APHA). The parameters include pH, temperature, color, transparency, turbidity, conductivity, total suspended solids, alkalinity, acidity, dissolved oxygen, chlorides, sulphate, total hardness, iron, residual chlorine, fluorides, ammonia, sodium, potassium, nitrates, phosphates and coliform bacteria.
Soil Investigation
In order to determine the general characterization of soil in the catchment, random soil samples of suitable quantity were collected using soil augers, core of size 15 cm x 9 cm and tools like spades or shovels etc. in all landscape elements. Composite samples were taken from an area to a depth of about 15-cm, having the size, shape and orientation of the prospective plot. Large uniform fields were subdivided in to smaller units (not to exceed about 5 ha). Samples were collected from the following representative sites.
Representative soil sampling sites
Soil samples were collected at the following locations: Yellodi (74o 47' 540'' E and 14o 06' 497''N), Tumari (74o 47' 533'' E and 14o 06' 454'' N), Hosanagara (74o 47' 523'' E and 14o 06' 523'' N), Haridravathi (74o 47' 411'' E and 14o 06' 563'' N), Adagalale (74o 47' 450'' E and 14o 06' 616'' N), Muppanae (74o 47' 468'' E and 14o 06' 652'' N), Holebagulae island (evergreen patch) (74o 54' 488'' E and 14o 04' 754'' N), Holebagulae (semi evergreen patch) (74o 54' 174'' E and 14o 04' 865'' N), Sharavathi (75o 03' 998'' E and 13o 52' 800'' N) and Sharmanavathi (75o 06' 488'' E and 13o 58' 504'' N).
The physico-chemical and biological analysis of the soil qualities are done as per the standard methods provided by Encyclopaedia of Environmental sciences-15 and Methods manual for forest soil and plant analysis (Kalra, Y.P., and Maynard, D.G., 1991). Physical parameters analysed are bulk density, moisture content and water holding capacity; Chemical parameters analysed are pH, Electrical conductivity, chloride, sulphate, nitrate, phosphorus, potassium, calcium, magnesium, sulphur and total organic carbon; and Qualitative analysis of the microbial population.
Status of water
Table 1 and 2 gives the Physico- chemical and biological characterization of water quality at various representative sites for the month of July.
TABLE-1
| SAMPLE NUMBER |
1 |
2 |
3 |
4 |
5 |
6 |
7 |
|
| PHYSICAL PARAMETER |
| Transparency (cm) |
23 |
16 |
14 |
8 |
50 |
45 |
50 |
| Temperature (OC) |
23.8 |
24 |
23.9 |
24.3 |
23.3 |
24.1 |
24.8 |
| EC (ms/cm) |
0.03008 |
0.04416 |
0.04032 |
0.0608 |
0.02048 |
0.02688 |
0.02944 |
| Total Suspended Solids (mg/l) |
65 |
78 |
76 |
110 |
40 |
35 |
65 |
| Turbidity (NTU) |
50 |
35 |
30 |
60 |
<10 |
<10 |
<10 |
| Color * |
Brownish |
Brownish |
Brownish |
Brownish |
colorless |
colorless |
Light brown |
| CHEMICAL PARAMETER |
| PH* |
7.09 |
6.89 |
6.97 |
6.98 |
6.95 |
7.22 |
6.94 |
| Alkalinity (mg/l) |
35 |
30 |
35 |
45 |
20 |
20 |
20 |
| Acidity (mg/l) |
5 |
5 |
5 |
5 |
2.5 |
2.5 |
2.5 |
| Chlorides (mg/l) |
19.9 |
14.9 |
14.9 |
14.9 |
14.9 |
19.9 |
14.9 |
| Total Hardness (mg/l) |
59.5 |
59.9 |
76.3 |
82.2 |
82.3 |
49.5 |
40.9 |
| Dissolvedoxygen (mg/l) |
7.7 |
7.5 |
7.6 |
7.7 |
7.7 |
7.8 |
7.7 |
| Sodium (mg/l) |
8.31 |
13.77 |
11.33 |
17.66 |
4.433 |
5.63 |
5.924 |
| Potassium (mg/l) |
1.134 |
2.151 |
1.564 |
2.151 |
0.195 |
0.743 |
0.860 |
| Sulphate (mg/l) |
4.96 |
11.278 |
9.47 |
22.10 |
7.44 |
2.93 |
4.511 |
| Nitrates (mg/l) |
ND |
ND |
ND |
ND |
ND |
ND |
ND |
| Phosphate (mg/l) |
0.014 |
0.0143 |
0.014 |
0.0197 |
0.005 |
0.0097 |
0.011 |
| Iron (mg/l) |
<0.3 |
<0.3 |
<0.3 |
<0.3 |
<0.3 |
<0.3 |
<0.3 |
| Ammonia (mg/l) |
0.2 |
0.2 |
0.2 |
2 |
0.2 |
<0.2 |
2 |
| Residual Chlorine (mg/l) |
<0.2 |
<0.2 |
<0.2 |
<0.2 |
<0.2 |
<0.2 |
<0.2 |
| BIOLOGICAL PARAMETER |
| Coliforms * |
ND |
Present |
Present |
Present |
Present |
ND |
ND |
TABLE 2
| SAMPLE NUMBER |
8 |
9 |
10 |
11 |
12 |
13 |
14 |
|
| PHYSICAL PARAMETER |
| Transparency (cm) |
43 |
34 |
53 |
45 |
42 |
8 |
8 |
| Temperature (OC) |
26 |
24.5 |
23.4 |
25.5 |
24.5 |
24.1 |
24.4 |
| EC (ms/cm) |
0.02496 |
0.02304 |
0.02016 |
0.02528 |
0.02624 |
0.05952 |
0.0672 |
| Total Suspended Solids (mg/l) |
55 |
65 |
45 |
55 |
55 |
102 |
108 |
| Turbidity (NTU) |
<10 |
<10 |
<10 |
<10 |
<10 |
25 |
75 |
| Color * |
Light Brown |
Light Brown |
colorless |
Light Brown |
Light Brown |
Brownish |
Brownish |
| CHEMICAL PARAMETER |
| PH* |
6.65 |
6.6 |
6.93 |
6.8 |
6.99 |
7.01 |
6.98 |
| Alkalinity (mg/l) |
30 |
20 |
20 |
25 |
25 |
55 |
50 |
| Acidity (mg/l) |
2.5 |
2.5 |
2.5 |
2.5 |
2.5 |
2.5 |
2.5 |
| Chlorides (mg/l) |
14.9 |
14.9 |
19.9 |
14.9 |
14.9 |
19.9 |
24.9 |
| Total Hardness (mg/l) |
38.15 |
54.5 |
49.5 |
49.05 |
43.6 |
54.5 |
54.5 |
| Dissolved oxygen (mg/l) |
7.7 |
7.9 |
8.0 |
7.7 |
7.8 |
7.3 |
7.4 |
| Sodium (mg/l) |
5.82 |
5.24 |
4.46 |
5.708 |
6.036 |
18.457 |
29.2186 |
| Potassium (mg/l) |
0.743 |
0.391 |
0.2346 |
0.7039 |
0.899 |
1.447 |
2.5029 |
| Sulphate (mg/l) |
11.278 |
10.15 |
7.44 |
7.66 |
6.76 |
21.20 |
20.07 |
| Nitrates (mg/l) |
ND |
ND |
ND |
ND |
ND |
ND |
ND |
| phosphate (mg/l) |
0.019 |
0.01 |
0.015 |
0.01 |
0.019 |
0.018 |
0.03 |
| Iron (mg/l) |
<0.3 |
<0.3 |
<0.3 |
<0.3 |
<0.3 |
<0.3 |
<0.3 |
| Ammonia (mg/l) |
0.2 |
3 |
1.5 |
1.5 |
1.5 |
3 |
2 |
| Residual Chlorine (mg/l) |
<0.2 |
<0.2 |
<0.2 |
<0.2 |
<0.2 |
<0.2 |
<0.2 |
| BIOLOGICAL PARAMETER |
| Coliforms * |
ND |
ND |
ND |
ND |
ND |
Present |
Present |
The water analysis results from Feb to July 2001 shows that the pH varies from 6.53 to 7.74, temperature ranges from 23.3 to 31.5OC, dissolved oxygen ranges from 5.0 - 8.0 mg/l, turbidity fluctuates from less than 10 NTU - 75 NTU (mon), electrical conductivity ranges from 0.005 - 0.44 ms/cm, total suspended solids ranges from 21.3- 110 mg/l, alkalinity and acidity ranges from 20-68 mg/l and 2.5 - 20 mg/l respectively, chlorides ranges from 4.9-24.9 mg/l and total hardness ranges from 27.25-81.7 mg/l. Sodium and potassium varies from 4.433-32.02 and nil- 2.5 mg/l respectively, sulphate ranges from 2.93-32.02 mg/l, nitrates and phosphates ranges from nil-0.42 and nil-0.032 mg/l respectively. Concentration of iron and ammonia shows less than 0.3 mg/l and less than 0.2 to 3 mg/l at varies sampling points respectively. Residual chlorine shows less than 0.2 mg/l and fluoride fluctuates between 0.6 and 1.5 mg/l. Color, varies from color-less to brownish color. Monsoon samples contain coliform bacteria at Sharavathi 2, Sharmanavathi, Haridravathi and its near by streams; and it shows nil at remaining representative sampling sites. The Fig 1 shows the variations of various parameters from February to July 2001 at different representative sites.
FIGURE-1
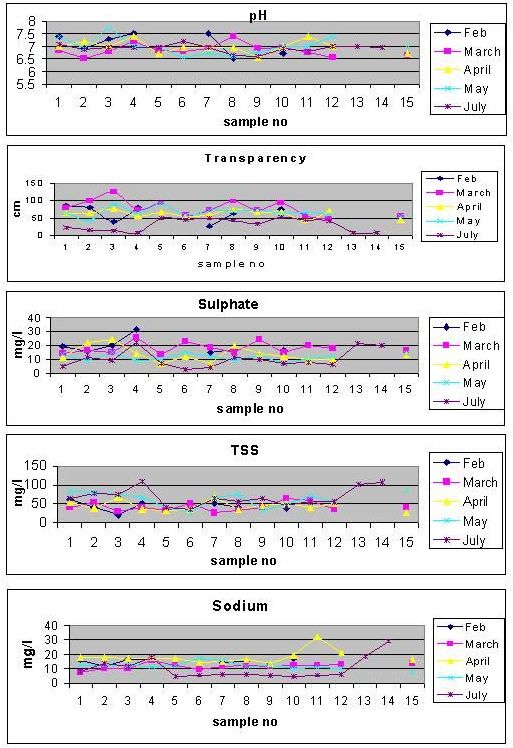
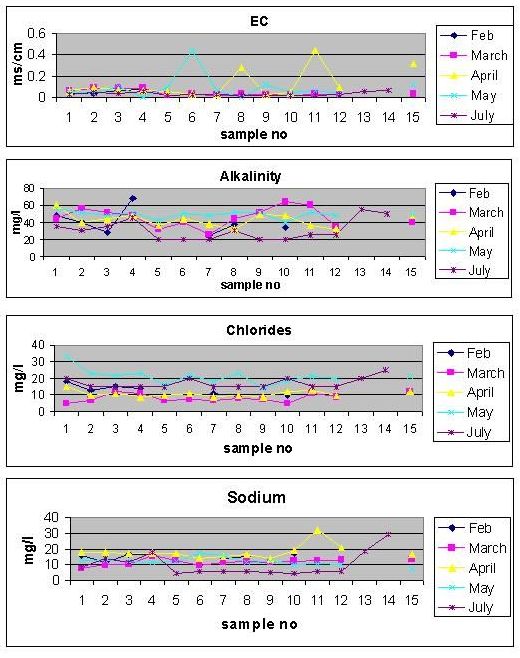
These results were compared with the standard values provided by NEERI (Indian Standard Specifications [IS: 1050-1983] and [IS: 2490 -1982]), WHO and American public health association. It was found that physical parameters especially turbidity exceeds the limits at Sharavathi 1 & 2, Sharmanavathi, Haridravathi and its near by streams. Brownish color exists almost at all sampling points and increased concentration of total suspended solids (TSS) at Haridravathi and near by streams. These aspects are due to siltation would lead to the loss of reservoir storage capacity. Chemical parameter phosphate exceeds the limit at a stream near Haridravathi and biological parameter coliform bacteria present at Sharavathi 2, Sharmanavathi, Haridravathi and its near by streams and also at Muppanae forest area. This is mainly due to improper watershed management (agricultural activities along with monsoon erosions in the surrounding areas). Household surveys conducted in this region regarding agrobiodiversity and cultivation practices indicate the use of inorganic fertilisers in Hosanagar area (Linganamakki upstream catchment area). Also, the samples collected during monsoon reveal the pollution due to non-point sources (agricultural activities in the catchment).