|
RESULTS AND DISCUSSIONS
Land Cover Analysis: Slope and Distance based was computed vegetation indices were calculated, of which NDVI shows significant results and is shown in Figure 5 and the details in Table 2. The vegetation cover has increased from 77.59% in 1989 to 80.80% in 2009.
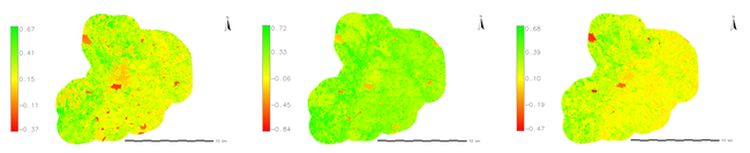
Figure 5: Land cover Classification
Table 2: Land Cover details
| Year |
% Vegetation |
% Non Vegetation |
| 1989 |
95.60 |
4.33 |
| 1998 |
94.68 |
5.31 |
| 2009 |
93.57 |
6.39 |
Land Use Analysis: The Spatio Temporal Land use changes between 1989 and 2009 are shown in Figure 6 and the details in Table 3. The results show an increase in water bodies from 0.84 % in 1989 to 2.47 % in 2009, the built-up has increased from 1.45% in 1989 to 5.80% in 2009; Vegetation has reduced from 3.89% in 1989 to 1.10% in 2009, others (including the cultivation lands, barren lands, open lands, etc) have changed from 93.82 % in 1989 to 90.64%. The Overall Classification Accuracy of more than 91 % was observed for the classified images, table 4 gives the summary as the agreement between the true value and the sensed value.
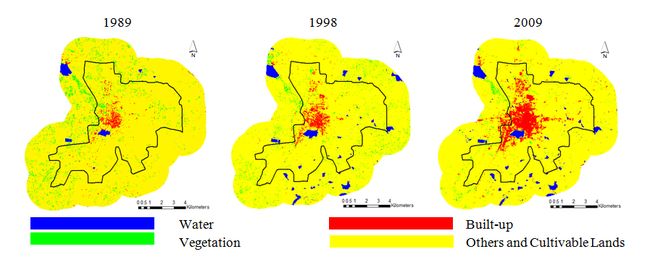
Figure 6: Land Use Classification
Table 3: Land use details
| Year 1989 |
| Particulars |
Area(Ha) |
Percentage |
| Water |
130.45 |
0.83% |
| Vegetation |
613.01 |
3.90% |
| Built up |
228.45 |
1.45% |
| Others |
14742.99 |
93.82% |
| 1998 |
| Particulars |
Area (Ha) |
Percentage |
| Water |
366.12 |
2.33% |
| Vegetation |
414.63 |
2.64% |
| Built up |
325.62 |
2.07% |
| Others |
14625.90 |
92.97% |
| 2009 |
| Particulars |
Area (Ha) |
Percentage |
| Water |
388.08 |
2.47% |
| Vegetation |
172.35 |
1.10% |
| Built up |
913.14 |
5.80% |
| Others |
14258.70 |
90.64% |
| Total Area |
15732.27 Hectares |
Table 4: Overall Accuracy
| Year |
Overall Accuracy |
| 1989 |
93.64 |
| 1998 |
94.17 |
| 2009 |
91.27 |
Urban sprawl assessment: Shannon’s entropy, indicator of urban sprawl was calculated and the results are shown in table 4. The threshold limit of Shannon’s Entropy is log 5 (0.6987), values closer to the threshold value indicates the growth is scattered indicating sprawl in the region and if the Shannon’s Entropy values are close to zero, it indicate that the growth is clustered and confined and there is no or little sprawl and. The results show that the distribution of the built up is clustered in the year 1989 and 1998, while in 2009, Shannon’s Entropy has increased indicating that there is a dispersed growth of built up, and this is evident in Figure 6.
Table 5: Shannon’s Entropy Analysis
| Year |
Built Up (Ha) |
Shannon’s Entropy |
Log(n) |
| 1989 |
228.45 |
0.158 |
0.699 |
| 1998 |
325.62 |
0.182 |
| 2009 |
913.14 |
0.273 |
|
