|
RESULTS AND DISCUSSION
Water Quality Parameters
Temperature: Water temperature plays an important role in aquatic ecosystems. The variations in temperature are influenced by the factors such as air temperature, humidity, wind and solar energy. The monthly average temperatures at various sites were recorded as: at S1 is 21.96-27.30Cand at S2 is 21.7-28.20C.
Electrical Conductivity: Electrical Conductivity denotes the ability of an aqueous solution to carry electric current, which depends on the presence of ions, their total concentration, mobility, valence, relative concentrations and temperature. The monthly average electrical conductivity values at different sites are recorded as 690-810µS/cm (S1) and 670-837µS/cm (S2) respectively.
pH: pH is defined as the intensity of the acidic or basic character of a solution at a given temperature. Its range from 0 to 7 is diminishingly acidic, whereas values of 7 to 14 are increasingly alkaline. pH of the water is largely governed by carbon dioxide, carbonates and bicarbonates equilibrium. The monthly average value of pH is found to be 7.9-9.43 (S1) and 8.45-9.68 (S2).
Dissolved Oxygen (DO): The oxygen content of water varies with temperature, turbulence, salinity, increased photosynthetic activity and respiration by microalgae and atmospheric pressure. The DO in water affects the oxidation-reduction state of many of the chemical compounds such as nitrate, ammonia, sulphate and sulphite, ferrous and ferric ions. The monthly average values of different sites are 2.84-4.17 mg/l (S1) and 3.8-9.13 mg/l (S2).
Biochemical Oxygen Demand (BOD): BOD is the amount of oxygen utilized by microorganisms to stabilize the organic matter under aerobic conditions. BOD determines the strength of sewage effluent and other polluted waters and provides data on the pollution load in all natural waters. The monthly average values of BOD were found as 3.44-17.55 mg/l in S1 and 3.82-21.21 mg/l in S2.
Chemical Oxygen Demand (COD): COD determines the amount of oxygen required for the chemical oxidation of most organic matter and oxidizable inorganic substances with the help of strong chemical oxidant. The COD average value varied during the study period like 9.6-27.52mg/l (S1) and 8.8-31.04 mg/l (S2).
Optical Density: The colour of water is determined by the measurement of optical density (absorptivity) on a spectrophotometer at various wavelength of the passing light. The average values of optical density (OD) at different sites are 0.04-0.11 Abs at S1 and 0.05-0.19 Abs at S2.
Total Alkalinity: Alkalinity of the water is the capacity to neutralize strong acids, which is primarily a function of carbonate, bicarbonate and hydroxide content and formed due to dissolution of CO2 in water. The average value of total alkalinity throughout the study period is observed as 164-238 mg/l at S1 and 159-230mg/l at S2.
Chloride: Chloride is found widely distributed in nature in the form of salts of sodium, potassium and calcium. The high chloride concentration of the pond water may be due to high rate of evaporation or due to organic wastes present in water. The average chloride concentration was observed as 97.63-123.26 mg/l (S1), and 99.05-119.71 mg/l (S2).
Total Hardness: Hardness is generally caused by the calcium and magnesium ions present in the water. The average value was observed as 155-229 mg/l (S1) and 140.5-232 mg/l (S2). The photosynthetic activity, loss of CO2 due to high pressure, or precipitation of calcium carbonate increases the water temperature and contributes to the depletion of calcium (Chapman, 1992). The average value for calcium hardness was observed as 42.84-55.31 mg/l (S1) and 44.13-53.31 mg/l (S2). Magnesium is essential for the growth and development of planktons (Wetzel, 1983). The values of magnesium hardness varied at all sites: S1 (27.25 mg/l to 42.21 mg/l) and S2 (23.42 mg/l to 43.42 mg/l).
Potassium and Sodium: Sodium and potassium are essential nutritional element for aquatic biota, and is usually present at less than 10 mg/l in natural waters (Chapman, 1992). The monthly average value of potassium varies from S1 (27.38-33.6 mg/l) and S2 (27.45-34.35 mg/l) respectively. The monthly average value for sodium, varies from S1 (102.45-126.09 mg/l) and S2 (102.75-118.95 mg/l) respectively.
Nitrate and Nitrite: Nitrate is the oxidized form of nitrogen and end product of aerobic decomposition of the organic nitrogenous matter. In the environment, inorganic nitrogen occurs in a range of oxidation states as nitrate (NO3-), nitrite (NO2-), ammonium ion (NH4+) and molecular nitrogen (N2). The nitrate values were S1 (0.98-3.15 mg/l) and S2 (0.54-2.25 mg/l) respectively. The nitrite values were S1 (0.02-1.03 mg/l) and S2 (0.01-0.48 mg/l) respectively.
Ammonia: Ammonia is produced as a result of the breakdown of nitrogenous organic and inorganic matter in soil and water. The excretion of biota may also contribute to the ammonia levels in water. The higher concentration of ammonia indicates organic pollution. Free ammonia (NH3) is toxic to fish and NH4+ ions (Ammonium) are non-toxic. The monthly average value varies from S1 (1.34-9.81 mg/l) and S2 (1.25-7.59 mg/l) respectively.
Total phosphates: Phosphorus occurs in many inorganic and organic forms, and does not occur in the environment in its elementary form. The monthly average value varies from S1 (5.72-16.13 mg/l) and S2 (6.9-13.25 mg/l) respectively.
Orthophosphate: This is the form of phosphours that is soluble in water and is diversely utilized by aquatic biota. The monthly average value varies from S1 (3.54-11.87 mg/l) and S2 (3.08-10.89 mg/l) respectively.
Algal Dynamics
Detailed microscopic examination of phytoplankton revealed the presence of four algal groups throughout the study period in the order Cyanophyceae>Chlorophyceae>Bacillariophyceae> Euglenophyceae. The following species were found in the Centenary pond (Sampling sites: S1 & S2) Microcystis sp., Closterium sp., Chlorococcum sp., Chlamydomonas sp., Cosmarium sp., Navicula sp., Nitzschia sp., Cyclotella sp. (Centric diatom), Pandorina sp., Euglena sp., Phacus sp., Fragillaria sp., Phormidium sp.and Chlorella sp. Initial nutrient limiting conditions during the months of February and March led to the abundance of Cyanophycean sp. i.e., Microcystis aeruginosa after the biomanipulation by the introduction of duckweeds (Lemna sp.). There was succession from Cyanophyceae to Chlorophyceae, whereas Chlorococcum sp. dominated. This type of succession indicates higher nutrient regimes in the inflow water consequent to poor performance of the Wastewater treatment plant. Higher concentrations of phosphates and nitrates in the water resulted in abundance of surface films mostly comprising of Chlorococcum sp., beneath to which Microcystis sp. were found. The algal species composition has been observed to change with environmental parameters as well as feed parameters (Sekadende, 2004). In the Centenary pond, the growth of algae and duck weeds were responsible for ~45 % of nutrient removal and could be the best possible option to treat the secondary treated water in the campus after feed rate optimization and strategic algal growth, suitable to the nutrient conditions.
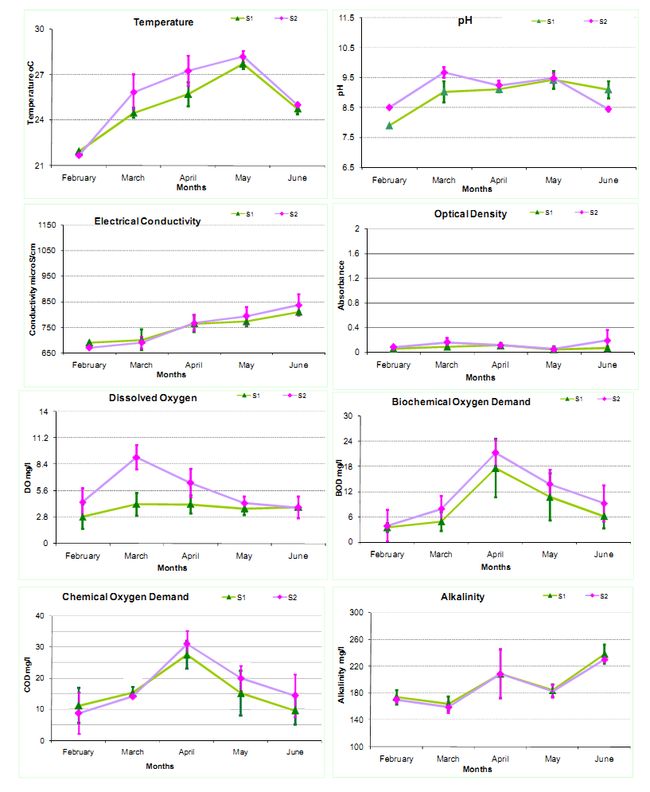
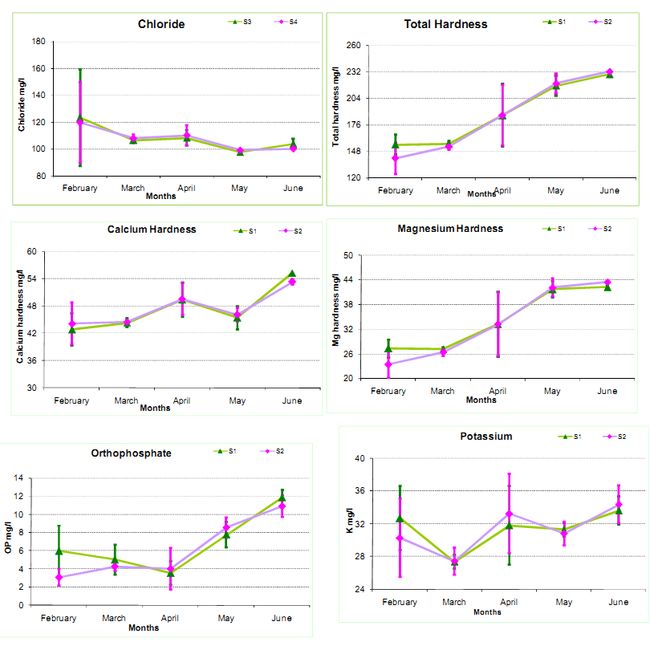
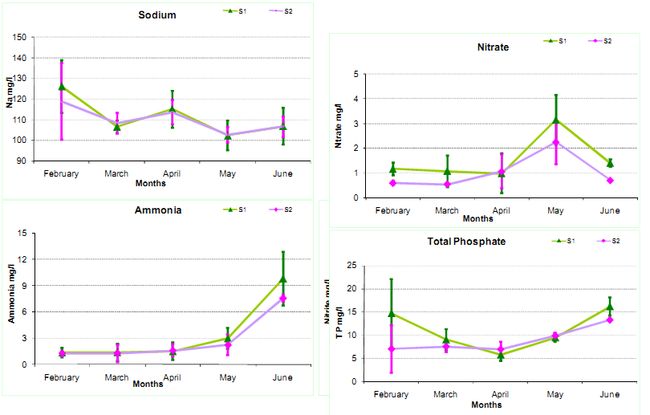
Figure 2: Monthly Physico-chemical variations in Water quality parameters
*The whiskers indicates standard deviation (st. dev) across the mean(µ)
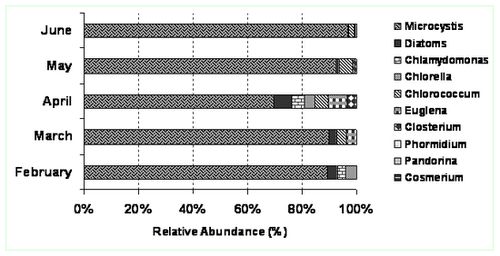
Figure 3: Site 1. Relative abundance of microalgae community
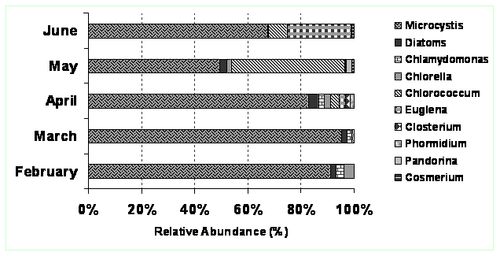
Figure 4: Site 2. Relative abundance of microalgae community
|
