 |
Microhabitat influence on diatom distributional pattern in diverse ecosystems |
 |
1Energy and Wetlands Research Group, Centre for Ecological Sciences [CES], Indian Institute of Science, Bangalore – 560012, India.
2Department of Botany, Yuvaraja’s College (Autonomous), University of Mysore, Mysore – 57005
*Corresponding author: cestvr@ces.iisc.ac.in
|
Results
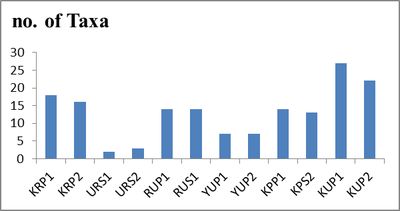
Seventy six species from thirty seven genera within all habitats, and twenty four taxa common on both epiphytic and epilithic habitats were recorded. Diatom species such as Achnanthidium exiguum (Grunow) Czarnecki, Amphora veneta Kützing, Aulocoseira granulata (Ehrenberg) Simonsen, Cyclotella meneghiniana Kützing, Diploneis oblongella (Naegeli) Cleve-Euler, Gyrosigma rautenbachiae Cholnoky and Nitzschia palea (Kützing) W.M. Smith, dominated representing epiphytic habitat and Ulnaria ulna v. acus (Kützing) Lange-Bertalot characterized epilithic habitat. These epiphytic and epilithic species reached up to 50% of total abundances in sampled lakes. Taxa belonging to genus Achnanthidium sp. were confined to stone and plant habitats and are indifferent to alterations in water flow induced forces. Table 2 lists the diversity indices, which reflected the highly variable species richness among samples with taxa ranging from 2- 27 at respective sampling sites. Shannon diversity illustrated in Figure 1, ranges from 0.29 (Ulsoor) - 2.62 (Kommaghatta). Overall, dominance ranged from 0.1-0.83 where, taxa were 80% dominant at Ulsoor lake. Dissimilarity and decline in taxa were observed in pre and post restoration period of Kommaghatta lake.

Figure 1: Number of taxa recorded across sampling sites
(Refer table 1 for sampling sites and its codes)
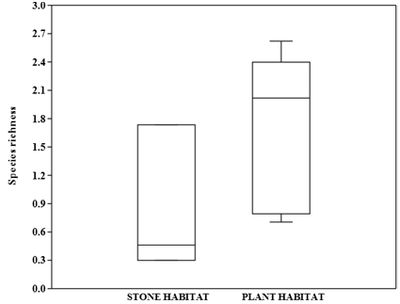
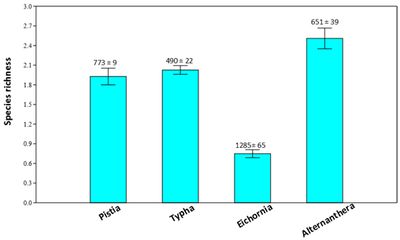
Species richness of taxa collected from 2 different habitats, were plotted to study the highest preferred habitat for benthic diatoms and represented in Figure 2. Highest number of taxa was found on epiphytic/submerged habitat followed by epilithic/ stones. The adherence and accumulation of diatom growth was observed to be reliant on the type of macrophytes available and water conditions (Figure 3). Highest species occupancy was observed on macrophyte Alternanthera sp. with water conductivity value of 651±39 µScm-1 at Kommaghatta (before restoration). Moderate species richness of 1.93±0.09 and 2±0.07 (Pistia sp. and Typha sp.) were noticed and conductivity recorded are 773±9 µScm-1 and 490±22 µScm-1. Lowest species richness on Eichornia sp. with highest water conductivity of 1285±65 µScm-1. Dissolved oxygen, Biological oxygen demand and chemical oxygen demand classified Kothanur, Ulsoor and Yelahanka lakes (Table 1) as most polluted from that of moderately polluted lakes (Ramsandra and Kommaghatta). Nitrates and phosphates were within the surface water standards, ranging from 0.039-0.27 ppm and 0.001-2.01 ppm, although pollution was evident from organic concentration levels.

Figure 2: Species richness of diatoms on Stone (epilithic) and Plant (epiphytic) habitat

Figure 3: Diatom distribution on four different macrophytic habitats in Bangalore lakes. Number on top of each bar represents corresponding conductivity values
Table 1. List of sampling sites along with codes used in analysis and water quality data
| sampling sites |
Code |
pH |
EC
(µScm-1) |
DO
(mgL-1) |
BOD
(mgL-1) |
COD
(mgL-1) |
N
(ppm) |
P
(ppm) |
| Kommaghatta post restoration plant 1 |
KPP1 |
9.01 |
782 |
4.55 |
25.30 |
44.00 |
0.056 |
0.02 |
| Kommaghatta post restoration stone 2 |
KPS2 |
8.98 |
764.5 |
6.14 |
13.71 |
78.00 |
0.066 |
0.02 |
| Kommaghatta unaltered plant 1 |
KUP1 |
8.50 |
690 |
7.48 |
7.30 |
36.50 |
0.04 |
0.03 |
| Kommaghatta unaltered plant 2 |
KUP2 |
8.10 |
612 |
8.94 |
4.71 |
23.55 |
0.17 |
0.05 |
| Kothanur restored plant 1 |
KRP1 |
7.20 |
1110 |
0.97 |
14.50 |
72.50 |
0.079 |
0.30 |
| Kothanur restored plant 2 |
KRP2 |
7.14 |
968 |
2.19 |
13.33 |
66.65 |
0.15 |
0.37 |
| Ulsoor resotred stone 1 |
URS1 |
9.48 |
705 |
1.63 |
16.98 |
43.96 |
0.27 |
1.89 |
| Ulsoor restored stone 2 |
URS2 |
9.38 |
609 |
4.07 |
15.96 |
41.92 |
0.18 |
2.01 |
| Yelahanka unaltered plant 1 |
YUP1 |
9.06 |
1220 |
4.63 |
21.94 |
53.88 |
0.19 |
1.34 |
| Yelahanka ulatered plant 2 |
YUP2 |
9.33 |
1350 |
2.76 |
26.385 |
62.77 |
0.26 |
1.61 |
| Ramasandra unaltered plant 1 |
RUP1 |
8.85 |
490 |
6.67 |
7 |
30.99 |
0.051 |
0.001 |
| Ramasandra unaltered stone 1 |
RUS1 |
8.60 |
496 |
7.06 |
6.00 |
30.67 |
0.039 |
0.020 |
| BIS surface water standards |
BIS |
6.5-9 |
1200 |
>3 |
<5 |
<30 |
- |
- |
Table 2: Diversity indices
| CODE |
no. of Taxa |
Dominance |
Shannon |
Evenness |
| KPP1 |
14 |
0.1628 |
2.088 |
0.5762 |
| KPS2 |
13 |
0.4587 |
1.316 |
0.2869 |
| KUP1 |
27 |
0.1084 |
2.621 |
0.5092 |
| KUP2 |
22 |
0.1319 |
2.398 |
0.5001 |
| KRP1 |
18 |
0.2122 |
2.018 |
0.4178 |
| KRP2 |
16 |
0.2112 |
1.838 |
0.3927 |
| URS1 |
2 |
0.8385 |
0.2993 |
0.6744 |
| URS2 |
3 |
0.7709 |
0.4614 |
0.5288 |
| YUP1 |
7 |
0.6885 |
0.7057 |
0.2893 |
| YUP2 |
7 |
0.6161 |
0.7923 |
0.3155 |
| RUP1 |
14 |
0.1607 |
2.074 |
0.5685 |
| RUS1 |
14 |
0.3166 |
1.735 |
0.4048 |
|
|
Citation : Alakananda B, Mahesh M.K. and Ramachandra. T.V, 2012. Microhabitat influence on diatom distributional pattern in diverse ecosystems., Proceedings of the LAKE 2012: National Conference on Conservation and Management of Wetland Ecosystems, 06th - 09th November 2012, School of Environmental Sciences, Mahatma Gandhi University, Kottayam, Kerala, pp. 1-7.
|


