http://www.iisc.ernet.in/
Modelling Urban Revolution in Greater Bangalore, India
http://wgbis.ces.iisc.ernet.in/energy/
1Energy and Wetlands Research Group, Centre for Ecological Sciences [CES],Indian Institute of Science, Bangalore – 560012, India.
2National Remote Sensing Centre, Hyderabad, http://nrsc.gov.in,
*Corresponding author:
cestvr@ces.iisc.ernet.in

RESULTS

Land use analysis: Land use analysis was done using Maximum Likelihood classifier (MLC) considering training data collected from field. Land use analysis show an increase in urban area from 49915.42 (2008) to 59103 hectares (2012) which constitute about 30%.  Fig. 2 illustrates the increase in urban area and the same is listed in table 2. Overall accuracy and Kappa was calculated using the module r.kappa in GRASS and results shows an accuracy of 85% and 0.9 kappa was obtained on average.


Fig. 2. Land use transitions during 2008 to 2012

Table 2: Land use during 2008, 2010 and 2012

Class
Year
Built-up Area Water
Ha % Ha %
2008 49915.42 24.85 1068.94 0.53
2010 57208.40 28.48 1571.41 0.78
2012 59103.90 29.33 1169.82 0.58
Class
Year
Vegetation Others
Ha % Ha %
2008 77036.96 38.35 72851.95 36.27
2010 73460.57 36.57 68,656.40 34.17
2012 67883.85 33.68 73385.73 36.41

Validation: Predicted land uses of 2010 and 2012 were compared with actual land uses of 2010 and 2012 classified based on remote sensing data with field data. The weights for each scenario was then obtained based on validation per pixel basis so that the developed semantics match the original land use. Validation of predicated land use was done using the actual land uses as reference and accuracy assessment was done with Kappa values which are given in table 5. Results reveal that predicted and actual land uses are in conformity to an extent of 87 to 91%. The prediction exercise is repeated for 2020 keeping 2012 as base year.

Modelling: Using cellatom module of IDRISI the results of CA_MARKOV were obtained as illustrated in Figure 5. The likely land use is indicated in Table 3. The land use change modeler of IDRISI was used to obtain the prediction, results of which are as shown in Figure 6 and tabulated in table 4. Geomod analysis required the land use derived data to reclassified into two classes: Urban and non-urban. Results of this analysis is as shown in Figure 7 and tabulated in table 5.


Fig.5. Predicted land use map for 2020

Table 3: Land use 2020

Year 2020 - Predicted
Land use %
Urban 70.64
Vegetation 13.55
Water 0.74
Others 15.07


Fig. 6: Predicted growth of Bangalore by 2020 using LCM

Table 4. Land use statistics of Bangalore for 2020.

Year 2020 - Predicted
Land use %
Urban 61.27
Vegetation 7.00
Water 0.55
Others 31.18


Fig. 7: Predicted growth of Bangalore by 2020 using Geomod

Table 5: Land use 2020 using Geomod

Year Non-Urban Urban
2020 49.62% 50.38%


BACK  «  TOP  »  NEXT
Citation : Ramachandra T V, Bharath H Aithal, Vinay S, Joshi N V, Uttam Kumar and Venugopal Rao K., Modelling Urban Revolution in Greater Bangalore, India , 30th Annual In-House Symposium on Space Science and Technology, ISRO-IISc Space Technology Cell, Indian Institute of Science, Bangalore, 7-8 November 2013.
* Corresponding Author :
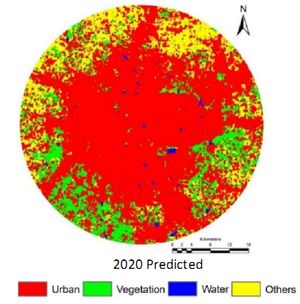
Dr. T.V. Ramachandra
Energy & Wetlands Research Group, Centre for Ecological Sciences, Indian Institute of Science, Bangalore – 560 012, India.
Tel : +91-80-2293 3099/2293 3503 [extn - 107],      Fax : 91-80-23601428 / 23600085 / 23600683 [CES-TVR]
E-mail : cestvr@ces.iisc.ernet.in, energy@ces.iisc.ernet.in,     Web : http://wgbis.ces.iisc.ernet.in/energy, http://ces.iisc.ernet.in/grass
E-mail    |    Sahyadri    |    ENVIS    |    GRASS    |    Energy    |      CES      |      CST      |    CiSTUP    |      IISc      |    E-mail