1 Centre for Sustainable Technologies,
2 Centre for infrastructure, Sustainable Transportation and Urban Planning,
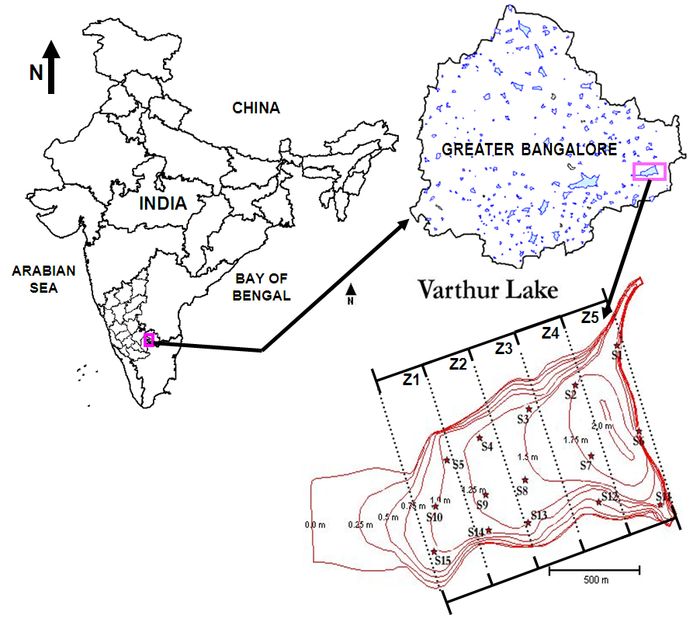
3 Energy and Wetlands Research Group, Centre for Ecological Sciences, Indian Institute of Science, Bangalore 560 012, India Materials and Methods 1. Study area and its characteristics
2.1 Inflow and outflow characteristics and rates The water body was monitored during the monsoon and the non-monsoon periods to study the nitrogen transformations and removal mechanisms based on variations in organic loading rate (OLR). The first Period [1] was from December 2008 to April 2009 during cold season (average water temperature=18°C) and the influent wastewater was of low strength (21) (BOD=98 mg/l). Period 2 was from April to August 2009 during warm season (average water temperature = 28°C) using the same wastewater source as in period 1 (BOD=186 mg/ l). The outflow channel from Bellandur lake upstream was the main source of inflow to the lake which receives sewage from the southern part of Bangalore and effluent and sludge from two treatment plants of inadequate capacity. All illegal drains linked to the channel connecting to Varthur lake were identified and the wastewater flow rate was calculated. The average N content of raw wastewater was 55 mg/l. This concentration was used to represent raw wastewater throughout the southern part of the metropolitan area. Data on flows and chemical concentrations were calculated/determined on site. The effluent N was tested for the presence of Nr forms as NH4 and NO3 by standard methods (22). The N embedded in the bacterial, algal, macrophytes and in sludge escaping out of the system through the outlets was also determined and quantified. Inflow was calculated to be 595 MLD with ~500 MLD getting into the lake from the major upstream lake Bellandur and an additional 95 MLD from illegal sewage discharges through various drains connecting to the feeder channel. The outflows were found to have a little higher flow rates due to many drainages connecting the lake. Outflow measurements during period 1 (rainy season) was increased by average rainfall (859 mm) distributed evenly over period. 2.2 Nitrogen budget and nitrogen removal Nitrogen removal from the urban water body was calculated by the N mass balance approach (19). The N budget of the Varthur Lake in given by NInflow = NAlgae + NBacteria + NMacrophytes + NSludge + NunAcc + NOutflows where, NInflow is total Nitrogen influx into the lake in t/d, NAlgae is the N fixed in algal biomass, NBacteria is the N fixed in bacteria, NMacrophytes is N uptake by macrophytes, NSludge is N content of sludge/sediment, NunAcc is the N unaccounted and NOutflow is the N in effluent which comprise of NH3-N and NO3-N. 2.2. 1 Algal sampling and analysis 2.2.2 Bacterial sampling 2.2.3 Macrophytes sampling 2.2.4 Sediment/Sludge and water analysis For the study the lake was divided into five zones and sludge and water were sampled from these zones during the all seasons. The sludge collected was analyzed for the moisture content and the total N content as a function of residence time by Standard Methods. The water samples collected were analyzed for physico-chemical parameters (APHA, 1998). The Nr forms as NH3-N and NO3-N were analyzed based on Standard Methods. Citation: Durga Madhab Mahapatra, Chanakya H. N and T. V. Ramachandra, 2010, NR Budget and sustainable n-recovery in a sewage fed urban waterbody – case study of Varthur lake, Bangalore. Proceedings of the 5th International Nitrogen Conference on Reactive N Management for Sustainable Development - Science, Technology and Policy, 3-7 December 2010, New Delhi, India.
|
||||||||||||||||||||