|
Results and Discussion
Community analysis of macroinvertebrates: A total of 2010 individuals of aquatic macroinvertebrates belonging to 27 genera, 25 families, 10 orders and three phyla were identified from 36 ( both inlet and outlet) sampling sites in 17 lakes of Bangalore. Diversity of macroinvertebrate with the functional feeding groups is listed out in the table 2. Shannon diversity and Simpson’s diversity indices were higher in Bommasandra, and lower in Yellamma (1.81, 0.79 and 0.35, 0.20) inlet respectively. Species richness (Margalegf) was lower in Yellamma inlet (0.46) and higher in Malsandra inlet (2.18). Evenness was higher in Nellakondoddi (0.97) and lower in Malsandra (0.56) inlets (Table 3).
Table - 1a: Physico-chemical parameters of inlets and outlets of different urban lakes in Banalgore.
| S.No |
Place |
Code |
pH |
DO |
TU |
CO2 |
COD |
BOD |
Al |
| 1 |
Anchinapalaya |
AP(in) |
8.4 |
0 |
77.1 |
0 |
197.33 |
54.86 |
660 |
| AP(o) |
8.01 |
9.1 |
60.6 |
161.9 |
144 |
56.89 |
500 |
| 2 |
Lakkenahalli |
LH(in) |
7.41 |
5.53 |
7.66 |
158.4 |
154.67 |
40.63 |
420 |
| LH(o) |
7.45 |
0 |
4.4 |
3.52 |
176 |
37.93 |
180 |
| 3 |
Yellamma |
YM(in) |
7.7 |
0 |
44.4 |
7.04 |
64 |
74.5 |
420 |
| YM(o) |
7.73 |
2.6 |
48.9 |
9.152 |
101.33 |
68.4 |
560 |
| 4 |
Varthur |
VR(in) |
7.92 |
0 |
36.6 |
172.5 |
153.33 |
30.48 |
360 |
| VR(o1) |
7.53 |
2 |
86.9 |
14.08 |
133.33 |
37.25 |
380 |
| VR(o2) |
7.66 |
0.7 |
86.2 |
7.744 |
140 |
10.16 |
380 |
| 5 |
Abbigere |
AB(in) |
7.66 |
5.2 |
34.2 |
80.96 |
186.67 |
37.25 |
360 |
| AB(o) |
8.33 |
4.6 |
38.1 |
17.95 |
240 |
50.79 |
190 |
| 6 |
Kommagondana-halli |
KH(i) |
8.05 |
3.9 |
124 |
0 |
474.67 |
57.57 |
400 |
| KH(o) |
8.31 |
9.8 |
41.9 |
0 |
106.67 |
50.79 |
400 |
| 7 |
Malsandra |
MS(in) |
9.05 |
9.76 |
58.4 |
0 |
442.67 |
71.11 |
260 |
| MS(o) |
8.97 |
8.3 |
52.7 |
70.4 |
480 |
44.02 |
220 |
| 8 |
Valley school |
VS(i) |
9.05 |
6.2 |
19.3 |
0 |
248 |
12.87 |
510 |
| VS(o) |
8.7 |
8.13 |
14.6 |
88 |
232 |
10.16 |
500 |
| 9 |
Nellalondoddi |
ND(in) |
9.01 |
7.2 |
24.4 |
22.88 |
236 |
12.87 |
420 |
| ND(o) |
8.05 |
10.98 |
22.9 |
24.64 |
232 |
20.32 |
400 |
| 10 |
Vaderahalli |
VH(i) |
8.5 |
6.2 |
12.8 |
0 |
232 |
16.93 |
340 |
| VH(o) |
8.6 |
7.8 |
10.6 |
0 |
236 |
28.44 |
340 |
| 11 |
Begur |
BR(i) |
8.01 |
4.8 |
14 |
0 |
58.67 |
50.12 |
240 |
| BR(o) |
7.79 |
5.9 |
12 |
0 |
42.67 |
48.76 |
220 |
| 12 |
Hulimavu |
HU(i) |
7.49 |
3.09 |
17.4 |
99.12 |
53.33 |
44.7 |
238 |
| HU(o) |
7.4 |
4.9 |
53 |
99.12 |
42.67 |
38.6 |
256 |
| 13 |
Madivala |
MW(i) |
7.91 |
6.83 |
26.3 |
0 |
74.67 |
58.24 |
226 |
| MW(o) |
8.33 |
11.1 |
12.3 |
0 |
64 |
52.15 |
256 |
| 14 |
Rayasandra |
RS(i) |
8.4 |
10.41 |
17.7 |
0 |
42.67 |
61.63 |
660 |
| RS(o) |
7.8 |
4.6 |
28.1 |
7 |
37.33 |
49.44 |
660 |
| 15 |
Bommasandra |
BS(i1) |
8.5 |
13.01 |
67.6 |
0 |
138.67 |
52.82 |
1180 |
| BS(i2) |
8.5 |
0 |
66.6 |
0 |
58.67 |
60.27 |
1100 |
| BS(o) |
8.6 |
7.2 |
57.6 |
0 |
64 |
54.86 |
1100 |
| 16 |
Muthanallur |
MN(i) |
8 |
7.8 |
16.1 |
0 |
37.33 |
50.79 |
560 |
| MN(o) |
7.2 |
10.1 |
22.7 |
0 |
42.67 |
53.5 |
540 |
| 17 |
Hennagara |
HN(i) |
7.1 |
14.31 |
29.2 |
0 |
58.67 |
39.96 |
680 |
| HN(o) |
7.2 |
9.1 |
24.7 |
0 |
37.33 |
60.95 |
520 |
Table - 1b: Physico-chemical parameters of inlets and outlets of different urban lakes in Banalgore.
| S.No |
Place |
Code |
T.H |
C.H |
Cl |
Po4 |
No3 |
Na |
K |
| 1 |
Anchinapalaya |
AP(in) |
512 |
424.34 |
88.04 |
5.261 |
0.44 |
1420 |
1130 |
| AP(o) |
524 |
476.38 |
105.08 |
2.127 |
0.59 |
6564.5 |
1140 |
| 2 |
Lakkenahalli |
LH(in) |
564 |
472.38 |
105.08 |
0.091 |
0.5 |
287 |
68 |
| LH(o) |
712 |
568.45 |
244.24 |
0.163 |
0.23 |
1875 |
680 |
| 3 |
Yellamma |
YM(in) |
524 |
440.35 |
107.92 |
0.511 |
2.57 |
-- |
-- |
| YM(o) |
280 |
180.14 |
167.56 |
2.981 |
0.39 |
205.5 |
65.5 |
| 4 |
Varthur |
VR(in) |
236 |
184.15 |
90.88 |
2.984 |
1.74 |
200 |
52 |
| VR(o1) |
256 |
192.15 |
90.88 |
3.029 |
1.57 |
198.5 |
45.5 |
| VR(o2) |
236 |
164.13 |
82.36 |
2.422 |
1.7 |
198.5 |
48 |
| 5 |
Abbigere |
AB(in) |
404 |
344.27 |
221.52 |
0.65 |
0.23 |
273 |
2 |
| AB(o) |
228 |
184.15 |
133.48 |
0.12 |
0.55 |
197 |
39.5 |
| 6 |
Kommagondana-halli |
KH(i) |
444 |
392.31 |
136.32 |
2.964 |
3.22 |
201.5 |
62 |
| KH(o) |
1292 |
964.77 |
130.64 |
4.178 |
0.63 |
316.5 |
59.5 |
| 7 |
Malsandra |
MS(in) |
536 |
316.25 |
107.92 |
0.817 |
0.7 |
201.5 |
90.5 |
| MS(o) |
608 |
432.34 |
102.24 |
0.586 |
2.61 |
200 |
61.5 |
| 8 |
Valley school |
VS(i) |
276 |
68.05 |
127.8 |
- |
- |
230 |
7 |
| VS(o) |
252 |
48.04 |
19.88 |
0.26 |
0.18 |
179 |
16.5 |
| 9 |
Nellalondoddi |
ND(in) |
364 |
36.03 |
39.76 |
0.11 |
0.02 |
357.5 |
18.5 |
| ND(o) |
300 |
16.01 |
31.24 |
0.16 |
0.18 |
304.5 |
15.5 |
| 10 |
Vaderahalli |
VH(i) |
284 |
160.13 |
31.24 |
0.08 |
0.36 |
160.5 |
15 |
| VH(o) |
276 |
120.1 |
31.24 |
0.04 |
0.06 |
1325 |
16 |
| 11 |
Begur |
BR(i) |
176 |
96.08 |
116.44 |
0.025 |
0.57 |
205 |
52 |
| BR(o) |
224 |
96.08 |
110.76 |
0.005 |
0.73 |
179 |
48.2 |
| 12 |
Hulimavu |
HU(i) |
288 |
172.14 |
187.44 |
0.484 |
0.62 |
205 |
36 |
| HU(o) |
292 |
160.13 |
184.6 |
0.269 |
0.59 |
198 |
56 |
| 13 |
Madivala |
MW(i) |
236 |
88.07 |
119.28 |
0.039 |
0.62 |
303 |
45 |
| MW(o) |
272 |
92.07 |
110.76 |
0.059 |
0.62 |
202 |
59 |
| 14 |
Rayasandra |
RS(i) |
468 |
176.14 |
150.52 |
0.037 |
0.23 |
18.38 |
0 |
| RS(o) |
404 |
32.03 |
269.8 |
1.187 |
0.61 |
18.38 |
0 |
| 15 |
Bommasandra |
BS(i) |
480 |
348.28 |
335.12 |
0.265 |
0.18 |
22.84 |
0 |
| BS(i) |
524 |
260.21 |
346.48 |
0.282 |
0.17 |
23.39 |
0 |
| BS(o) |
488 |
268.21 |
346.48 |
0.31 |
0.19 |
23.95 |
0 |
| 16 |
Muthanallur |
MN(i) |
356 |
172.14 |
298.2 |
0.005 |
0.15 |
20.05 |
0 |
| MN(o) |
404 |
152.12 |
306.72 |
0.031 |
0.15 |
18.94 |
0 |
| 17 |
Hennagara |
HN(i) |
336 |
124.1 |
133.48 |
0.01 |
0.12 |
15.6 |
0 |
| HN(o) |
312 |
116.09 |
127.8 |
0.063 |
0.15 |
13.37 |
0 |
Table - 2: Macroinvertebrates diversity with FFG category of urban lakes of Bangalore.
| Order / Phylum |
Family |
Genus |
Code |
FFG |
| Ephemeroptera |
Baetidae |
Cloeon sp. |
Clo |
Collector-gatherer |
| Caenidae |
Caenis sp. |
Cae |
Scraper |
| Hemiptera |
Corixidae |
Micronecta sp. |
Min |
piercer (herbivores) |
| Notonectidae |
Nychia sp. |
Nyc |
Predators |
| Naucoridae |
Naucoris sp. |
Nau |
Predators |
| Belostomatidae |
Diplonychus |
Dip |
Predators |
| Pleidae |
plea sp. |
Ple |
Predators |
| Nepidae |
Laccotrephes sp. |
Lac |
Predators |
| Nepidae |
Ranatra sp. |
Ran |
Predators |
| Gerridae |
Gerris sp. |
Ger |
Predators |
| Odanata |
Coenagrionidiae |
Paraceriagrion sp. |
Cer |
Predators |
| Libellulidae |
Crocothemis sp. |
Cro |
Predators |
| Tricoptera |
leptoceridae |
Leptocerus sp. |
Lep |
Shredders |
| Coleoptera |
Gyrinidae |
Orectochilus sp. |
Ore |
Predators |
| Gyrinidae |
Gyrinus sp. |
Gyr |
Predators |
| Curculionidae |
Bagous sp. |
Bag |
Shredders |
| Diptera |
Chironomidae |
Chironominus sp. |
Chi |
Collector-gatherer |
| Culicidae |
Culex sp. |
Cul |
Collector-gatherer |
| Decapoda |
Carideae |
Caridina sp. |
Car |
- |
| Annelida |
Hirudinea |
Hirudinid sp. |
Hir |
Predators |
| Mollusca |
Planorbidae |
Indoplanorbis sp. |
Idp |
Scraper |
| Planorbidae |
Gyraulus sp. |
Grs |
Collector-gatherer |
| Physidae |
Physa sp. |
Phy |
Collector-gatherer |
| Thiaridae |
Melanoides sp. |
Mel |
Collector-gatherer |
| Viviparidae |
Bellamya sp. |
Bel |
Scraper |
| Bithynidae |
Gabbia sp. |
Gab |
Scraper |
| Lymnaidae |
Lymniana sp. |
Lym |
Collector-gatherer |
Table - 3: Diversity indices of macroinvertebrates in 17 inlets and outlets of different urban lakes of Bangalore
| |
Taxa |
Shannon (H) |
Simpson (1-D) |
Evenness |
Margalef |
| |
Inlet |
Outlet |
Inlet |
Outlet |
Inlet |
Outlet |
Inlet |
Outlet |
Inlet |
Outlet |
| AP |
2 |
3 |
0.60 |
0.88 |
0.41 |
0.54 |
0.91 |
0.80 |
0.51 |
0.60 |
| LH |
5 |
3 |
1.16 |
0.48 |
0.57 |
0.24 |
0.64 |
0.54 |
1.36 |
0.59 |
| YM |
2 |
3 |
0.35 |
0.90 |
0.20 |
0.53 |
0.71 |
0.82 |
0.46 |
0.96 |
| VR1 |
5 |
3 |
1.37 |
1.06 |
0.69 |
0.64 |
0.78 |
0.96 |
1.67 |
1.24 |
| VR2 |
- |
3 |
- |
1.08 |
- |
0.65 |
- |
0.98 |
- |
1.03 |
| AB |
4 |
3 |
1.12 |
0.69 |
0.61 |
0.40 |
0.77 |
0.66 |
1.25 |
0.67 |
| KH |
6 |
7 |
1.28 |
1.11 |
0.68 |
0.52 |
0.60 |
0.44 |
0.84 |
1.19 |
| MS |
5 |
9 |
1.62 |
0.84 |
0.72 |
0.40 |
0.56 |
0.46 |
2.18 |
1.00 |
| VS |
4 |
7 |
1.29 |
1.85 |
0.69 |
0.83 |
0.91 |
0.90 |
1.25 |
2.34 |
| VH |
3 |
5 |
1.04 |
1.03 |
0.63 |
0.51 |
0.95 |
0.56 |
0.72 |
1.01 |
| BR |
4 |
3 |
1.33 |
0.86 |
0.72 |
0.51 |
0.95 |
0.79 |
1.86 |
0.83 |
| MW |
4 |
5 |
1.28 |
1.26 |
0.69 |
0.66 |
0.90 |
0.71 |
1.54 |
1.48 |
| HU |
5 |
10 |
1.42 |
0.78 |
0.72 |
0.32 |
0.83 |
0.22 |
1.61 |
1.41 |
| RS |
4 |
7 |
1.26 |
1.85 |
0.69 |
0.83 |
0.88 |
0.91 |
1.04 |
2.50 |
| BS1 |
9 |
9 |
1.73 |
1.40 |
0.78 |
0.63 |
0.63 |
0.45 |
1.69 |
1.59 |
| BS2 |
9 |
- |
1.81 |
- |
0.79 |
- |
0.68 |
- |
1.90 |
- |
| MN |
5 |
4 |
1.06 |
1.28 |
0.54 |
0.69 |
0.58 |
0.90 |
0.97 |
1.54 |
| HN |
7 |
5 |
1.60 |
1.56 |
0.76 |
0.78 |
0.71 |
0.95 |
1.69 |
1.61 |
| ND |
3 |
7 |
1.07 |
1.79 |
0.64 |
0.81 |
0.97 |
0.86 |
0.83 |
1.91 |
Totally 26 genera of macroinvertebrates were found in the outlets, except Gabbia sp., belonging to the Bithynidae families, which was exclusively found at inlets. Genera like Caenis sp., Gerris sp., Orectochilus sp., Hirudinid sp., Bellamya sp. were not found in any of the inlets but were present in the outlets. Hemiptera was the major group present in inlets, which contained species like Micronecta sp., Diplonychus sp., Nychia sp., Naucoris sp., Ranatra sp., Laccotrephes sp. Plea sp., followed by Cloeon sp. of the order Ephemeroptera. Odanata, Diptera and Decapoda constituted >40% of total macroinvertebrate richness in inlets and other groups were < 40%. The most abundant groups were Micronecta sp. (34.61%) Chironominus sp (19.84%), Cloeon sp. (18.72), and whereas Bellamya sp. (0.04%) Gabbia sp. (0.04%) and Caenis sp (0.09%) were found very less while remaining groups of macroinvertebrates were moderately present.
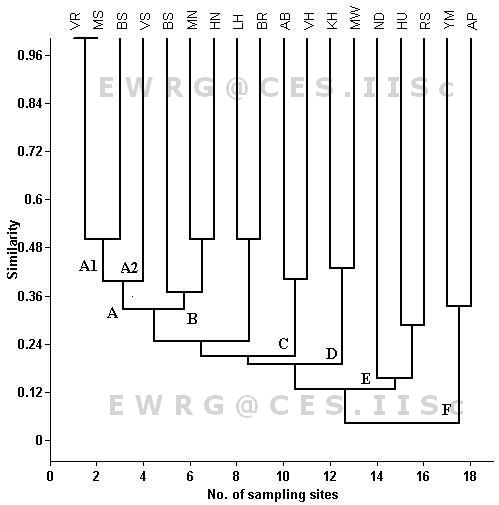
The result of Jaccard cluster analysis, based on macroinvertebrate presence/absence data, divided lake inlets into six basic clusters (A to F) as given in Figure 2. The first cluster A is subdivided into two clusters (A1, A2). Two lakes inlets (Varthur and Malsandra) were grouped under sub-cluster A1. The taxa of these two lakes are absolutely very similar. Sub cluster A1 consists of only lake (Valley School) and the common taxa found here were Cloeon sp, Indoplanorbis sp. and Ceriagrion sp. Cluster B consists of three lakes (Bommasandra, Muthanallur and Hennagara); they contained Cloeon sp., Micronecta sp., and Ceriagrion sp. Two lakes (Abbigere and Vaderahalli) were grouped under the cluster C, and the similar taxa found here were like Cloeon sp. and Cardia sp. Cluster D had two lakes ( Kommagondanahalli and Madivala), characterized by the commonness of Cloeon sp., Diplonychus sp. and Bagous sp. Three lakes were grouped under cluster E had Chironominus sp. The cluster F (Anchepalya and Yellamma lakes) characterized by Naucoris sp. had very less diversity.
Figure - 2: Cluster analysis of Jaccard index similarity macroinvertebrate present in different urban lakes inlets of Bangalore. For lake codes see Table -1
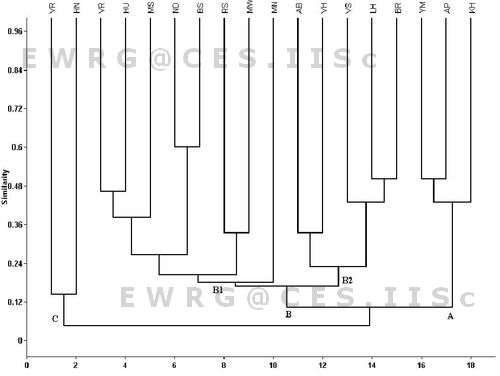
Eighteen outlet sites were divided into three basic clusters based on presence and /or absence data (Figure 3). The cluster B is divided into two subclusters B1 and B2. B1 has two groups, one based on high genera richness (7 to 10) and the second with lesser richness (4 to 7). In this group of lakes the taxa commonly found were Cloeon sp., Micronecta sp., Nychia sp., Ceriagrion sp. Subcluster B2 consists of five lakes namely Begur, Lakkenahalli, Valley School, Abbigere and Vaderahalli containing common taxa like Cloeon sp., and Caridina sp. The cluster A includes 3 lake outlets (Yellamma, Anchepalya and Kommagondanahalli) with relative less diversity in Yellamma and Anchepalya; these had very similar taxa like Micronecta sp., Bagous sp. and Chironominus sp. Cluster C also contain less diversity in Varthur outlet 2 and Hennagara lakes. The results of one way ANOVA pointed out that no significant differences (P < 0.05) were found between the macroinvertebrate communities of inlets and outlets of urban lakes of Bangalore.
Figure 3: Cluster analysis of Jaccard index similarity macroinvertebrate present in different urban lakes outlets of Bangalore. For lake codes see Table -1.
The function feeding group of collectors- gatherer ranged between 0 and 96.5% in inlets of lakes, where as outlets ranged between 0 and 98.1% (Table 4). Six lakes were found to have higher values for outlets than for inlets. The scrapers ranged from 0 to 70% in inlets and outlets of lakes. The piercer - herbivores was recorded ranged between 0 and 88.9% in inlets of lakes, whereas outlets range from 0 to 40%. The predator was recorded ranged between 0 and 44.4% in inlets of lakes, while the outlets ranged between 0 and 70%. The shredder was recorded range between 0 and 30.9% in inlets of lakes, whereas outlets range from 0 to 20%, which are almost consequently absent in lakes except Valley school, Varthur and Bommasandra. The result of trophic categorization showed collector-gatherer and scraper as predominant groups in both regions of inlets and outlets of different lakes in Bangalore. In many studies focused on lake outlets, the predominant invertebrate groups are filter feeders such as simuliidae, net spinning trichoptera and other filter-feeder invertebrates in mountain lakes (Richardson and Mackay 1991). In this study, collector-gatherer and scrapers were found dominant near outlets due to increased periphyton growth caused by nutrient availability and enhanced light (Gullan and Cranston, 2010). The assemblage of predators was observed high near inlets as they depend on primary consumers like collectors and scrapers as their food source, similar to the earlier reports by Sheldon and Oswood (1977).
Table - 4: Functional Feeding Group (%) of macroinvertebrates in inlets and outlet of 17 lakes of Bangalore.
| S.no |
Places |
Collector (%) |
Piercer (%) |
Predators(%) |
Scraper(%) |
Shredders(%) |
| Inlet |
Outlet |
Inlet |
Outlet |
Inlet |
Outlet |
Inlet |
Outlet |
Inlet |
Outlet |
| 1 |
AP |
71.4 |
57.1 |
28.6 |
0.0 |
0.0 |
0.0 |
0.0 |
42.9 |
0.0 |
0.0 |
| 2 |
LH |
70.6 |
89.3 |
0.0 |
0.0 |
29.4 |
10.7 |
0.0 |
0.0 |
0.0 |
0.0 |
| 3 |
YM |
0.0 |
0.0 |
88.9 |
0.0 |
11.1 |
62.5 |
0.0 |
37.5 |
0.0 |
0.0 |
| 4 |
VR |
20.0 |
0.0 |
0.0 |
40.0 |
26.7 |
0.0 |
53.3 |
40.0 |
0.0 |
20.0 |
| |
VR |
- |
0.0 |
- |
0.0 |
- |
60.0 |
- |
40.0 |
- |
0.0 |
| 5 |
AB |
85.7 |
0.0 |
0.0 |
0.0 |
14.3 |
33.3 |
0.0 |
0.0 |
0.0 |
0.0 |
| 6 |
KH |
48.3 |
21.4 |
6.9 |
4.5 |
0.3 |
3.9 |
44.5 |
70.1 |
0.0 |
0.0 |
| 7 |
MS |
81.8 |
98.1 |
0.0 |
0.0 |
9.1 |
1.9 |
9.1 |
0.0 |
0.0 |
0.0 |
| 8 |
ND |
96.5 |
46.0 |
0.0 |
0.0 |
3.5 |
40.0 |
0.0 |
14.0 |
0.0 |
0.0 |
| 9 |
VS |
0.0 |
20.0 |
0.0 |
0.0 |
42.9 |
70.0 |
42.9 |
0.0 |
14.3 |
10.0 |
| 10 |
VH |
83.3 |
63.6 |
0.0 |
0.0 |
16.7 |
36.4 |
0.0 |
0.0 |
0.0 |
0.0 |
| 11 |
BR |
55.6 |
70.0 |
0.0 |
0.0 |
44.4 |
30.0 |
0.0 |
38.5 |
0.0 |
0.0 |
| 12 |
MW |
33.3 |
53.8 |
0.0 |
0.0 |
16.7 |
7.7 |
50.0 |
9.2 |
0.0 |
0.0 |
| 13 |
HU |
42.9 |
89.8 |
0.0 |
0.0 |
14.3 |
1.0 |
42.9 |
25.0 |
0.0 |
0.0 |
| 14 |
RS |
0.0 |
25.0 |
0.0 |
0.0 |
30.0 |
50.0 |
70.0 |
0.0 |
0.0 |
0.0 |
| 15 |
BS |
23.5 |
59.1 |
0.0 |
11.4 |
17.6 |
26.1 |
27.9 |
3.4 |
30.9 |
0.0 |
| |
BS |
34.5 |
- |
0.0 |
- |
8.6 |
- |
56.9 |
- |
0.0 |
- |
| 16 |
MN |
89.4 |
50.0 |
0.0 |
0.0 |
10.6 |
0.0 |
0.0 |
0.0 |
0.0 |
0.0 |
| 17 |
HN |
71.4 |
33.3 |
0.0 |
0.0 |
14.3 |
66.7 |
14.3 |
0.0 |
0.0 |
0.0 |
Environmental Parameters: In natural waters, the pH is between 6.0 and 8.5. Lower values indicate acid water which could be related to the higher presence of CO2 and/or higher organic matter content. pH values of all the study sites higher than 7 may indicate alkaline water. The pH ranged between 7.1 and 9.05 in different urban lakes of Bangalore (Table-1). It was higher in Malsandra and Valley School and lower in Hennagara lake. In the study area rain water and surface runoff were found to lower pH. In addition, pH values were significantly affected by mixing of sewage and industrial water. These values were within the permissible limits except in the Malsandra and Valley School lakes. Similar observation was made in Perumal lakes, Cuddalore, by Vijayakumar et al., (2010). The higher values of pH recorded in Malsandra could be attributed to increased primary productivity wherein carbonates, sulfates, nitrates and phosphates are converted to hydroxyl ions. Dissolved oxygen (DO) analysis measures the amount of gaseous oxygen (O2) dissolved in an aqueous solution. The DO was practically absent in Anchepalya, Yellamma, Varthur, Bommasandra lake inlets and Lakkenahalli lake outlets. The dissolved oxygen obviously decreased by the process of eutrophication causing algal death and decomposition. Carpenter et al., (1998) state that increased nutrient concentration in the water causes decrease in aquatic oxygen level. These two reasons and the dense growth of floating water weeds like Eichornia, Pistia, Lemna and other organisms characterised these study sites. The dense growth of water weeds, covering the surface, blocks atmospheric oxygen reaching into the water body and the absorption of dissolved oxygen by their roots create oxygen depletion in the aquatic ecosystem as a whole. The highest dissolved oxygen values were recorded at Hennagara (14.31 mgL-1); it was believed to be due to the faster flow and more mixing of rain water. Water turbidity affects the amount of light penetration into a lake, which decreases in the presence of suspended material and colour in the water. Suspended material is often associated with phytoplankton biomass and so transparency level can be an indication of the amount of algal growth in the water. Turbidity recorded ranged between 4.4 (Lakkenahalli) to 124 NTU (Kommagondanahalli). WHO (1984) prescribed highest desirable limit 5.0 NTU and maximum permissible limit 25.0 NTU. Turbidity level exceeding 25 NTU in water, affects the aesthetic quality of water significantly. In all the lakes studied turbidity observed was beyond the permissible limit except in Lakkennahalli, Valley School, Vaderahalli and Nellakkondoddi lakes. The hardness of water is not a pollution parameter but indicates water quality. It is defined as the major divalent cations present in water, notably Calcium and Magnesium. It was observed in the range from 176 mgL-1 (Begur) to 1292 mgL-1 (Kommakondahalli). All the lakes observed were within the permissible limit of 600 mgL-1 (BIS, 2004) except in Lakkennahalli, Kommagondahalli and Malsandra outlets which were above this limit. The COD test is indirect measurement of oxygen required to oxidise organic/inorganic matter such as pollutants. High oxygen is required to oxidize the inorganic pollutants at Kommagondanahalli lake (474.64 ppm) and the minimum was required at Hennagara, Bommasandra and Rayasandra lake outlets (37.33 ppm). The values that exceed the permissible limit (40 ppm) indicate the fact that these water bodies were in eutrophic condition. Bio-chemical Oxygen Demand (BOD) is used for assessing the organic load in water body; it has a positive correlation with temperature. On increasing the temperature biochemical oxygen demand also increases. This may be attributed to the photosynthetic activity and abundance of phytoplankton during hot period. The BOD value was recorded range between 10.16mgL-1and 74.5 mgL-1. Almost all the lakes were indicated in eutrophic condition. The higher concentrations of chlorides indicate higher degree of organic pollution (Munawar 1970). The concentration of chloride fluctuated between 19.28 ppm of Valley School and 346.8 ppm of Bommasandra. In Bommasandra it may be due to high anthropogenic activities (bathing, washing, cattle washing), entry of industrial and domestic sewage etc. Total alkalinity of water is due to the presence of mineral salts present in it. It is primarily caused by the carbonate and bicarbonate ions. Total water alkalinity of the inlets and outlets of 17 lakes fluctuated from 180 -1180 mgL-1. They were within permissible limits except at Anchepalya, Bommasandra, Rayasandra and Hennagara inlets. Bommasandra lake had highest concentration due to the discharge of industrial waste into it. Phosphate occurs in various forms like orthophosphates, condensed phosphates and naturally found phosphates. Their presence in water is due to detergents, from used boiler waters, fertilizers and due to biological processes. They occur as detritus in the bodies of aquatic organisms. Inorganic phosphorus plays a dynamic role in aquatic ecosystems and it is one of the most important nutrients when present in low concentration, but in excess along with nitrates and potassium, cause algal blooms (Ramachandra et al., 2002). The highest value (5.26 mgL-1) of phosphate was recorded at Anchepalya lake, while the minimum value (0.005 mgL-1) was recorded at Begur lake.
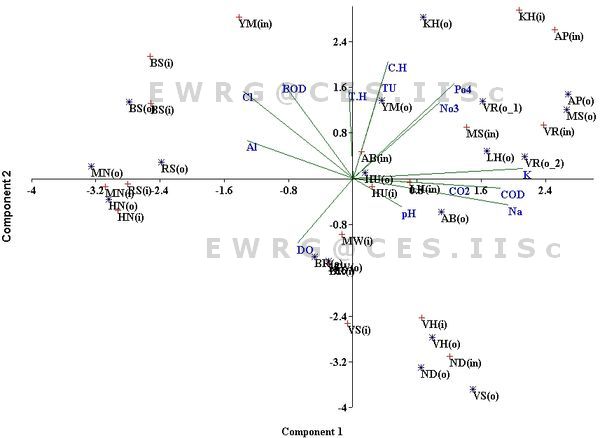
The physico-chemical parameters of water samples in inlet and outlets of different lakes are listed in table 1. Fourteen abiotic variables were combined in different lakes of Bangalore. A two- dimensional biplot representing PC1 and PC2 is shown in figure 4. The PC1 axis accounted for 25.69 % of the overall variance and was most heavily weighted on the variables pH, total harness, Dissolved oxygen, and Nitrate. These ordinations are positively correlated to physico-chemical parameters (total hardness, nitrate, turbidity, calcium hardness and potassium) with Varthur, Anchepalya, Yellamma, Kommagondanahalli lakes, Malsandra, Lakkenahalli outlets and Hulimavu inlets, whereas negatively correlated with Madivala, Begur, Hennagara and Muthanallur lakes. The second axis accounted for 22.67% of the variance and large contributions was by COD, free carbon dioxide, dissolved oxygen, chloride, BOD, and Alkalinity in which loadings for first two variables was positively correlated with Abbigere, Vadarahalli, Nellakondadotti lakes and Valley School outlets, and negative for the last four variables as with Bommasanda, Rayasandra lakes and Yellamma inlets.. The remaining principal components’ axis was accounted in less significant variance.
Figure 4: Principle component analysis (PCA) shows that relationship between environmental parameter and different sampling sites of various urban lakes in Bangalore. Details of code are given in the table - 1.
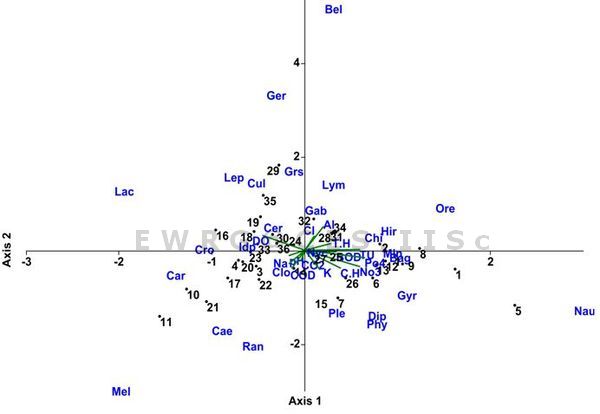
Macroinvertebrates assemblages in relation to environment: The results of CCA ordination for 26 aquatic genera, 17 lakes (both 18 inlet and 18 outlets) and 14 environmental variables showed that about 22.33%, 16.35%, 12.2%, 11.1% of the variance in species abundance accounted for the first four ordination axes (Figure 5). Eigen values for first four axes were 0.381, 0.279, 0.208, and 0.189. The first and third ordination was related to phosphate, nitrate and turbidity. The total alkalinity, dissolved oxygen, and chloride were in second ordination. Fourth ordination comprised free carbon dioxide, turbidity, nitrate and potassium. Macroinvertebrates and environmental factors ordination showed that the species were highly related to nitrate, phosphate, pH and dissolved oxygen. Macroinvertebrates like Indoplanorbis sp. Ceriagrion sp., Leptocerus sp. Crocothemis sp were positively correlated with increasing DO and pH. Chironominus sp., Gyrinus sp. Naucoris sp. Diplonychus sp.,and Bellamya sp. were negatively correlated with increasing DO and pH, but positively correlated with increased chloride, BOD, turbidity, phosphate, nitrate and total hardness. Plea sp., Cloeon sp., and Nychia sp. were positively correlated with COD. Lymniana (pseudosuccinia sp.), Gerris sp., Orectohillus sp., Chironominus sp., and Hirudinid sp. were positively correlated with increased total alkalinity, total hardness and chloride.
Figure 5: CCA analysis of macroinvertebrates and environmental parameters of seventeen lakes of Bangalore. Details of code are given as table 1 and 2.
The taxonomic composition 27 genera of macroinvertebrates were obtained out of which, 25 were found in outlets and 21 in inlets. The differences between taxonomic compositions were not significant at inlets and outlets of different lakes. Generally aquatic species are not predominant at inlet sites and most abundant at nearby outlets. This contradiction suggests that certain fundamental physical conditions differ between outlet and non-outlet habitats, or that attributes providing an advantage in one habitat do not operate similarly in another (Richardson and Mackay 1991). However, the result of one way ANOVA based on the study of eutrophic lakes shows no significant variation between inlets and outlets. This indicate inlet and outlet sites of each lake are polluted to the same extent of pollution level; it means pollution levels have surpassed sustenance of sensitive macroinvertebrate species and self cleansing capability of the lake ecosystem.
Canonical component analysis for understanding the relationships between aquatic macroinvertebrate and environmental factors clearly shows that macroinvertebrates were affected by some environmental factors such as, phosphate, nitrate, alkalinity chloride, biological oxygen demand and turbidity of water column which decide the distribution and abundance of species. Apart from these variables, pH, dissolved oxygen and chemical oxygen demand were important factors. Ward and Stanford (1979) reported that environmental parameters such as water velocity; temperature and substrate are the major factors determining the composition of macroinvertebrates. Results of the current study reveal that (along with earlier well studied parameters) phosphate, nitrate, turbidity pH and dissolved oxygen are the main factors deciding the macroinvertebrate diversity and abundance in urban lakes. For example dissolved oxygen was conspicuously absent in Anchepalya, Yellamma, Varthur, Bommasandra inlets and Lakkenahalli outlet sites, which affect the diversity and abundance of macroinvertebrates by changes in the physico-chemical properties of water. The dissolved oxygen level decreases with increased environmental stress, while the other environmental variables increase (Bretschko and Klemens, 1983; Gabriels et al, 2010) and affects adversely.
|
