|
RESULTS
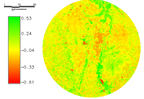
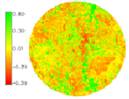
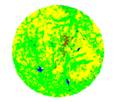
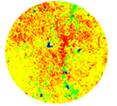
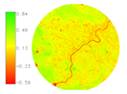
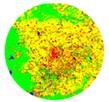
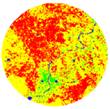
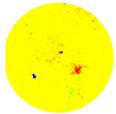
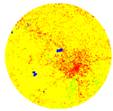
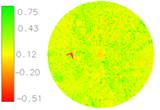
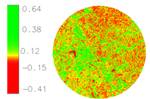
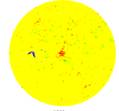
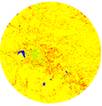
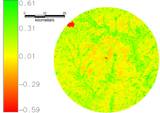
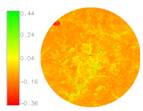
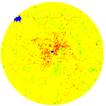
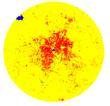
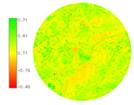
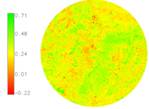
Vegetation cover analysis: Vegetation cover was assessed through NDVI, Mysore shows that area under vegetation has declined to 9.24% (2009) from 57.58% (1973). Shimoga analysis reveals that there was reduction in the vegetation cover from 89% to 66% during the past two decades in the region. In Hubli vegetation has declined from 97% (1989) to 78% (2010) in Hubli and from 98% (1989) to 86% (2010) in Dharwad. Gulbarga and Raichur analysis showed area under vegetation has declined by about 19%. Belgaum analysis indicate that the vegetation in the study region decreased for 98.8% in 1989 to 91.74% in 2012. Temporal NDVI values are listed in Table 2 and outputs are presented in Appendix 1.
Table 2: Land cover analysis (v: are under vegetation in %; nv: area under non-vegetation in %)
| In % |
Mysore |
Shimoga |
Hubli |
Dharwad |
| 1980’s |
V=57.58
Nv=42.42 |
V=89.35
Nv=10.65 |
V=97.0
Nv=3.0 |
V=98.12
Nv=1.88 |
| 2000’s |
V=09.24
Nv=90.76 |
V=66.72
Nv=33.28 |
V=78.31
Nv=21.69 |
V=86.43
Nv=13.57 |
| In % |
Gulbarga |
Raichur |
Belgaum |
Bellary |
| 1980’s |
V=94.72
Nv=5.28 |
V=92.18
Nv=7.82 |
V=98.41
Nv=1.59 |
V=94.87
Nv=5.13 |
| 2000’s |
V=79.41
Nv=20.57 |
V=82.48
Nv=17.52 |
V=91.74
Nv=8.26 |
V=93.7
Nv=6.27 |
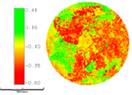
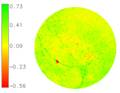
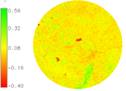
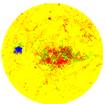
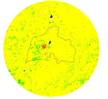
Land use analysis: Land use assessed using Gaussian maximum likelihood classifier. In Mysore there has been a significant increase in built-up area during the last decade evident from 514 times increase in urban area from 1973 to 2009. Shimoga also witnessed increase in the urban category from 13% (1992) to 33% (2010), which is about 253 times during the last four decades. Hubli-Dharwad also saw a significant increase in built-up area during the last decade, Hubli saw an increase of about thousand times, whereas Dharwad was about 600 times growth in urban area, Gulbarga has seen a significant increase in built-up area during the last decade evident from 21% increase in urban area. Raichur and Bellary also witnessed increase in built-up area during the last decade about 590 and 700 times during the last 4 decades. Belgaum analysis indicate that the urban impervious land use has increased from 0.31 % in 1989 to 6.74% in 2012 Consequent to these, vegetation cover and water has declined drastically during the past four decades in all cities. Temporal Land use values are listed in Table 3 and outputs are presented in Appendix 2.
Table 3: Land use analysis
| Class |
Mysore |
Shimoga |
Hubli |
Dharwad |
| Urban |
1980’s=1.1
2000’s=18.68 |
1980’s=13.58
2000’s=33.56 |
1980’s=1.08
2000’s=14.62 |
1980’s=0.62
2000’s=6.47 |
| Veg |
1980’s=65.85
2000’s=5.7 |
1980’s=30.94
2000’s=5.52 |
1980’s=0.22
2000’s=0.42 |
1980’s=1.43
2000’s=0.69 |
| Water |
1980’s=0.39
2000’s=0.7 |
1980’s=1.52
2000’s=1.2 |
1980’s=0.64
2000’s=0.65 |
1980’s=0.51
2000’s=0.47 |
| others |
1980’s=32.6
2000’s=74.84 |
1980’s=53.95
2000’s=59.72 |
1980’s=98.06
2000’s=84.30 |
1980’s=97.45
2000’s=92.36 |
| Class |
Gulbarga |
Raichur |
Belgaum |
Bellary |
| Urban |
1980’s=2.62
2000’s=22.52 |
1980’s=1.44
2000’s=8.51 |
1980’s=0.31
2000’s=6.74 |
1980’s= 2.12
2000’s=7.42 |
| Veg |
1980’s=1.54
2000’s=0.49 |
1980’s=1.62
2000’s=4.81 |
1980’s=4.62
2000’s=2.44 |
1980’s=4.61
2000’s=0.48 |
| Water |
1980’s=0.40
2000’s=0.39 |
1980’s=0.88
2000’s=0.97 |
1980’s=0.14
2000’s=0.24 |
1980’s=2.35
2000’s=2.04 |
| others |
1980’s=95.44
2000’s=76.60 |
1980’s=96.16
2000’s=85.71 |
1980’s=94.9
2000’s=91.58 |
1980’s=90.92
2000’s=90.07 |
Shannon’s entropy computed using temporal data as listed in table 4. Mysore is experiencing the sprawl in all directions as entropy values are closer to the threshold value (log (8) = 0.9). Lower entropy values during 70’s shows an aggregated growth as most of urbanization were concentrated at city centre.
Table 4: Shannon entropy index
|
NE |
NW |
SE |
SW |
|
| Mysore |
0.067 |
0.007 |
0.0265 |
0.008 |
1980’s |
| 0.452 |
0.441 |
0.346 |
0.305 |
2000’s |
| Shimoga |
0.23 |
0.24 |
0.18 |
0.25 |
1980’s |
| 0.43 |
0.7 |
0.42 |
0.47 |
2000’s |
| Hubli |
0.027 |
0.02 |
0.055 |
0.011 |
1980’s |
| 0.369 |
0.134 |
0.49 |
0.128 |
2000’s |
| Dharwad |
0.011 |
0.013 |
0.008 |
0.006 |
1980’s |
| 0.168 |
0.164 |
0.213 |
0.216 |
2000’s |
| Gulbarga |
0.086 |
0.065 |
0.046 |
0.055 |
1980’s |
| 0.268 |
0.212 |
0.193 |
0.141 |
2000’s |
| Raichur |
0.023 |
0.026 |
0.026 |
0.027 |
1980’s |
| 0.135 |
0.146 |
0.168 |
0.194 |
2000’s |
| Bellary |
0.04 |
0.03 |
0.08 |
0.06 |
1980’s |
| 0.37 |
0.32 |
0.389 |
0.33 |
2000’s |
| Belgaum |
0.005 |
0.0191 |
0.0034 |
0.008 |
1980’s |
| 0.086 |
0.1652 |
0.1154 |
0.137 |
2000’s |
However, the region experienced dispersed growth in 90’s reaching higher values of 0.452 (NE), 0.441 (NW) in 2009. Sprawl analysis for Shimoga reveals of sprawl in the North West, while significant growth was observed in North East, South East and South west but fragmented due to presence of cultivable land in these regions. Hubli - Dharwad is experiencing the sprawl in all directions as entropy values are gradually increasing (for Hubli: log (12) = 1.07 For Dharwad: log (7) = 0.845). Lower entropy values of 0.02 (NW), 0.011 (SW) during late 80’s shows an aggregated growth as most of urbanization were concentrated at city center. However, the region experienced dispersed growth in 80’s reaching higher values in NE, and SE in 2010. Gulbarga is experiencing the sprawl in all directions as entropy values are closer to the threshold value (log (10) = 1). Lower entropy values during 0’s shows an aggregated growth. However, the region show a tendency of dispersed growth during post 2000 with higher entropy values 0.268 (NE), 0.212 (NW) in 2010 (and threshold is 0.77). Increasing entropy values from 1982 to 2010 shows the tendency of dispersed growth of built-up area in the city with respect to 4 directions as we move towards the outskirts and this phenomenon is most prominent in SE and SW directions. Increasing entropy values from 1973 to 2010 shows the tendency of dispersed growth of built-up area in the city with respect to 4 directions as we move towards the outskirts and this phenomenon is most prominent in SE and NE directions. The threshold limit of Shannon’s Entropy is log11 (1.041). The results indicated that though Belgaum considering the buffer region has effect of urban sprawl considering the values of 1980 and 2012, and the effect is gaining strength temporally considering the threshold value of 1.041.
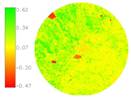
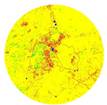
Spatial patterns of urbanisation: In order to understand the spatial pattern of urbanization, seven landscape level metrics were computed zone wise for each circle. Prominent two metrics ([1]) are discussed below: Number of Urban Patch (Np) reflects the extent of fragmentation of a particular class in the landscape. Higher the value more the fragmentation, Lower values is indicative of clumped patch or patches forming a single class and ranges from 0 (fragment) to 100 (clumpiness). The analysis (Fig. 2) showed that all the cities except Hubli Dharwad and Belgaum are becoming clumped patch at the center, which indicates that the urban dominance and eradication of other classes present in past decades, while outskirts are relatively fragmented in all direction, but show a tendency of forming a single clumped class in the whole landscape considered. Hubli- Dharwad and Raichur have shown fragmentation over years both at the centre and outskirts indicative of newer urban patches in the landscape in recent decade. Further understanding this planners have to visualise the future to balance all land use to avoid unsustainable growth or complete urban dominance.
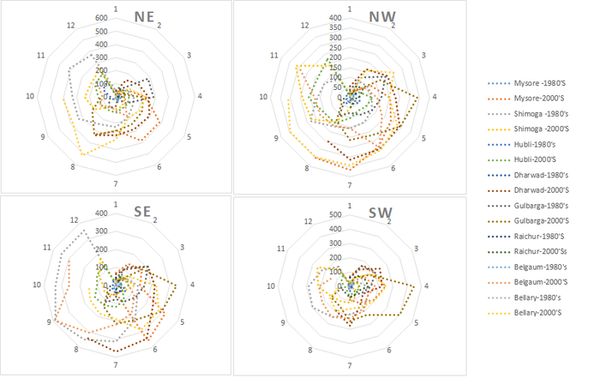
Figure 2: Number of urban patches in different zones and gradients
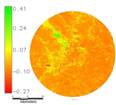
Normalised Landscape Shape Index (NLSI): NLSI calculates the value based on particular class rather than landscape and is equal to zero when the landscape consists of single square or maximally compact almost square, its value increases when the patch types becomes increasingly disaggregated and is 1 when the patch type is maximally disaggregated. Basically this metrics quantitatively captures the growth or phenomena through shape of a landscape. The analysis revealed and supported the previous metrics that the central gradients are in the process of converting to simple shapes and values are decreasing over decades, which again points to the fact of urban dominance over other land use classes in this region. However the Hubli, Dharwad and Belgaum analysis is an indicative of the yet more convoluted shapes the value being close to one than in 1980, and supports the argument that they have fragmented growth at the centre and outskirts extending to the buffer zones (Fig. 3).
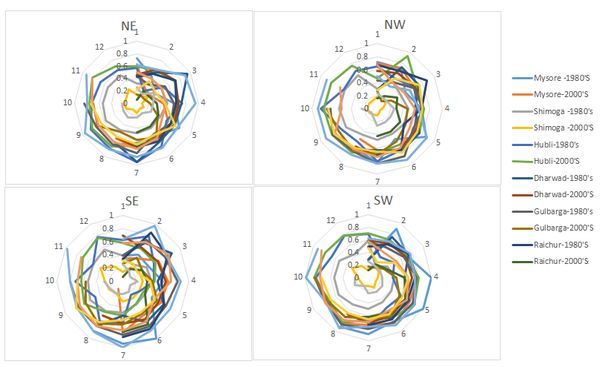
Figure 3: Normalised Landscape Shape Index in different zones and gradients
 |
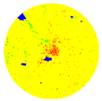
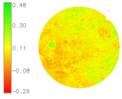
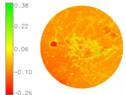
Appendix I: Land cover |
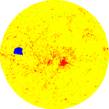
Appendix II: Land use |
| |
1980’s |
2000’s |
1980’s |
2000’s |
| Mysore |
 |
 |
 |
 |
| Shimoga |
 |
 |
 |
 |
| Hubli |
 |
 |
 |
 |
| Dharwad |
 |
 |
 |
 |
| Gulbarga |
 |
 |
 |
 |
| Raichur |
 |
 |
 |
 |
| Bellary |
 |
 |
 |
 |
| Belgaum |
 |
 |
 |
 |
|
