T. V. Ramachandra 1, *, B. Alakananda 1, Ali Rani 2 and M. A. Khan 2
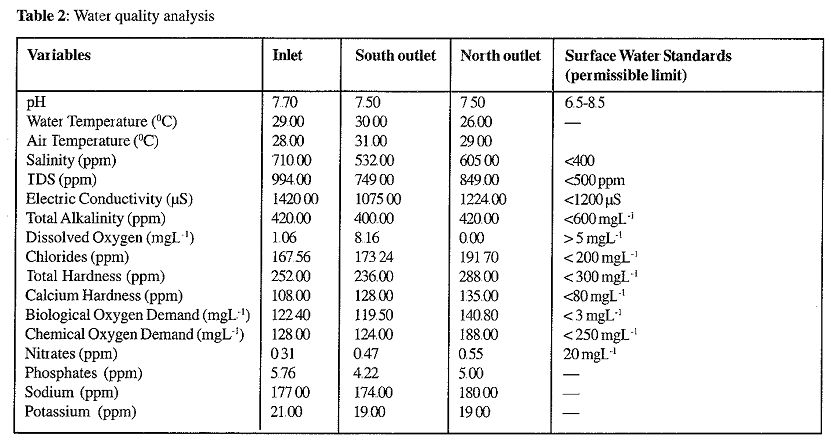
1 Energy & Wetlands Research Group, Centre for Ecological Sciences, Indian Institute of Science, Bangalore – 560 012, India 2 K K English High School, Varthur, Karnataka (India) E-mail: cestvr@ces.iisc.ac.in, alka@ces.iisc.ac.in RESULTSWater quality analysis Characteristics of water collected from various sampling sites are listed in Table 2. pH ranges from 7.5-7.7 across sampling sites. Conductivity was found to be high in inlet (1420 µS) compared to outlet sampling sites (South outlet, 1075 and North outlet, 1224 µS). Higher conductivity value at inlet was mainly due to the sustained sewage inflow and dissociation of minerals from soil . Total Dissolved Solids which accounts for the amount of sedimentation did not show much variation (749-994 ppm) in lake. Dissolved oxygen (DO) was 0 ppm and 1.06 ppm as observed in inlet and north outlet respectively while at south outlet 8.16 ppm was recorded. Biological Oxygen Demand (BOD) was higher (119-140 ppm) at the inlet which confirms the inflow of higher amount of nutrients into the lake. Chemical Oxygen Demand (COD) range (124-188 ppm) indicates the presence of increased oxidizable load. This highlights the anoxic conditions prevailing at inlets. Total hardness and alkalinity were found in the range of 236-288 ppm and 400-420 ppm respectively. The sodium and potassium values are 174-180 ppm and 19-21 ppm respectively. Nitrates and phosphates varied from 0.31-0.55 ppm and 4.22-5.76 ppm respectively. Phosphates values are above the permissible range. Table 2: Water quality results
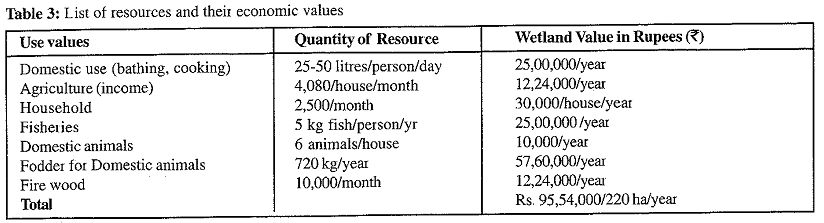
Socio-economic survey A total of 235 people from 43 houses were surveyed for evaluating the level of dependence for goods and services of Varthur Lake, which are listed in Table 3. Table 3: List of resources and their economic value
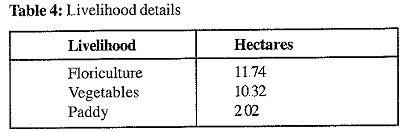
Domestic use: Few residents in the catchment area depend on lake for domestic usage due to its poor quality. Among all, 15 houses rely on bore wells. Ground water or bore well water usages are categorized as indirect use value as wetlands play significant role in recharging the groundwater sources in and around catchment area. On an average 5 individuals in a house utilize 200 liters of water per day. The dependency value is Rs. 25, 000 per house per year. For drinking water the amount spend on bottled water accounts to Rs. 30,000 per house per year. Agriculture: Among 43 households surveyed, 35 houses depend on agriculture for livelihood. Wetland water is utilized for irrigating a total land area of 24.28 ha for growing mainly paddy, radish, carrot, tomato, chilly, coconut, beetle leaf and floriculture and the area under each crop is listed in Table 4. Table 4: Livelihood Details
Apart from this, many paddy, coconut and beetle fields are cultivated nearby which are not included in this survey. The dependency for water for agriculture amounts to Rs. 12, 24,000 every year. Livestock: On an average 5 animals viz. Cows, buffaloes, sheep and goats were reared in each house. Water hyacinth and other aquatic weeds (Eichornia crassipes., Typha sp., Alternanthera sp. etc) are utilized as feed for cattles. Farms rely on the sale of dairy products for part of their income. The dependency for livestock (fodder) and for washing purposes amounts to Rs. 57, 60,000 and Rs. 10,000 per 6 cows every year respectively. Fisheries: 5 residents depend on aquaculture for occupation. Fishing is the major source for people nearby. As per the survey consumption of fish is 5 kg/person/year and the value from fisheries amounts to Rs 25,00,000/year. Fire wood (Energy): The dependency of people for the fire wood on the wetland amounts to Rs. 10,000 per year.
Citation: Ramachandra T. V., Alakananda B, Ali Rani and Khan M A, 2011, Ecological and socio-economic assessment of Varthur wetland, Bengaluru (India), J Environ Science & Engg, Vol 53. No 1. p 101-108, January 2011
| ||||||||||||||||||||||||||||||||||||||||||||||||||||||||||||||||||||||||||||||||||||||||||||||||||||||||||||||||||||||||||||||||||||||||||||||||||||||||||||||||
