| Back | 3. Results and Discussion |
| 3.1 Sorption equilibria studies |
The equilibria of biosorption of iron were modeled using adsorption-type isotherms. The Freundlich and Langmuir models were used to describe the biosorption equilibrium.
The Langmuir equation, which is valid for monolayer sorption onto a surface of finite number of identical sites, is given by:
![]()
where q is milligrams of metal accumulated per gram of the biosorbent material; Ceq is the metal residual concentration in solution; qmax is the maximum amount of the metal ion per unit weight of the biosorbent to form a complete monolayer on the surface bound at high Ceq. qmax represents a practical limiting adsorption capacity when the surface is fully covered by metal ions and assists in the comparison of adsorption performance. b is the constant related to the affinity of the binding sites.
When the initial metal concentration rises, adsorption increases till the binding sites are not saturated. The linearised Langmuir isotherm allows the calculation of adsorption capacities and Langmuir constants and is equated by the following equation.
![]()
The linear plots of Ceq/q versus Ceq show that adsorption follows the Langmuir adsorption model (Fig. 1).
The essential characteristics of the Langmuir isotherms can be expressed in terms of a dimensionless constant separation factor or equilibrium parameter, RL which is defined as:
RL=1/(1+b Co)
where b is the Langmuir constant and Co is the initial concentration of Fe(III). The RL value indicates the shape of isotherm as shown in Table 1. An isotherm is favorable, if its fixation capacity grows rapidly with concentration in equilibrium in liquid phase, convex form. The maximum for a highly favorable isotherm is irreversible adsorption, where the amount adsorbed does not depend on the decrease in concentration, down to very low values, unlike unfavorable isotherms, which have a low adsorption capacity at low concentrations in equilibrium, concave forms.
The RL values between 0 and 1 indicate favorable adsorption23. The RL were found to be 0.754 to 0.1612 for the initial concentrations of 25-500 mg/L Fe(III), indicating that the adsorption of Fe(III) by bgh was favorable.
The Freundlich isotherm is represented by the equation24,
q= Kf Ceq1/n
where Ceq is the equilibrium concentration (mg/L) , q is the amount adsorbed (mg/g) and Kf and n are constants incorporating all parameters affecting the adsorption process, such as adsorption capacity and intensity, respectively. The linearised form of Freundlich adsorption isotherm was used to evaluate the sorption data and is represented as:
ln q = ln Kf + 1/n ln Ceq
Fig. I-Langmuir adsorption isotherm for Fe(III) biosorption by bengal gram husk at optimum conditions
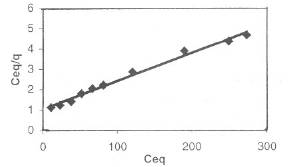
Table I-Relationship between RL and the type of isotherm
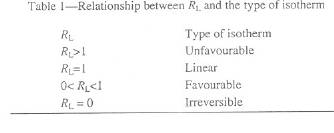
Fig. 2-Freundlich _dsorption isotherm for Fe (III) biosorption by bengal gram husk at optimum conditions
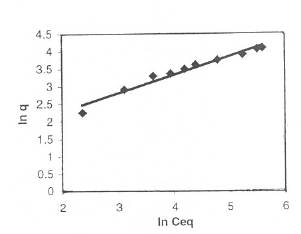
Table 2-Sorption isotherm constants and coefficients of determination for bgh
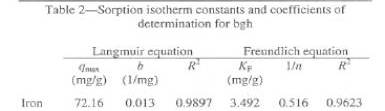
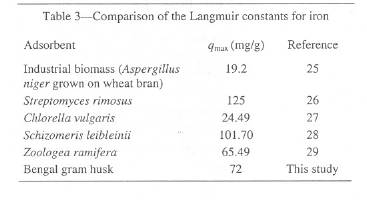
Table 3: Comparison of the Langmuir constants for iron
The coefficients of determination (R2) and the isotherm constants of Langmuir and Freundlich are given in Table 2. .
The Langmuir capacity or qmax is used to compare the efficiency of Bengal gram husk with other materials, which have been tested as biosorbents for iron. Table 3 makes such a comparison and, shows that, for iron, the Bengal gram husk has a greater capacity than some of materials tested previously.
| Back |
3.2 Effect of pH
The optimum pH for biosorption of ferric iron on to bgh (husk of Cicer arientinum) was observed at pH 2.5. The effect of pH at different concentrations of ferric ions is shown in Fig. 3. To avoid precipitation of ferric ions as their hydroxides, all the experiments
Fig. 3-Effect of pH on the biosorption of Fe(III) at different metal concentrations
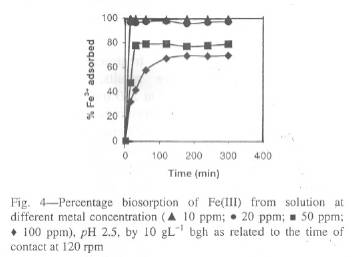
Fig. 4-Percentage biosorption of Fe(III) from solution at different metal concentration
were carried out below pH 3. The pH of solution influences both the metal binding sites as well as metal chemistry in solution. The initial adsorption rates increased with increasing initial pH up to optimum pH values. At higher pH values, Fe(III) precipitated because of the high concentration of OH ions in the adsorption medium28,30 and so adsorption experiments at pH>3 could not be performed. The percentage of iron adsorbed at pH 2.5 decreased with increasing metal concentration.
Effect of time and biomass concentration on the adsorption of bghThe sorption of iron by bgh biomass was very rapid for 10 mgL-1 solutions and the equilibrium was achieved within 15 min. For 25 and 50 mgL-1 solutions, the equilibrium was achieved within 60 min and the percentage of Fe(III) adsorbed was 97 and 78% respectively. In 100 mgL-1, the sorption equilibrium was achieved in 180 min and the percentage adsorbed is 70% (Fig. 4). It is clear from the results that the time required for maximum uptake of Fe(III) ions by bgh was dependent on the initial Fe (III) concentrations. This result is interesting, as the equilibrium time is an important parameter for
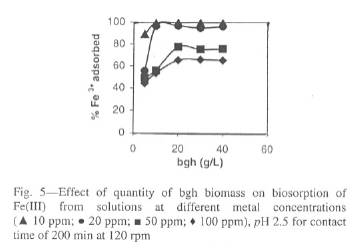
Fig. 5-Effect of quantity of bgh biomass on biosorption of Fe (III) from solutions at different metal concentrations
economical wastewater treatment operations. According to the above results, the agitation/ equilibrium time was fixed at 200 min for the rest of the experiments so that equilibrium is reached.
The bgh biomass was varied between 5 to 40 g L-1 with the variation in metal concentration to understand, whether the decline in metal adsorption with the increase in initial metal ion concentrations is due to the saturation of bgh sites by iron. This is illustrated in Fig. 5, which indicates that for 10 and 25 ppm metal solutions, the amount of biomass required to remove 99 and 96% of Fe(III) was 10 g L-1 and the amount of biomass required to attain the maximum sorption capacity for 50 and 100 ppm Fe(III) solutions was 20 g L-1. Earlier studies have indicated that at a given equilibrium concentration, biomass adsorbs more metal ions than at higher loading25,31-34.
| Back |
The desorption studies were carried out by filtering the Fe(III) loaded adsorbent from solution, washing gently with distilled water to remove unadsorbed Fe(III) and agitating the metal loaded adsorbent with varying concentrations of HCl. The results are shown in Fig. 6. It is evident that with increase in the HCI concentration, the desorption of Fe(III) ions increased. Above 1 M HCI, the structure of the biomass disintegrated, hence the experiments were terminated.
3.4 Infra-red spectral analysis
In order to determine the functional groups responsible for metal uptake, infra-red spectroscopy was used. An un-reacted bgh sample and bgh pretreated with 100 mg/L Fe(III) solution were analysed. The frequencies of vibrations and their corresponding groups are shown in Table 4.
Fig. 6-Effect of HCI concentration on % desorption of Fe(III)
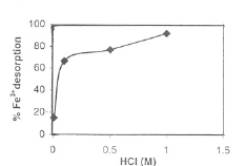
Table 4: IR absorption bands and the corresponding functional groups
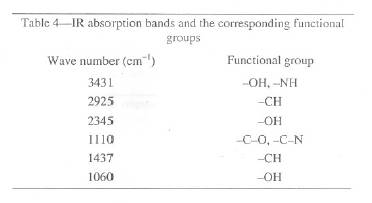
The results indicate that there are several functional groups that are available on the surface of bengal gram husk for binding the Fe3+ ions. The strong absorption peak at frequency level of 3400-3200 cm-1 represents -OH stretching of carboxylic groups and also representing stretching of -NH groups. The peak at 2925 cm-1 can be assigned to -CH stretching. The trough at 2345 and 1060 cm-1 can be attributed to the -OH group. The absorption peak at 1110 cm-1 is due to CO or CN groups.