|
Result
Land use dynamics and sacred grove distribution:
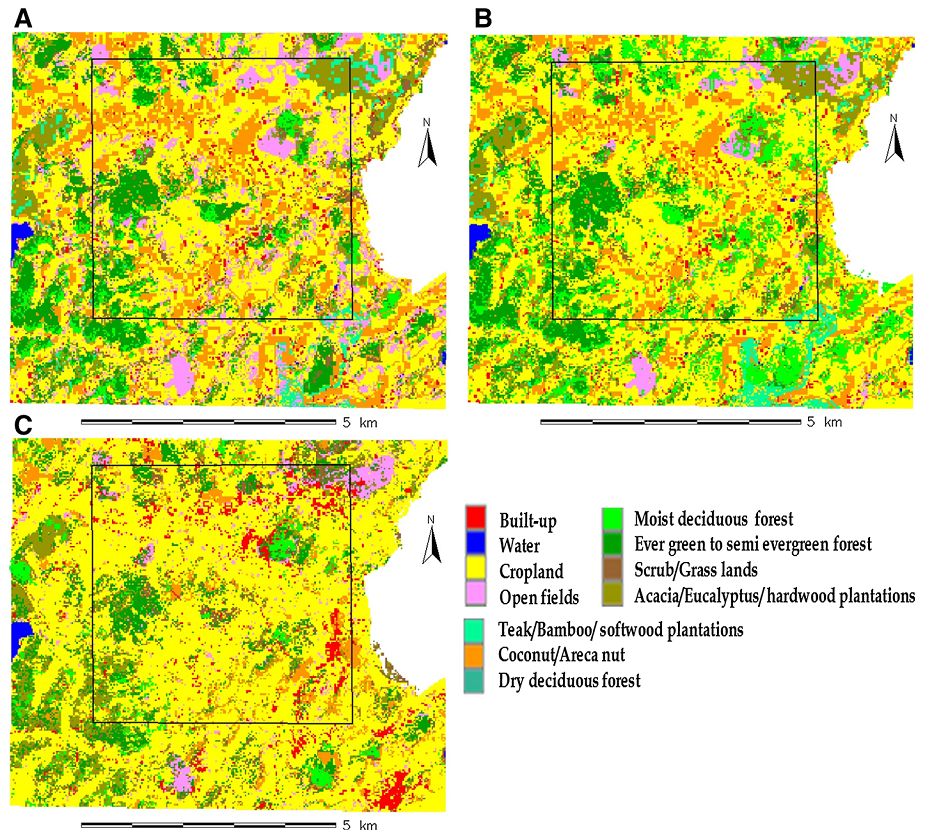
Temporal land use analysis depicts the landscape status and its transition during 1989 to 2010. The results show the primeval evergreen forest cover is reduced from 10.22% (1989) to 7.26% (2010) due to anthropogenic activities. The region is reflecting intensified agricultural activities and land conversions. The crop land has increased from 45.47% (1989) to 63.25 (2010). The built-up area has also increased from 2.22% to 4.40% by 2010. A total of 14.38% of area are covered with plantations (exotic plantations 9.38% and agriculture 5.0%). Overall accuracy of the classification ranges from 87.38% (1989), 91.25% (1999) to 92.47% (2010). Results of land use analysis are given in Table 1 and depicted in Figure 2.
Table 1. Temporal changes in the land use pattern in the study area
| Category |
1989 |
1999 |
2010 |
| Ha |
% |
Ha |
% |
Ha |
% |
Built-up
Water
Crop land
Open fields
Moist deciduous forest
Evergreen to semi evergreen forest
Scrub/grass
Acacia/ Eucalyptus/ hardwood plantations
Teak/ Bamboo/ softwood plantations
Coconut/ Areca nut / Cashew nut plantations
Dry deciduous forest |
122.87
19.45
2518.50
544.54
258.79
566.19
207.70
437.92
119.45
729.38
14.04 |
2.22
0.35
45.47
9.83
4.67
10.22
3.75
7.91
2.16
13.17
0.25 |
159.17
21.15
2811.96
348.79
309.07
474.71
179.00
453.04
102.78
676.73
2.43 |
2.87
0.38
50.77
6.30
5.58
8.57
3.23
8.18
1.86
12.22
0.04 |
243.73
17.55
3503.14
181.29
207.41
402.26
185.67
468.52
51.01
277.06
1.20 |
4.40
0.32
63.25
3.27
3.74
7.26
3.35
8.46
0.92
5.00
0.02 |
| Overall Accuracy |
87.38 |
91.25 |
92.47 |
| Kappa |
0.81 |
0.86 |
0.88 |
Figure 2. Land use dynamics in study area.(A) 1989 (B) 1999 and (C) 2010
Analysis of size class distribution of 53 groves shows that ~60 percent of them are <1000 m2 (Table 2) and are scattered throughout the study area (avg. distance 2.61 km ± 0.57 S.D). Groves constitute about 0.36% and the degraded natural forest about 10.6% of the study area. The average distance of the groves from the forest patch within the study area is 2.83 km (± 1.17) and area-perimeter ratio of the groves is 0.232 (avg.).
Table 2. Details of the studied sacred groves
| Village Name (code used) |
No. of grove covered |
Total Area
(m2) |
Area range (m2) |
Akunji (Aku)
Aralihonda (Ara)
Arendur (Are)
Dugimane (Dug)
Golgudu (Gol)
Harlikoppa (Har)
Hittalkoppa (Hit)
Kalyanpur (Kal)
Kavachur (Kav)
Mattigar (Mat) |
3
6
11
3
7
3
2
6
6
6 |
1315
17957
4559
796
10296
1900
8095
12409
8920
24341 |
137 - 857
205 – 10730
36 – 1026
46.5 – 419
372 – 2230
250.3 –1381
3517, 4578
330.1 –9264
841.5 – 2274
17.98 - 18220 |
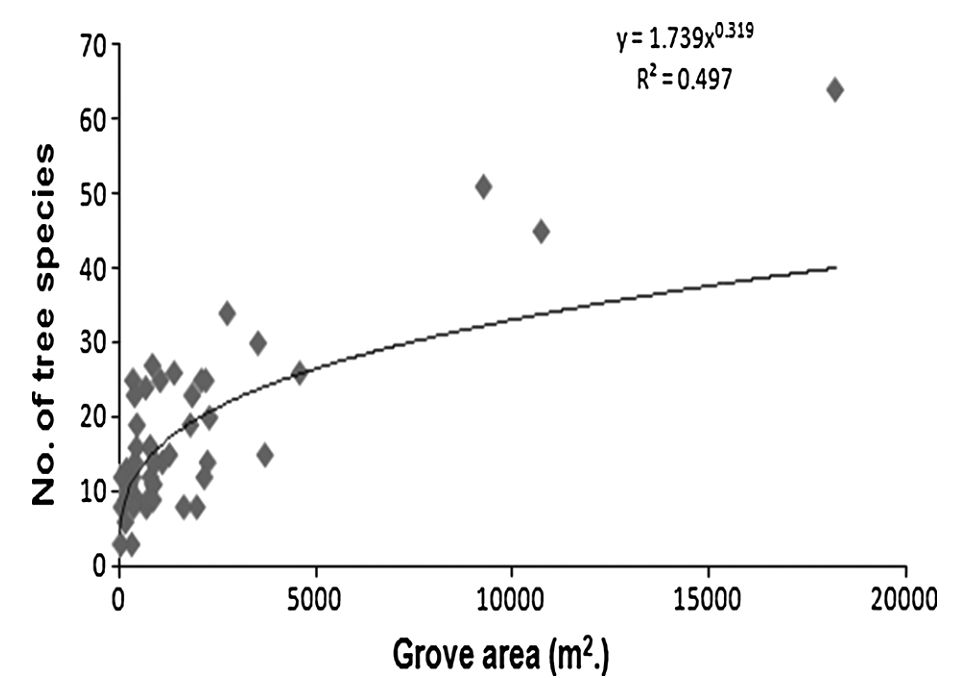
Figure 3: Species-area curve for studied sacred groves.
Distribution of woody endemics over the landscape –
Sacred groves harbour 138 woody species of which 19 (13.7%) are Western Ghats endemics. Grove area and total species richness show typical species-area relationship in power form (Fig. 3). 14 out of 19 endemics are exclusively confined to the sacred groves, the other five (Beilschmiedia bourdillonii, Holigarna arnottiana, Hydnocarpus pentandra, Terminalia paniculata and, Vateria indica)occur in forest patch as well as in some other landscape elements (Table 3). All the reported endemics are evergreen trees except Terminalia paniculata a deciduous and ubiquitous species present all over south-west India.
Table 3. Distribution of endemic tree species in studied landscape
| Endemic Tree Species (Family) |
Species code |
Sacred grove |
Forest area |
Farm/ roadside |
Actinodaphnae malabarica (Lauraceae)
Artocarpus hirsutus (Moraceae)
Beilschmiedia bourdillonii (Lauraceae)
Calophyllum apetalum (Clusiaceae)
Cinnamomum malabatrum (Lauraceae)
Diospyros assimilis (Ebenaceae)
Diospyros candolleana (Ebenaceae)
Drypetes confertiflora (Euphorbiaceae)
Flacourtia Montana (Flacourtiaceae)
Garcinia indica (Clusiaceae)
Holigarna arnottiana (Anacardiaceae)
Holigarna grahammi (Anacardiaceae)
Hydnocarpus pentandra (Lauraceae)
Ixora brachiata (Rubiaceae)
Knema attenuata (Myristicaceae)
Pittosporum dasycaulon (Pittosporaceae)
Syzygium travancoricum (Myrtaceae)
Terminalia paniculata (Combretaceae)
Vateria indica (Dipterocarpaceae) |
Act.mal
Art.hir
Bei.bou
Cal.ape
Cin.mal
Dio.ass
Dio.can
Dry.con
Fla.mon
Gar.ind
Hol.arn
Hol.gra
Hyd.pen
Ixo.bra
Kne.att
Pit.das Syz.tra
Ter.pan
Vat.ind |
√
√
√
√
√
√
√
√
√
√
√
√
√
√
√
√ √
√
√ |
-
-
√
-
-
-
-
-
-
-
√
-
-
-
-
- -
√
- |
-
-
√
-
-
-
-
-
-
-
√
-
√
-
-
- -
√
√ |
The non-grove forest patch in the study area shows moderate species diversity and richness (Table 4). We have captured 55-70 percent of species diversity from the forest area as estimated by non-parametric richness estimators.
Table 4. Diversity study result for forest area
| Details of diversity study in forest area |
| Observed Species Richness (within 2000 m2 sampling area) |
34 |
Estimated Species Richness , % of captured species (Chao2)
(ICE)
(ACE)
(Jack1) |
61, 55.7
53, 64.1
51, 66.6
48, 70.8 |
| Shannon diversity |
3.04 |
| No. of Western Ghats Endemics (tree) |
3 |
Five most dominant species (IVI value)
Aporusa lindlyana (Euphorbiaceae)
Terminalia tomentosa (Combretaceae)
Terminalia paniculata (Combretaceae)
Terminalia bellerica (Combretaceae)
Vitex altissima (Verbenaceae) |
60.51
49.75
32.83
24.84
14.08 |
Population status and regeneration of the endemics in study area –
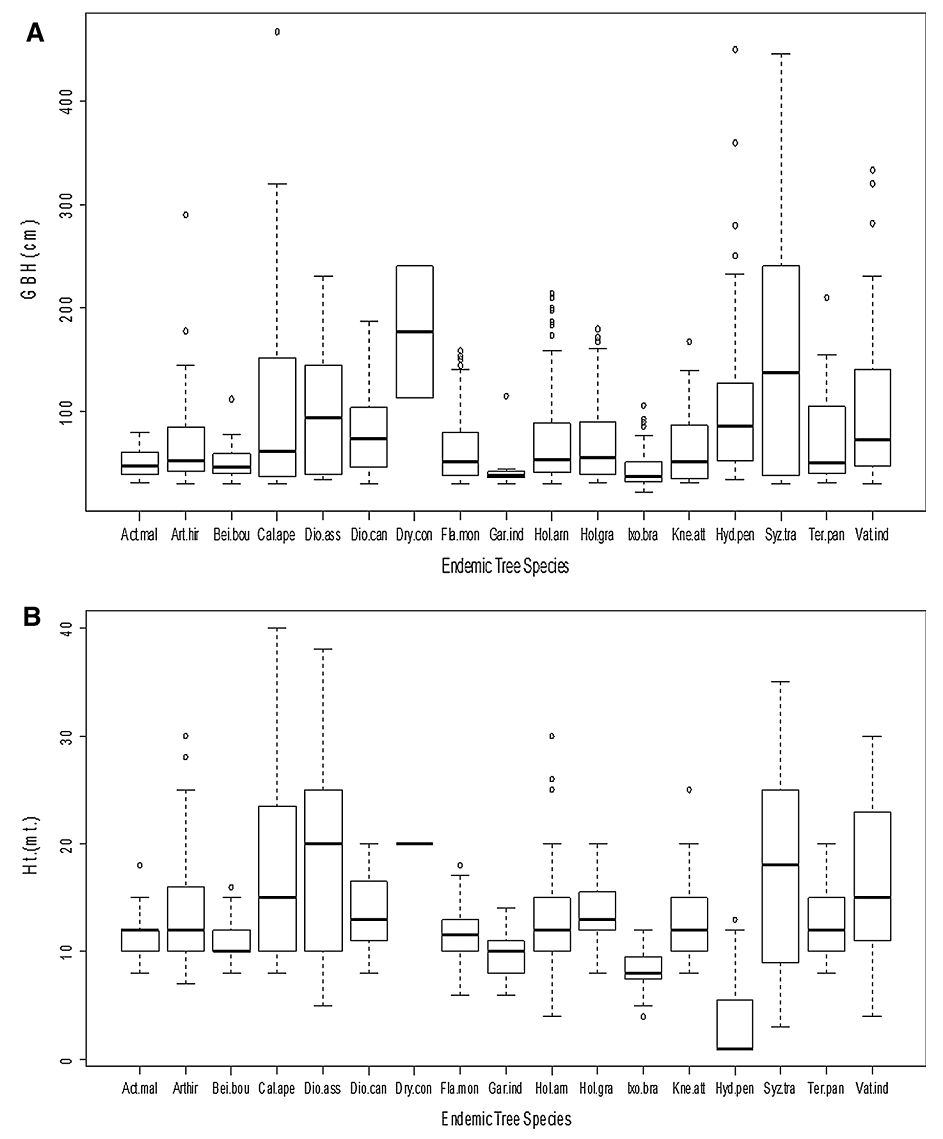
A total of 19 endemic tree species with 735 individuals have been recorded from the study area of which 14 endemics are exclusive to 39 of the 53 sacred groves. Among these sacred groves three (3) biggest groves harbour 80.53% of endemic individuals in the entire landscape of 25 km2. Ixora brachiata, a wide spread endemic species along the Western Ghats has highest occurrence (29 out of 39 sacred groves) followed by other stress adapted endemics Holigarna arnottiana, Flacourtia montana and Hydnocarpus pentandra in 12, 12 and 10 out of 39 respectively (Fig. 4). Most of the grove and non-grove areas have lower to middle girth class members (distribution follows inverse “J”) except for few high girth individuals mainly from sacred groves; the height of trees do not exceed 20m with few exceptions. (Fig. 5 A, B). Regeneration profile analysis shows skewed distribution in the studied landscape. A total of 15 endemic species are present in seedling and sapling stages. Devarabatti grove of Mattigar village (Mat25) had highest number of endemic tree species in regeneration stage (13), followed by 11 from Kereamma grove of Kalyanpur (Kal49) and 7 from Kadkod Choudamma grove of Aralihonda (Ara39). Ixora brachiata like its adult members have widespread distribution (15 groves with seedlings and 22 groves with saplings) in comparison to other members (Fig. 4). Apart from sacred grove, endemics from forest area, roads and farms are devoid of juvenile members.
Figure 4: Distribution of endemic tree population in sacred groves of the studied landscape.
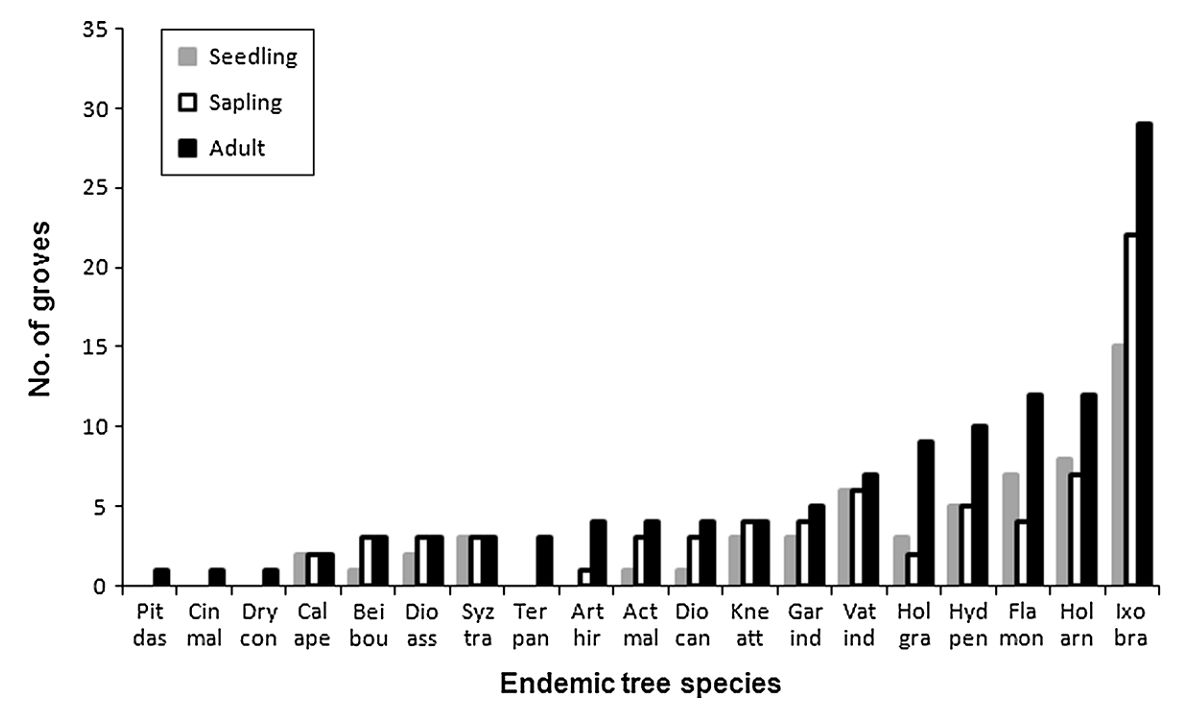
Figure 5: Girth and Height distribution of the woody endemics in study area. (A) GBH class distribution (B) Height class distribution
Devarabatti grove at Mattigar village, Kadkod Choudamma grove at Aralihonda and Kereamma grove at Kalyanpur are three largest groves in the studied landscape (~1.8, 1 and 0.9 ha respectively). Western Ghats tree endemism in these groves ranges from 24.4 percent (Kadkod Choudamma grove), 25.3 percent (Devarabatti grove), to 25.4 percent (Kereamma grove). Endemic population contributes visibly in high girth class members (24.1% - 37.1%) and basal area (22.7% – 45.5%).
Disturbances over the grove system –
We assessed the impact of seven (7) disturbance factors on the groves. Based on the relative disturbance scores groves have been categorised into highly disturbed (76-100%), moderately disturbed (51-75%), less disturbed (26-50%) and least disturbed (0-25%). Disturbance assessment categorised majority of the groves under moderately disturbed category (34) followed by highly disturbed (16) and less disturbed ones (3).
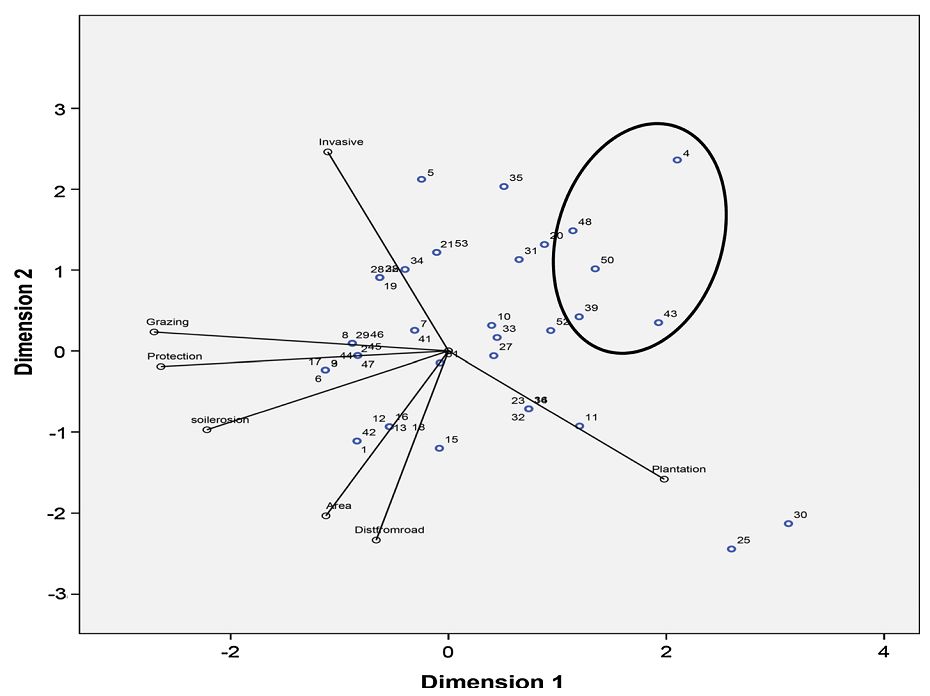
Categorical Principal component analysis (CATPCA) explains 67.76 percent of variance through its first three dimensions (Fig. 6). Protection, soil erosion and grazing are found to be major factors for dimension 1 whereas; invasive species and proximity to road dominate dimension 2 and area for dimension 3 respectively. The three largest groves in Mattigar (Mat25), Aralihonda (Ara39) and Kalyanpur (Kal49) are present at the opposite of the axis expressing their better protection status against disturbance factors.
Figure 6: CATPCA result showing effect of disturbance factors over the sacred groves.
Dimension 1 and 2 explains 30.4%, 22.3% variance respectively. Sacred groves 4, 39 and 48 (three largest groves) are opposite to all factors indicate their better protection status in the area (See supplement 1 for grove details)
|
