Results and discussions
1. Physico-chemical analysis:
1.1 Dissolved oxygen
Dissolved oxygen (DO) in the present study of the lakes in Bangalore ranged from 0.81- 4.22 mg/l in Varthur lake, 0-1.62 mg/l in Bellandur lake and 8.13-10.97 mg/l in T.G.Halli (Table-01). The values indicates Varthur lake undergoing hypoxic conditions with very low DO concentrations at the inflow region however the outlets have comparably higher DO values (4.22 mg/l). In case of Bellandur anoxic conditions were found at the outlets due to the passage of water course underneath the floating bed of debris and macrophytes which had covered about 40 % of the surface of the lake towards the outlet areas. This anaerobic condition is due to deprivation of the air-water interface and also the decline of the algal growth under the plant cover. However in case of T.G.Halli D.O. at saturated levels were observed at both the sites indicative of a lower organic load and thence lower oxygen demand in the system.
Table 1: Characteristics of the Study area
| Lakes |
Varthur |
Bellandur |
T.G.Halli |
| Location |
SE of Bangalore |
SE of Bangalore |
35 km West of Bangalore |
| Coordinates |
12.956683° – 12.941499° N
77.745378° - 77.72805° E |
12.943917° - 12.927959° N
77.638344° - 77.680167° E |
12.995103° -12.963357° N
77.362962° -77.327291° E |
| Primary inflows |
Bellandur |
Sewage from Bangalore |
Arkavathy river |
| Primary outflows |
To river Pennar |
Varthur lake |
Dammed |
| Catchment area (sqkm) |
118 |
148 |
1453 |
| Max. length (km) |
2 |
3.6 |
3.3 |
| Max. width (km) |
1.1 |
1.4 |
2.8 |
| Surface area (sqkm) |
2.2 |
3.6 |
4.2 |
| Mean depth (m) |
1.1 |
2.1 |
7.5 |
| Surface elevation (m) |
919 |
921 |
914.4 |
| Water colour |
Greenish (intense) |
Greenish |
Transparent |
| Odur |
Yes |
Yes |
No |
| Macrophyte cover |
Eicchornia, Alternanathera
Typha, Lemna |
Eiccheornia,
Alternanthera, Cyperus |
Hydrilla |
In the present study, it has been found that there exists a positive relationship of dissolved oxygen with temperature. These results are in conformity with earlier studies (Srivastava et al., 2003; Masood and Krshnamurthy, 1990) which showed a positive relation between temperatures, duration of sunlight, and soluble gases like dissolved oxygen. The decrease in oxygen may be the result of the high load of organic substances in the inflow from the storm water drains. The deprivation of oxygen is an indicator of the present trophic status of the lakes, which is congested with inorganic and organic matter making the conditions incearsingly eutrophied. The primary production and input of degradable organic substances create’s a tremendous demand for oxygen in case of Varthur and Bellandur lakes.
1.2 Biochemical oxygen demand
In the present investigation, the biological oxygen demand in Varthur lake Lake varied from 99.95 to 40.78 mg/l; Bellandur 35.85- 68.88 mg/l and T.G.Halli 12.69-15.02 mg/l. In Varthur higher BOD values were found near the inflow region, which substantially decreased towards the outlets, showing around 60 % of BOD removal. However in case of Bellandur BOD levels were still lower compard to Varthur and showing better treatability of wastewater. However in case of T.G.Halli the BOD values were very low compared to the urban lakes, which showed a lower organic load and therefore a lesser demand for oxygen. The higher levels of BOD in the urban lakes can be attributed to sewage influx through stormwater drains, reduced circulation in water bodies. The biochemical oxygen demand levels indicate higher levels of biodegradable organic matter, high oxygen consumption by heterotrophic organisms, and a high rate of organic matter remineralization. The studies wee similar to that of the shallow tropical water bodies in Mexico (North) (Zavala et al., 2000), the lakes in urban areas increasingly serve as sinks for domestic sewage and other municipal wastes.
1.3 Alkalinity
Total alkalinity values in the present study ranged from 300-520 mg/l in Varthur Lake; 260-1010 mg/l in Bellandur lake and from 340-360 mg/l in T.G.Halli. High alkalinity values are indicative of the eutrophic nature of the urban lakes like Varthur and Bellandur. High alkalinities in eutrophic waters were also recorded in earlier studies (Munawar, 1970; Singh, 2000). With an increase in dissolved oxygen there is an increase in the Alkalinity values. Only T.G.Halli showed carbonate’s (40 mg/l) compared to the urban lakes. Essentially the bicarbonates buffering was the prime source of alkalinity in surface waters of Bangalore. Higher values of total alkalinity is due to the presence of excess of CO2 produced as a result of decomposition processes coupled with mixing of sewage and other domestic effluents.
1.4 Phosphates (PO4)
In the present investigation the phosphate values ranged from 1.3-2.1 mg/l in Varthur Lake, 0.5-1.2 mg/l in Bellandur, and 0.08-0.4 mg/l in T.G.Halli. The urban lakes as Varthur and Bellandur have higher concentrations of phosphates primarily due inflow of sewage, sediment resuspension during high turbulence period and anaerobic conditions in the bottom of the lake and agricultural runoff from the immediate cultivated lands. These results are in conformity with earlier studies (Ravi Kumar et al., 2006). Phosphates are critical nutrients in the productivity of water in reservoir. However comparatively lower phosphate values were found in T.G.halli showing its healthy trophic status. The phosphate content in Varthur and Bellandur Lake’s are well beyond the eutrophic levels. Phosphate is considered to be the most significant among the nutrients responsible for eutrophication of lakes. Phosphates enter the lakes through domestic wastewater, accounting for the condition of eutrophication. Phosphorus concentrations were increased by sewage input. In the present investigation, phosphate concentration is more when oxygen content is less (Table 1).
1.5 Nitrates
The Nitrate concentration in Varthur lake ranged from 0.03 – 0.05 mg/l; 0.02-0.03 mg/l in Bellandur lake and 0.02 – 0.3 mg/l in T.G.Halli. Maximum values were recorded in T.G Halli due to more oxidizing condition and lower organic load. The main N sources in urban lakes are the domestic sewage, agricultural runoff and decomposition of autochthonous vegetative matter. Nitrogen entering aquatic systems arises from a variety of sources that include point and non-point source pollution, biological fixation of gaseous nitrogen, and the deposition of nitrogen oxides and ammonium (Stoddard, 1994). Nitrate nitrogen in water in Indian reservoirs is mostly in traces and seldom exceeds 0.5 mg/L and water with 0.2–0.5 mg/L of nitrates is of high productive reservoirs, up to 0.2 mg/L nitrates of medium productive reservoirs, and in low productive reservoirs, the nitrates are negligible (Jhingran and Sugunan 1990). However reactive N forms were mostly found in the form of ammonia in the lakes pertaining to anaerobic conditions and scant oxidation. The lakes covered by the aquatic weeds are deficient of nitrates, due to persistence of anaerobic conditions (Durga Madhab et al, 2010). Moderately low nitrate values were reported in earlier studies (Chanakya et al, 2006). A positive relation was found between Nitrates and phosphates indicative of trophic status.
1.6 Chlorophyll a:
From the results obtained for Chlorophyll a contents of the benthic phytoplankton at the different surveyed sites of the three lakes. He chlorophyll content was more or less similar to the pattern of phytoplankton distribution and abundance. (Table 1). The maximum values of Chlorophyll a was found in T.G.Halli (18.35 μg/l) owing to greater light penetration and higher growth of benthic microalgae and the lowest were found near the inflow region of Varthur lake (which in connected to the storm water drains that brings in 595 MLD of wastewater. However the surficial water samples had a very less micro-algal content.
2. Phytoplankton Standing Crop
2.1 Community composition:
The total number of identified and recorded benthic phytoplankton species at all the investigated sites in the lakes during the period of study were found to be 24 belonging 7 genera and 3 classes namely; Bacillariophyceae, Cyanophyceae and Chlorophyceae. In the Varthur lake the algal community was dominated by Chlorella sp. member of Chlorophyceae which comprised of C. vulgaris, C. pyrenoidosa and C. minutissima., followed by members of Bacillariophyceae (18%) as Nitszchia palea and Gomphonema parvulum. Microcystis auregonosa a member of Cyanophyceae were found in minor proportions (1%). Bellandur lake was dominated by the same Chlorella sp. populations (80%), filamentous algae (3%) comprising of Oscillatoria sp. and Lyngbya sp. were present at the outlet reaches showing N deprivation and rest comprised of the diatoms. However in T.G.halli the community composition was rather very contrasting comprising of dominant diatom species (80 %) as Gomphonema sp. > Nitszchia sp. > Navicula sp. > Acnanthes sp.> Cymbella sp. The chlorophycearn members comprised of Chlorella sp. (13%) followed by Scenedesmus sp. Member of Cyanophyceae (7%).
The dominance of diatom sp. In the T.G.Halli is indicative of a good water quality, under low stress conditions. However the spur of Chlorophyceae and Cyanophyceae members is an indicator of Organic pollution and nutrient accumulation in the urban lakes as in Varthur nad Bellandur. The productivity of the lakes are directly linked with the type and the abundance of the algal community. The turbidity values suggest very high algal abundance in Varthur and Bellandur lakes which is attributed to algal bloom which coincides with the high inorganic nutrient values and high BOD values in these lakes. The maximum concentration of micro-benthic algae was > 1.5 X 10⁴ cells/ml. The lowest being few hundred cells /ml in case of T.G.Halli. Table 2 illustrates the relative abundance of the microlagal population at the various sampling locations.
Table 2: Physico-chemical paramataers of the sampled locations of the Lake
| Parameters |
Varthur Lake |
Bellandur Lake |
T.G. Halli |
| Inflow |
South Outlet |
North Outlet |
South |
North
Outlet |
South
Outlet |
Middle |
Near
Outflow |
Near
Inflow |
| 1 |
2 |
3 |
4 |
5 |
6 |
7 |
8 |
9 |
| pH |
8.54 |
8.06 |
9.03 |
8.13 |
9.02 |
9.42 |
7.91 |
7.81 |
8.12 |
| Temperature (°C) |
24.40 |
26.30 |
25.60 |
282.00 |
25.40 |
23.00 |
24.80 |
23.70 |
24.00 |
| Electrical Conductivity (µScm-1) |
1098.00 |
1057.00 |
1068.00 |
1038.00 |
980.00 |
1009.00 |
981.00 |
309.00 |
255.00 |
| Total Dissolved Solids (mg/l) |
868.00 |
840.00 |
849.00 |
826.00 |
770.00 |
808.00 |
781.00 |
214.00 |
190.00 |
| Salinity (mg/L-1) |
538.00 |
522.00 |
527.00 |
514.00 |
483.00 |
507.00 |
487.00 |
215.00 |
152.00 |
| Turbidity (NTU) |
216.00 |
96.50 |
90.60 |
76.00 |
127.00 |
108.00 |
102.00 |
9.05 |
25.00 |
| Dissolved Oxygen (mg/l) |
0.81 |
0.81 |
4.22 |
4.06 |
0.00 |
0.00 |
1.62 |
8.13 |
10.97 |
| Free CO2 (mg/l) |
176.00 |
17.60 |
17.60 |
17.60 |
120.56 |
14.08 |
9.68 |
352.00 |
0.00 |
| Chemical Oxygen Demand (mg/l) |
293.33 |
229.33 |
325.33 |
282.66 |
192.00 |
224.00 |
282.66 |
48.00 |
44.00 |
| Biochemical Oxygen Demand (mg/l) |
49.95 |
40.78 |
41.68 |
57.72 |
46.28 |
35.85 |
68.88 |
15.02 |
12.69 |
| Nitrates (mg/l) |
0.05 |
0.04 |
0.04 |
0.03 |
0.03 |
0.02 |
0.03 |
0.02 |
0.03 |
| Phosphates (mg/l) |
2.10 |
1.80 |
1.70 |
1.30 |
0.50 |
0.90 |
1.20 |
0.80 |
0.40 |
| Carbonates (mg/l) |
0.00 |
0.00 |
0.00 |
0.00 |
0.00 |
0.00 |
0.00 |
40.00 |
40.00 |
| Bicarbonates (mg/l) |
520.00 |
300.00 |
420.00 |
360.00 |
260.00 |
300.00 |
1010.00 |
320.00 |
300.00 |
| Alaklinity (mg/l) |
520.00 |
300.00 |
420.00 |
360.00 |
260.00 |
300.00 |
1010.00 |
40.00 |
40.00 |
| Ca Hardness (mg/l) |
204.16 |
344.27 |
176.14 |
392.31 |
232.18 |
168.13 |
196.15 |
79.97 |
55.97 |
| Mg Hardness (mg/l) |
30.25 |
102.40 |
106.38 |
61.48 |
71.24 |
67.34 |
68.32 |
19.51 |
13.66 |
| Total Hardness (mg/l) |
124.00 |
420.00 |
436.00 |
252.00 |
292.00 |
276.00 |
280.00 |
116.00 |
96.00 |
| Chlorides (mg/l) |
136.32 |
88.04 |
144.84 |
130.64 |
119.28 |
127.80 |
150.52 |
42.60 |
45.44 |
| Sodium (mg/l) |
19 |
23.2 |
19.4 |
18.3 |
20.9 |
13.9 |
16.5 |
64.8 |
53.4 |
| Potassium (mg/l) |
3.6 |
4.3 |
3.5 |
3.2 |
4.1 |
2.8 |
3.5 |
5.9 |
5.7 |
| Chlorophyll a (µg/l) |
3.73 |
8.32 |
6.25 |
13.55 |
10.29 |
16.03 |
15.70 |
18.35 |
16.20 |
It was generally observed that the maximum number of counted species was belonging to class Chlorophyceae in case of the urban lakes and specially Chlorella, which indicates its ability to persist in nutrient reach eutrophic waters and shows its ability to curb nutrients in water and can act potential organism for nutrient bioremediation. Bacillariophyceae in case of T.G.Halli represent the most productive group at all sites during the period of study. In addition, the distribution and frequency of algal species along all sites showed that Bacillariophyceae together with some species of Chlorophyceae were always dominant especially at depending upon the nutrient load and trophic status of the lake.
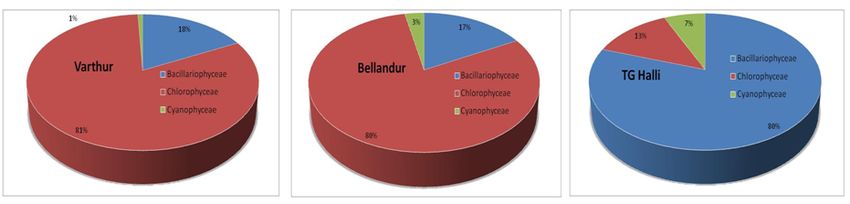
Figure 3: Algal composition in sampled lakes.
2.2 Distribution and relation with water quality
Study of phytoplankton population at the different selected sites in all the three lakes revealed that, the community was affected by the physico-chemical conditions of water, seasonal fluctuations, in addition to the different sources of pollution In case of Varthur inflow a station 6 (infront of drain 7) in the eastern sector. The total phytoplanktons was dominated by bacillariophyceae and were recorded in high counts due to the flourish of pollution tolerant diatom taxa namely Nitszchia palea and Gomphonema parvulum diatoms which represent the most dominant among diatoms population at this site due to the heavy load of organic pollution and nutrient salts discharged from drain the strom water drains. This observation was coincided with Abdalla et al.(1991) who reported that this species developed in Lake Mariut with the increase of the organic load. The dominance of diatoms in T.G. Halli especially indicates proper silica mineralization and pollution free conditions which is evident from the water quality paramates. Hence the presence of a high percentage and number of Bacillariophyceae which represented the first productive group as mentioned before. Furthermore, the shallow lake water leads to a rapid change in the productivity with the change in physico-chemical conditions of water. . These effluents enhance the biological activities of bacteria, especially in summer months due to the decomposition of organic matter. This observation are in agreement with earlier studies (El-Sherif and Aboul Ezz 1988) who reported that the lowest standing crop area due to the high density of zooplankton in addition to the low counts of phytoplankton in some sites resulting from the grazing effect of zooplankton on phytoplankton. The relative
abundance of the studied algae is as listed in Table 3.
Table 3: % Relative abundance of microalgae present in all sampling sites.
| Algal genera |
Varthur Inflow |
Varthur South Outlet |
Varthur North Outlet |
Varthur South |
Bellandur
North
Outlet |
Bellandur South
Outlet |
Belandur Middle |
T.G. Halli Outflow |
T.G. Halli Inflow |
| Chlorella sp. |
90.55 |
68.81 |
94.83 |
72.12 |
82.57 |
71.43 |
88.98 |
9.02 |
19.74 |
| Nitzschia sp. |
4.72 |
3.67 |
5.17 |
8.65 |
0.92 |
0.00 |
3.39 |
31.58 |
38.16 |
| Microcystis sp. |
3.15 |
0.00 |
0.00 |
0.00 |
0.00 |
0.00 |
0.00 |
0.00 |
0.00 |
| Gomphonema sp. |
1.57 |
27.52 |
0.00 |
19.23 |
3.67 |
14.29 |
7.63 |
32.33 |
39.47 |
| Filamentous algae |
0.00 |
0.00 |
0.00 |
0.00 |
12.84 |
14.29 |
0.00 |
0.00 |
0.00 |
| Navicula sp. |
0.00 |
0.00 |
0.00 |
0.00 |
0.00 |
0.00 |
0.00 |
18.80 |
0.00 |
| Achnanthes sp. |
0.00 |
0.00 |
0.00 |
0.00 |
0.00 |
0.00 |
0.00 |
4.51 |
0.00 |
| Cymbella sp. |
0.00 |
0.00 |
0.00 |
0.00 |
0.00 |
0.00 |
0.00 |
2.26 |
2.63 |
| Scenedesmus sp. |
0.00 |
0.00 |
0.00 |
0.00 |
0.00 |
0.00 |
0.00 |
1.50 |
0.00 |
3. Measurement of Day-Net Photosynthetic Productivity:
The amount of oxygen released during the daylight hours minus simultaneous community respiration may be called day-net photosynthesis (Os wald et al., 1957) used the day-net photo synthesis to estimate the photosynthetic production of sewage oxidation ponds. To determine day-net photo synthesis in g-O2/day/cu.m the minimum dissolved oxygen concentration was subtracted from the maximum dissolved oxygen concentration. The day net photosynthesis was multiplied by the depth of the euphotic zone in. meters to obtain day-net productivity in g O2/day/sq.m (Table 4).
Table 4: Day Net Photosynthetic Productivity in the studied lakes.
Sampling
sites |
Turbidity
(NTU) |
Transparency
(Euphotic Zone) |
O2 Conc. mg/l |
Day Net Photosynthesis
O2/d m3 |
Day Net Productivity
O2/d m2 |
| Max |
Min |
| Varthur |
|
|
|
|
|
|
| Inflow |
216 |
0.12 |
0.81 |
0 |
0.81 |
0.09 |
| N Oulet |
96.5 |
0.25 |
0.81 |
0 |
0.81 |
0.20 |
| S Outlet |
90.6 |
0.28 |
4.22 |
0 |
4.22 |
1.18 |
| South |
76 |
0.18 |
4.06 |
0 |
4.06 |
0.73 |
| Bellandur |
|
|
|
|
|
|
| N Outlet |
127 |
0.23 |
0 |
0 |
0 |
0 |
| S Outlet |
108 |
0.28 |
0 |
0 |
0 |
0 |
| Middle |
102 |
0.22 |
1.62 |
0 |
1.62 |
0.36 |
| T.G.Halli |
|
|
|
|
|
|
| Inflow |
9.05 |
5 |
8.13 |
5 |
3.13 |
15.65 |
| Outflow |
25 |
3.4 |
10.97 |
5 |
5.97 |
20.29 |