Abstract
Fragmented habitats exhibit distinctive patterns of species richness and species composition. They often exhibit patterns of pronounced nestedness wherein the species present in comparatively depauperate locations represent statistically proper subsets of the species present in locations that are richer in species. The current study has been conducted on the freshwater fishes of Sharavathi River, considering 41 stream and reservoir sites with 261 sampling events to understand the nestedness pattern in fish communities. Of the 64 fish species collected, 39 are from the reservoir and 33 from the stream islands. For the species of the stream islands including the reservoir fishes in the stream, the nestedness index, T was 8.27°, while species exclusive to stream islands had T=10.5°. In contrast, species that are common to both stream islands and the reservoir, T was 0.37°C. Relatively higher T in the exclusive stream species composition implies that they are highly depauperated due to fragmentation in streams and its negative influence on the stream fish communities.
Keywords
Western Ghats, nestedness, freshwater fish, habitat fragmentation, riverscape, stream island, island biogeography, community structure.
INTRODUCTION
Human activities have changed about one-third to one-half of the earth’s land surface and are leading to substantial and growing modification of the earth’s biological resources1. Worldwide, 34 areas2 have been identified as biodiversity hotspots that have exceptional concentrations of endemic species and experiencing exceptional loss of habitat3. It is estimated that in 1995 more than 1.1 billion people, nearly 20% of world population, were living within these hotspots that covers about 12% of Earth's terrestrial surface with a population growth rate of 1.8% yr-1, which is substantially higher than the population growth rate of the world as a whole (1.3% yr-1) as well as above that of the developing countries (1.6% yr-1)4. Humans derive many utilitarian benefits from ecosystem services and goods5 and the resulting impact on the global biosphere now control many major facets of ecosystem function6, especially in tropical regions. The most concerning impact is the massive degradation of habitat and extinction of species, taking place on a catastrophically short timescale7 resulting in modification of both the identities and numbers of species in ecosystems8. The decline of many biological populations worldwide is attributed to habitat fragmentation of the terrestrial and aquatic ecosystems9,10.
In aquatic systems, fragmentation can have deleterious effects on ecosystem integrity11. A continuous (non-fragmented) riverine ecosystem is dominated by flow seasonality imposed by monsoonal rains12 with, floods and droughts as important features of these rivers. The aquatic environments are known for their dynamic nature, especially the stream landscapes, which are highly variable in space and time. Dynesius and Nilsson (1994)13 determined that 77% of the total discharge of the 139 largest river systems in the northern third of the world is affected by river fragmentation caused by dams, reservoirs, inter-catchment diversions, and irrigation. Thus construction of dams has resulted in disruption of natural dispersal pathways14 and subsequent changes in the structure and function of aquatic and wetland communities115, and regarded as the biggest conservation threat to aquatic communities in many river basins throughout the world16 due to the biased extinctions of rare species8. Thus understanding how populations persist in fragmented environments is a central problem in basic and applied ecology17.
Among fishes inhabiting running waters, three modes of adaptations (life history, behavioral and morphological) exist for surviving floods and droughts18. Many species have clear adaptation to life in rapidly flowing streams, few other typical of upstream regions, large and predators are exclusive to the deep pools19. Overall life-history stages of the stream fishes must be adapted to changes that occur at different spatial and temporal scales20. Morphological, physiological and behavioural characteristics accompanied by climatic factors21 result in migration of fish species that is reflected by local extinction during unfavourable conditions and recolonization at the time of favourable conditions22.
Fragmented habitats, both terrestrial and aquatic tend to exhibit distinctive patterns of species richness and species composition. As fragmentation of natural continuous habitats continues, the areas of fragments become smaller, and distances between them increase. The taxa occurring in fragments become isolated, as the surrounding habitat is often unsuitable, hampering successful immigration23. In such conditions, species distribution patterns within these fragmented habitats have often exhibited patterns of pronounced nestedness24, which are common among many communities25.
A nested biota is one in which the species present in comparatively depauperate locations represent statistically proper subsets of the species present in locations that are richer in species. An area of suitable habitats, initially inhabited by a common ancestral biota, is fragmented into an archipelago of islands. On each island of an archipelago, there will be one species which is nearest its minimum sustainable population size, and thus at greatest risk of local extinction. As area continues to shrink, populations of the archipelago's constituent species will tend to go extinct in order of their specific extinction risks26. This orderly extinction pattern is the key factor in nestedness pattern. The nestedness phenomenon has been recognized for quite some time27 but only recently have statistical tests been developed for the analysis of orderliness in species assemblages28. Patterns of community structure in many naturally and anthropogenically fragmented environments can be analysed29. The best way to quantify nestedness is to use Atmar and Patterson’s method, which uses a combination of a thermodynamic measure of order and a Monte-Carlo simulation30. Nestedness pattern has been revealed for several archipelagos and communities associated with them, e.g. plants, mussels, butterflies, caddisflies, orthopterans, fish parasites, fish, amphibians, reptiles, birds and mammals31, 23, 25, 28-41.
Fish assemblages in tropical rivers are characterized by high taxonomic diversity42. Recent compilation of freshwater and secondary freshwater fishes of the Western Ghats shows that there are 318 species, of which 27 species are critically endangered and 55 endangered while 128 are data deficient species. Of the 27 critically endangered species 24 are endemic to the region. Similarly, of the 55 endangered species, 37 are endemic. Yet, 49 endemic species are data deficient43. Analysis of fish species composition, distribution and ecological status with reference to the terrestrial ecosystem in the catchment, revealed preference of the endemic fish fauna to perennial streams with their catchments having evergreen to semi-evergreen forests, which also have higher levels of plant endemism44. Many of the species in the Western Ghats are characterized by their localized distribution (to a river basin or part of a river basin) and specific adaptation to lotic environments. Although damming the rivers at small scales is practiced widely in the region for centuries, with the large-scale planning, massive projects have been initiated and implemented45 over the past century. The necessity to understand the implications of aquatic habitat fragmentation and its influence on the fish species composition and structure resulted due to such massive transformation has led the present study. This is the first attempt to provide the nestedness pattern in the fish community in the Western Ghats, something that is unique for the fish survey. As most of the rivers of the Western Ghats are now altered, understanding the implications is vital for the effective management and restoration of running water ecosystems of the region.
MATERIALS AND METHODS
Study area
Sharavathi River (catchment area of 2,784 km2) is one of the west-flowing rivers of Central Western Ghats traverses over a distance of 132 km before joining the Arabian Sea (Figure 1). The region spans between 74°50’54” to 75°30’63” E and 13°77’08” to 14°7’27” N. The region receives high annual rainfall (1715–5598 mm) that occurs mainly during June to October. The river has been exploited to generate hydroelectric power, which resulted in construction of two major dams across it. The Linganamakki dam (74°50’54” E, 14°14’24” N, 512 m above msl), constructed in the year 1964 has a water-spread area of 326.34 km2.
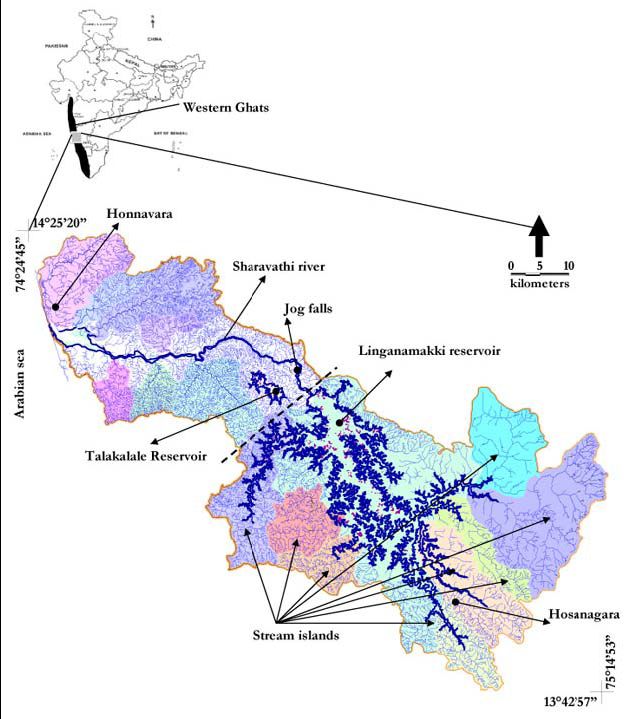
Figure 1: Sharavathi river basin drainage network. South of dashed line constitutes study area.
Eight major tributaries with numerous stream networks of this river are considered as sub-basins. These sub-basins with undulating terrains have tropical evergreen, semi-evergreen and moist deciduous forests in their catchments44. Formation of lacustrine ecosystem in the form of the Linganamakki reservoir has isolated these eight sub-basins into discrete flowing reaches, disrupted the flow connectivity, converted into stream islands. We used the terms stream island and sub-basin interchangeably according to the context.
Sampling
Fish sampling was carried out in 41 selected stream and reservoir sites with 261 samplings from January 2002 to August 2004. Collections were made using gill nets, cast nets, dragnets and hooks and lines of varying sizes44. Within each site, all microhabitats like riffle zone, pools, cascade, falls, embayment, run and plunge were considered for sampling. Based on the standard literatures available44 the collected specimen were identified. Species richness of a stream island is the sum total of the individual samplings species richness that falls within the catchment of a sub-basin. Similarly, species richness from the sampling sites of the reservoir was pooled and used as a reference list.
Data analysis
Presence-absence (1=present, 0=absent) matrices were assembled representing stream islands as rows in order of decreasing species richness and species as columns in order of decreasing ubiquity. Nestedness analyses for different groups of species were carried out in stream islands viz.,
i. all species from the stream-islands,
ii. species common to stream-islands and reservoirs (derived from reference list) and
iii. species that are exclusive to stream-islands.
The basis for this classification is purely on the species occurrence during sampling. Nestedness of species assemblages was determined using Nested Temperature Calculator46. Nested patterns can be related to thermodynamics47 with an index T on scale of 0°–100°C46. With 0° representing complete nestedness and 100°C representing complete randomness41. Indication of unmarked heterogeneity in the original data set is given by the mixed presences and absences of species or sites along the boundary line. The stability of individual populations is determined by calculating the state occupancy of the individual species26. Monte Carlo randomisations of data matrix (500 runs) were used to compare with observed matrix. If the obtained value was lower than that of the randomly generated assemblage, the assemblage can be declared as nested38.
RESULTS AND DISCUSSIONS
Present study reports 64 fish species from the study area. Of this, 39 species are found in reservoir sampling sites (lacustrine region) and 33 in the stream islands. Stream island wise data on species richness, endemism, IUCN (World Conservation Union) status, existing land-use pattern and the fragmentation details are given in Table 1. Species richness, endemism and extent of threatened species are relatively high in Western stream islands than southern and eastern stream islands. Similar pattern follows in case of forest cover, wherein extent of semi-evergreen to evergreen forests is relatively more in western stream islands than southern and eastern stream islands.
Table 1. Stream island wise data on fish attributes and corresponding land-use values
| Data type |
Parameters |
Eastern stream islands |
Southern stream islands |
Western stream islands |
| Nandiholé |
Haridravathi |
Mavinaholé |
Sharavathi |
Hilkunji |
Huruliholé |
Nagodi |
Yenneholé |
| Fish |
Sp. Richness |
22 |
25 |
22 |
28 |
25 |
32 |
41 |
49 |
| Western Ghats endemics (%) |
8.3 |
14.3 |
9.1 |
22.2 |
20.0 |
40 |
23.5 |
35.5 |
| Endangered (%) |
0.0 |
7.1 |
9.1 |
5.5 |
13.3 |
12.0 |
11.8 |
9.7 |
| Vulnerable (%) |
16.7 |
21.4 |
9.1 |
16.7 |
6.7 |
24.0 |
17.6 |
0.0 |
| Lower risk (%) |
58.3 |
57.1 |
63.6 |
61.1 |
66.7 |
44.0 |
52.9 |
38.7 |
| Data deficient (%) |
16.7 |
14.3 |
18.2 |
11.1 |
13.3 |
12.0 |
17.7 |
22.6 |
| Land-use |
Semi-evergreen (%) |
3.31 |
2.3 |
4.4 |
19.2 |
43.3 |
32.8 |
52.1 |
37.9 |
| Moist-deciduous (%) |
38.1 |
28.2 |
41.6 |
22.9 |
22.5 |
27.9 |
16.6 |
19.8 |
| Plantation (%) |
5.5 |
5.6 |
7.9 |
14.7 |
11.6 |
10.7 |
13.7 |
15.9 |
| Water (%) |
0.01 |
0.1 |
0.03 |
0.0 |
0.0 |
0.9 |
0.0 |
0.1 |
| Agricultural (%) |
11.3 |
18.2 |
9.8 |
10.3 |
4.2 |
1.9 |
1.1 |
1.4 |
| Non-vegetated (%) |
11.1 |
13.9 |
11.6 |
12.5 |
5.6 |
7.6 |
7.5 |
10.1 |
| Open field (%) |
30.6 |
31.9 |
24.7 |
20.4 |
12.9 |
18.2 |
9.1 |
14.9 |
Nestedness Pattern
The species assemblages in eight stream islands were nested significantly as indicated by T (Tables 2, 3, 4 and 5). Nestedness index (T) considering all the species from the stream islands was 8.27°C, probability of which is similar to a randomly generated nesting pattern is almost zero (P<6.15x10⁻¹⁰). The species such as Schistura denisonii denisonii, Oreichthys cosuatis and Schistura semiarmatus with both unexpected presences and unexpected absences along with stream island Nandi Holé are responsible for idiosyncrasy. Presence of Amblypharyngodon melettina in Hilkunji stream island and Barilius gatensis in Haridravathi stream island represent unexpected presences (Table 2). These are the species with high risks of local extinction from those stream islands. Similarly, the ideal candidates for reintroducing the species are Oreichthys cosuatis to Huruli, Sharavathi and Haridravathi stream islands, Schistura semiarmatus to Huruli stream island and Schistura sp to Yenne Holé stream island, where their probability of survival is very high.
Table 2. Nestedness pattern of all the species found in the stream islands
| Species name |
YNH |
NGH |
HRH |
SVH |
HDH |
HKH |
MVH |
NDH |
| Aplocheilus lineatus |
1 |
1 |
1 |
1 |
1 |
1 |
1 |
1 |
| Barilius bendelisis |
1 |
1 |
1 |
1 |
1 |
1 |
1 |
1 |
| Brachydanio rerio |
1 |
1 |
1 |
1 |
1 |
1 |
1 |
1 |
| Chanda nama |
1 |
1 |
1 |
1 |
1 |
1 |
1 |
1 |
| Cirhina fulungee |
1 |
1 |
1 |
1 |
1 |
1 |
1 |
1 |
| Danio aequipinnatus |
1 |
1 |
1 |
1 |
1 |
1 |
1 |
1 |
| Garra gotyla stenorhynchus |
1 |
1 |
1 |
1 |
1 |
1 |
1 |
1 |
| Lepidocephalus thermalis |
1 |
1 |
1 |
1 |
1 |
1 |
1 |
1 |
| Mystus cavacius |
1 |
1 |
1 |
1 |
1 |
1 |
1 |
1 |
| Mystus malabaricus |
1 |
1 |
1 |
1 |
1 |
1 |
1 |
1 |
| Parambassis ranga |
1 |
1 |
1 |
1 |
1 |
1 |
1 |
1 |
| Puntius sophore |
1 |
1 |
1 |
1 |
1 |
1 |
1 |
1 |
| Puntius ticto |
1 |
1 |
1 |
1 |
1 |
1 |
1 |
1 |
| Rasbora daniconius |
1 |
1 |
1 |
1 |
1 |
1 |
1 |
1 |
| Glossogobius giuris |
1 |
1 |
1 |
1 |
1 |
1 |
1 |
1 |
| Ompok bimaculatus |
1 |
1 |
1 |
1 |
1 |
1 |
1 |
1 |
| Puntius chola |
1 |
1 |
1 |
1 |
1 |
1 |
1 |
1 |
| Gonoproktopterus kolus |
1 |
1 |
1 |
1 |
1 |
1 |
1 |
1 |
| Acanthocobitis botia |
1 |
1 |
1 |
1 |
1 |
1 |
1 |
1 |
| Puntius filamentosus |
1 |
1 |
1 |
1 |
1 |
1 |
1 |
1 |
| Mastacembelus armatus |
1 |
1 |
1 |
1 |
1 |
1 |
1 |
0 |
| Puntius sahyadriensis |
1 |
1 |
1 |
1 |
1 |
1 |
1 |
0 |
| Salmostoma boopis |
1 |
1 |
1 |
1 |
1 |
1 |
0 |
0 |
| Schistura denisonii densisonii |
1 |
1 |
1 |
1 |
1 |
0 |
0 |
1 |
| Nemacheilus anguilla |
1 |
1 |
1 |
1 |
0 |
0 |
0 |
0 |
| Osteocheilichthys nashii |
1 |
1 |
1 |
1 |
0 |
0 |
0 |
0 |
| Oreichthys cosuatis |
1 |
0 |
0 |
0 |
1 |
1 |
0 |
1 |
| Barilius bakeri |
1 |
1 |
1 |
0 |
0 |
0 |
0 |
0 |
| Channa marulius |
1 |
1 |
1 |
0 |
0 |
0 |
0 |
0 |
| Ompok pabo |
1 |
1 |
1 |
0 |
0 |
0 |
0 |
0 |
| Schistura semiarmatus |
1 |
1 |
0 |
1 |
0 |
0 |
0 |
0 |
| Puntius fasciatus |
1 |
1 |
1 |
0 |
0 |
0 |
0 |
0 |
| Schistura nagodiensis |
1 |
1 |
1 |
0 |
0 |
0 |
0 |
0 |
| Tor khudree |
1 |
1 |
1 |
0 |
0 |
0 |
0 |
0 |
| Batasio sharavatiensis |
1 |
1 |
0 |
0 |
0 |
0 |
0 |
0 |
| Clarias batrachus |
1 |
1 |
0 |
0 |
0 |
0 |
0 |
0 |
| Labeo kontius |
1 |
1 |
0 |
0 |
0 |
0 |
0 |
0 |
| Pseudeutropius atherinoides |
1 |
1 |
0 |
0 |
0 |
0 |
0 |
0 |
| Tor mussullah |
1 |
1 |
0 |
0 |
0 |
0 |
0 |
0 |
| Channa orientalis |
1 |
1 |
0 |
0 |
0 |
0 |
0 |
0 |
| Wallago attu |
1 |
1 |
0 |
0 |
0 |
0 |
0 |
0 |
| Barilius gatensis |
1 |
0 |
0 |
1 |
0 |
0 |
0 |
0 |
| Amblypharyngodon mellettina |
1 |
0 |
0 |
0 |
0 |
1 |
0 |
0 |
| Barilius canarensis |
1 |
0 |
0 |
0 |
0 |
0 |
0 |
0 |
| Clarias dussumieri dussumieri |
1 |
0 |
0 |
0 |
0 |
0 |
0 |
0 |
| Glyptothorax lonah |
1 |
0 |
0 |
0 |
0 |
0 |
0 |
0 |
| Pseudophromenus cupanus |
1 |
0 |
0 |
0 |
0 |
0 |
0 |
0 |
| Puntius arulius |
1 |
0 |
0 |
0 |
0 |
0 |
0 |
0 |
| Schistura sharavathiensis |
1 |
0 |
0 |
0 |
0 |
0 |
0 |
0 |
| Schistura sp1 |
0 |
1 |
0 |
0 |
0 |
0 |
0 |
0 |
YNH–Yenne Holé, NGH–Nagodi Holé, HRH–Huruli Holé, SVH–Sharavathi Holé, HDH–Haridravathi Holé, HKH–Hilkunji Holé, MVH–Mavina Holé, NDH–Nandi Holé.
Aplocheilus lineatus, Barilius bendelisis, Brachydanio rerio, Chanda nama, Cirhina fulungee, Danio aequipinnatus, Garra gotyla stenorhynchus, Lepidocephalus thermalis, Mystus cavacius, M. malabaricus, Parambassis ranga, Puntius sophore, P. ticto, Rasbora daniconius, Glossogobius giuris, Ompok bimaculatus, P. chola, Gonoproktopterus kolus, Acanthocobitis botia, and P. filamentosus are the most ubiquitous species. Whereas, the species like; Amblypharyngodon mellettina, Barilius canarensis, Clarias dussumieri dussumieri, Glyptothorax lonah, Pseudophromenus cupanus, Puntius arulius, Schistura sharavathiensis,and S. sp1 are the most marginal species.
T for the species that are common to stream islands and reservoir was 0.37°C. This is almost completely nested without many idiosyncratic species (Table 3). Reservoir and streams provide hospitable habitats, resulting in structured immigration and emigration of these fish species.
Table 3. Nestedness pattern of the species common to both stream islands and reservoir
| Species name |
YNH |
NGH |
HRH |
SVH |
HKH |
HDH |
MVH |
NDH |
| Barilius bendelisis |
1 |
1 |
1 |
1 |
1 |
1 |
1 |
1 |
| Brachydanio rerio |
1 |
1 |
1 |
1 |
1 |
1 |
1 |
1 |
| Chanda nama |
1 |
1 |
1 |
1 |
1 |
1 |
1 |
1 |
| Cirrhinus fulungee |
1 |
1 |
1 |
1 |
1 |
1 |
1 |
1 |
| Garra gotyla stenorhynchus |
1 |
1 |
1 |
1 |
1 |
1 |
1 |
1 |
| Mystus cavesius |
1 |
1 |
1 |
1 |
1 |
1 |
1 |
1 |
| Mystus malabaricus |
1 |
1 |
1 |
1 |
1 |
1 |
1 |
1 |
| Parambassis ranga |
1 |
1 |
1 |
1 |
1 |
1 |
1 |
1 |
| Glossogobius giuris |
1 |
1 |
1 |
1 |
1 |
1 |
1 |
1 |
| Ompok bimaculatus |
1 |
1 |
1 |
1 |
1 |
1 |
1 |
1 |
| Puntius chola |
1 |
1 |
1 |
1 |
1 |
1 |
1 |
1 |
| Gonoproktopterus kolus |
1 |
1 |
1 |
1 |
1 |
1 |
1 |
1 |
| Mastacembelus armatus |
1 |
1 |
1 |
1 |
1 |
1 |
1 |
0 |
| Puntius filamentosus |
1 |
1 |
1 |
1 |
1 |
1 |
1 |
0 |
| Salmostoma boopis |
1 |
1 |
1 |
1 |
1 |
1 |
0 |
0 |
| Osteocheilichthys nashii |
1 |
1 |
1 |
1 |
0 |
0 |
0 |
0 |
| Channa marulius |
1 |
1 |
1 |
0 |
0 |
0 |
0 |
0 |
| Ompok pabo? |
1 |
1 |
1 |
0 |
0 |
0 |
0 |
0 |
| Tor khudree |
1 |
1 |
1 |
0 |
0 |
0 |
0 |
0 |
| Batasio sharavatiensis |
1 |
1 |
0 |
0 |
0 |
0 |
0 |
0 |
| Clarias batrachus |
1 |
1 |
0 |
0 |
0 |
0 |
0 |
0 |
| Labeo kontius |
1 |
1 |
0 |
0 |
0 |
0 |
0 |
0 |
| Pseudeutropius atherinoides |
1 |
1 |
0 |
0 |
0 |
0 |
0 |
0 |
| Tor mussullah |
1 |
1 |
0 |
0 |
0 |
0 |
0 |
0 |
| Wallago attu |
1 |
1 |
0 |
0 |
0 |
0 |
0 |
0 |
| Clarias dussumieri dussumieri |
1 |
0 |
0 |
0 |
0 |
0 |
0 |
0 |
| Glyptothorax lonah |
1 |
0 |
0 |
0 |
0 |
0 |
0 |
0 |
| Puntius arulius |
1 |
0 |
0 |
0 |
0 |
0 |
0 |
0 |
For the species that are exclusive to stream islands, T was 10.5oC, with more number of idiosyncrasy in species as well as in stream islands (Table 4). Species such as Oreichthys cosuatis, Barilius gatensis, Amblypharyngodon melettina, Schistura denisoni denisoni, Nemacheilus anguilla, Salmostoma boopis, etc are responsible for idiosyncrasy in the system.
Table 4. Nestedness pattern of exclusively stream dwelling species in the stream islands.
| Species |
YNH |
NGH |
SVH |
HDH |
HRH |
HKH |
MVH |
NDH |
| Aplocheilus lineatus |
1 |
1 |
1 |
1 |
1 |
1 |
1 |
1 |
| Brachydanio rerio |
1 |
1 |
1 |
1 |
1 |
1 |
1 |
1 |
| Chanda nama |
1 |
1 |
1 |
1 |
1 |
1 |
1 |
1 |
| Danio aequipinnatus |
1 |
1 |
1 |
1 |
1 |
1 |
1 |
1 |
| Garra gotyla stenorhynchus |
1 |
1 |
1 |
1 |
1 |
1 |
1 |
1 |
| Lepidocephalus thermalis |
1 |
1 |
1 |
1 |
1 |
1 |
1 |
1 |
| Parambassis ranga |
1 |
1 |
1 |
1 |
1 |
1 |
1 |
1 |
| Puntius sophore |
1 |
1 |
1 |
1 |
1 |
1 |
1 |
1 |
| Puntius ticto |
1 |
1 |
1 |
1 |
1 |
1 |
1 |
1 |
| Rasbora daniconius |
1 |
1 |
1 |
1 |
1 |
1 |
1 |
1 |
| Glossogobius giuris |
1 |
1 |
1 |
1 |
1 |
1 |
1 |
1 |
| Acanthocobitis botia |
1 |
1 |
1 |
1 |
1 |
1 |
1 |
1 |
| Puntius chola |
1 |
1 |
1 |
1 |
1 |
1 |
1 |
0 |
| Puntius filamentosus |
1 |
1 |
1 |
1 |
1 |
1 |
1 |
0 |
| Salmostoma boopis |
1 |
1 |
1 |
1 |
1 |
1 |
0 |
0 |
| Puntius sahyadriensis |
1 |
1 |
1 |
1 |
1 |
0 |
1 |
0 |
| Schistura denisonii densisonii |
1 |
1 |
1 |
1 |
0 |
0 |
0 |
1 |
| Nemacheilus anguilla |
1 |
1 |
1 |
0 |
1 |
1 |
0 |
0 |
| Osteocheilichthys nashii |
1 |
1 |
1 |
0 |
1 |
0 |
0 |
0 |
| Barilius bakeri |
1 |
1 |
0 |
0 |
1 |
0 |
0 |
0 |
| Puntius fasciatus |
1 |
1 |
0 |
0 |
1 |
0 |
0 |
0 |
| Schistura nagodiensis |
1 |
1 |
0 |
0 |
1 |
0 |
0 |
0 |
| Schistura semiarmatus |
1 |
1 |
1 |
0 |
0 |
0 |
0 |
0 |
| Channa orientalis |
1 |
1 |
0 |
0 |
0 |
0 |
0 |
0 |
| Oreichthys cosuatis |
1 |
0 |
0 |
1 |
0 |
1 |
0 |
1 |
| Amblypharyngodon mellettina |
1 |
0 |
0 |
0 |
0 |
1 |
0 |
0 |
| Barilius canarensis |
1 |
0 |
0 |
0 |
0 |
0 |
0 |
0 |
| Pseudophromenus cupanus |
1 |
0 |
0 |
0 |
0 |
0 |
0 |
0 |
| Puntius arulius |
1 |
0 |
0 |
0 |
0 |
0 |
0 |
0 |
| Schistura sharavathiensis |
1 |
0 |
0 |
0 |
0 |
0 |
0 |
0 |
| Schistura sp1 |
0 |
1 |
0 |
0 |
0 |
0 |
0 |
0 |
| Barilius gatensis |
0 |
0 |
1 |
0 |
0 |
0 |
0 |
0 |
Table 5 details T and Monte Carlo run results for various species groups. Most of the hospitable species have wider distribution in general and are less susceptible to fragmentation, while, marginal species with narrower distribution are more susceptible to fragmentation. The processes for such nestedness are: selective immigration, selective extinction, selective levels of stress tolerance, nested habitats and passive sampling48. Superior dispersers generally exhibit a greater degree of nestedness than poor dispersers, and that the weakest nested patterns may be expected among species with naturally poor dispersal abilities23. This is evident in the present analyses wherein the species common to both reservoir and stream island show greater degree of nestedness compared to species of stream islands alone (Table 5). The fish species common to both reservoir and stream islands showed almost packed matrix with very low T. This leads to the inference that the anthropogenic activities in the catchment area of Sharavathi River over the last century in the form of construction of dams have resulted in homogenization of pool-loving fish fauna. Large reservoir area provided them the ideal habitat to flourish and to migrate from one stream island to another in accordance with the changing habitat conditions favoured by changes in climate. Whereas, the species restricted to stream islands are responsible to overall increase in T, for the very reason that more randomness, many idiosyncratic species and sites with unexpected absences and presences occur here. This indicates that the construction of the dam might have lead to the randomization of fish fauna in the lotic systems (stream island fishes) due to submergence of lotic habitats, in addition to complete isolation of stream islands.
Table 5. Nestedness parameters for three species groups
| Cases |
Matrix results |
System temperature (oC) |
Statistical significance (P) |
| T (oC) |
Fill (%) |
Average ± S.D. |
| All species in stream islands |
8.27 |
36.6 |
50.3 ± 6.91 |
6.15x10⁻¹⁰ |
| Species common to stream islands and reservoir |
0.37 |
41.1 |
46.6 ± 8.35 |
1.1x10-08 |
| Species exclusive to streams |
10.5 |
44.0 |
48.8 ± 7.39 |
1.39x10-07 |
Analysis of the land-use data revealed that the study area is experiencing rapid changes over the last 50 years49. Submersion of about 317.14 km2 area by the dam and the corresponding impacts in the form of human migrations and immigrations resulted in unequal distribution of the human population over the study area. Human habitations in stream islands of Western and southern part are less compared to eastern stream islands due to remoteness and isolation. Consequently large forests areas were cleared and converted agriculture and monoculture plantations in eastern stream islands resulting in higher sedimentation and conversion of perennial streams into ephimeral and seasonal, which had further implications on the microhabitat characteristics of the streams49. Specific levels of stress tolerance among the species resulted in selective extinction, while, species capable of migrating over a long distance and withstand lacustrine ecosystem migrated to other region. It is apparent from the study that selective extinction, selective migrations and selective levels of stress tolerance of the fish species determine the nestedness in a fragmented riverscape.
Conclusions
Major streams and tributaries of a riverscape become isolated stream islands due to the reservoir that choke the stream network and continuity due to habitat fragmentation as a consequence of anthropogenic activities. Fish assemblages in these isolated streams often exhibit strong nestedness pattern driven by selective extinction, levels of stress tolerance and immigration in species. The current study indicates the randomization of fish faunas in the lotic systems (stream island fishes) and at the same time homogenization of species in the lacustrine habitats due to construction of the dams.
ACKNOWLEDGEMENTS
We thank the Ministry of Environment and Forests, Government of India and Karnataka Power Corporation Limited, Government of Karnataka for the financial support. We thank our colleagues Vishnu D. Mukri, Shridhar Patgar, Sameer Ali, Lakshminarayana in field data collection and Avinash for GIS layers of Sharavathi river basin.
REFERENCES
- Vitousek, P. M., Mooney, H. A., Lubchenco, J., and Melillo, J. M. Human domination of earth’s ecosystems. Science, 1997, 277, 494–499.
- Aravind, N.A., Tambat, B., Ravikanth, G., Ganeshaiah, K.N., Umashaanker, R. Patterns of species discovery in the Western Ghats, a megadiversity hot spot in India. Journal of Bioscience, 2007, 32, 781 - 790.
- Myers, N., Mittermeier, R.A., Mittermeier, C.G., Da Fonseca, G.A. and Kent, J. Biodiversity hotspots for conservation priorities. Nature, 2000, 403, 853–858.
- Cincotta, R.P., Wisnewski, J. and Engelman, R. Human population in the biodiversity hotspots. Nature, 2000, 404, 990–992.
- Myers, N. Environmental services of biodiversity. Proceedings of National Academy of Sciences, 1996, 93, 2764–2769.
- Palumbi, S.R. Humans as the world’s greatest evolutionary force. Science, 2001, 293, 1786–1790.
- Novacek, M.J. and Cleland, E.E. The current biodiversity extinction event: Scenarios for mitigation and recovery. Proceedings of National Academy of Sciences, 2001, 98, 5466–5470.
- Tilman, D., Knops, J., Wedin, D., Reich, P., Ritchie, M. & Siemann, E. The influence of functional diversity and composition on ecosystem processes. Science, 1997, 277, 1300–1302.
- Dale, V.H., King, A.W., Mann, L.K., Washington-Allen, R.A. & McCord, R.A. Assessing land-use impacts on natural resources. Environmental Management, 1998, 22, 203–211.
- Fahrig, L. Effects of habitat fragmentation on biodiversity. Annual Review of Ecology, Evolution, and Systematics, 2003, 34, 487–515.
- Pringle, M.C. Fragmentation in stream ecosystems. Principles of Conservation Biology (ed. G.K. Meffe and C.R. Carroll) Essay 9D: 289–304. Sinauer Associates, Inc. Publishers 1997.
- Dudgeon, D. The ecology of tropical Asian rivers and streams in relation to biodiversity conservation. Annual Review of Ecology and Systematics, 2000, 31, 239–63.
- Dynesius, M. & Nilsson, C. Fragmentation and flow regulation of river systems in the northern third of the world. Science, 1994, 266, 753–762.
- Jansson, R., Nilsson, C. & Renofalt, B. Fragmentation of riparian floras in rivers with multiple dams. Ecology, 2000,81, 899–903.
- Zampella, R.A. & Bunnell, J.F. Use of reference-site fish assemblages to assess aquatic degradation in pinelands streams. Ecological Applications, 1998,8, 645–658.
- Wu, J., Huang, J. & Han, X. Three-gorges dam: Risk to ancient fish. Science,2003, 302, 149–1150.
- Amarasekare, P. & Possingham, H. Patch dynamics and metapopulation theory: the case of successional species. Journal of Theoretical Biology, 2001, 209, 333–344.
- Lytle, D.A. & Poff, N.L. Adaptation to natural flow regimes. TRENDS in Ecology and Evolution, 2004, 19, 94–100.
- Townsend, C.R. The ecology of streams and rivers, 1980 Edward Arnold (Publishers) Limited, London, 68 pp.
- Imhof, J.G., Fitzgibbon, J. & Annable, W.K. A hierarchical evaluation system for characterizing watershed ecosystems for fish habitat. Canadian Journal of fish and Aquatic Science, 1996, 53, 312–326.
- Magoulick, D.D. & Kobza, R.M. The role of refugia for fishes during drought: a review and synthesis. Freshwater Biology, 2003, 48, 1186–1198.
- Metcalfe, J.D. & Arnold, G.P. Tracking fish with electronic tags, Nature,1997, 387, 665–666.
- Yiming, L., Niemelia, J. & Dianmo, L. Nested distribution of amphibians in the Zhoushan archipelago, China: can selective extinction cause nested subsets of species? Oecologica, 1998, 113, 557–564.
- Atmar, W. & Patterson, B.D. The measure of order and disorder in the distribution of species in fragmented habitat. Oecologia, 1993, 96, 373–382.
- Poulin, R. & Valtonen, E.T. Nested assemblages resulting from host size variation: the case of endoparasite communities in fish hosts. International Journal for Parasitology, 2001, 31, 1194–1204.
- Patterson, B.D. & Atmar, W. Nested subsets and the structure of insular mammalian faunas and archipelagos. Island biogeography of mammals (ed. by L.R. Heaney and B.D. Patterson BD). 1986, 65-82. Academic Press, London.
- Whittaker, R.J. Island Biogeography: ecology, evolution and conservation 1998, Oxford University Press, Cambridge.
- Jonsson, B.G. A null model for randomization tests of nestedness in species assemblages. Oecologia, 2001, 127, 309–313.
- Hecnar, S.J. & M’Closkey, T.M. Patterns of nestedness and species association in a pond dwelling amphibian fauna. OIKOS, 1997, 80, 371–381.
- Olivier, H & Martin, H. Nested subset analysis as a tool for characterizing plant community composition in Flemish woodlands. Proceedings IAVS Symposium, Nagano, Japan 2000, 357–360.
- Hecnar, S.J., Casper, G.S., Russell, R.W., Hecnar, D.R. & Robinson, J.N. Nested species assemblages of amphibians and reptiles on islands in the Laurentian Great Lakes. Journal of Biogeography, 2002, 29, 475–489.
- Vaughn, C.C. & Taylor, C.M. Impoundments and the decline of freshwater mussles: a case study of an extinction gradient. Conservation Biology, 1999, 13, 912–920.
- Poulin, R. & Guegan J. Nestedness, anti-nestedness, and the relationship between prevalence and intensity in ectoparasite assemblages of marine Fish: a spatial model of species coexistence. International Journal for Parasitology, 2000, 30, 1147–1152.
- Taylor, C.M. & Warren JR, M.L. Dynamics in species composition of stream fish assemblages: Environmental variability and nested subsets. Ecology, 2001, 82, 2320–2330.
- Nally, R.M. & Brown, G.W. Reptiles and habitat fragmentation in the box-ironbark forests of central Victoria, Australia: predictions, compositional change and faunal nestedness. Oecologia, 2001, 128, 116–125.
- Fleishman, E. & Murphy, D.D. Patterns and processes of nestedness in a Great Basin butterfly community. Oecologia, 1999, 119, 133–139.
- Fleishman, E., Betrus, C.J., Blair, R.B., Mac Nally, R. & Murphy, D.D. Nestedness analysis and conservation planning: the importance of place, environment, and life history across taxonomic groups. Oecologia, 2002, 133, 78–89.
- Schmera, D. Nested assemblage structure of caddisflies (Insecta: Trichoptera) inhabiting in North-Hungarian streams. Folia Historico Naturalia Musei Matraensis, 2004, 28, 195–198.
- Baldi, A. Extinction disorders the species composition of metacommunities. Acta Zoologica Academiae Scientiarum Hungaricae, 2003, 49, 159–165.
- Wethered, R. & Lawes M.J. Nestedness of bird assemblages in fragmented Afromontane forest: the effect of plantation forestry in the matrix. Biological Conservation, 2005, 123, 125–137.
- Conroy, C.J., Demboski, J.R. & Joseph, A. Mammalian biogeography of the Alexander Archipelago of Alaska: a north temperate nested fauna. Journal of Biogeography, 1999, 26, 343–352.
- Jepsen, D.B. & Winemiller, K.O. Structure of tropical river food webs revealed by stable isotope ratios. Oikos, 2000, 96, 46–55.
- Sreekantha. Sahyadri Mathsya. Sahyadri e-news, 2006, Issue XVII, http://wgbis.ces.iisc.ac.in/biodiversity/sahyadri_enews/newsletter/issue17/main_index.htm. last accessed on September 6, 2007
- Sreekantha, Subash Chandran, M.D., Mesta, D.K., Rao, G.R., Gururaja, K.V. & Ramachandra, T.V. Fish diversity in relation to landscape and vegetation in central Western Ghats, India. Current Science, 2007, 92, 1592–1603.
- Dudgeon, D. Endangered ecosystems: a review of the conservation status of the tropical Asian rivers. Hydrobiologia, 1992, 248, 167–191.
- Atmar, W. & Patterson, B.D. The nestedness temperature calculator. AICS Research Inc. (http://aics-research.com/nestedness/tempcalc.html, last accessed on September 06, 2007)
- Ibanez, J.J., Caniego, J. & Garcia-Alvarez, A. Nested subset analysis and taxa-range size distributions of pedological assemblages: implications for biodiversity studies. Ecological modeling, 2005, 182, 239–256.
- Fischer, J. & Lindenmayer, D.B. Treating the nestedness temperature calculator as a ‘‘black box ’’ can lead to false conclusions. Oikos, 2002, 99, 193–199.
- Ramachandra, T.V., Subhash Chandran, M.D., Sreekantha, Diwakar Mesta, Rao, G.R., Ali, S. Cumulative Impact Assessment in the Sharavathi river Basin. International Journal of Environment and Development, 2004, 1, 113–135.
|