
Monitoring Spatial Patterns Of Urban Dynamics In Ahmedabad City
Textile Hub Of India

Energy & Wetlands Research Group, Centre for Ecological Sciences (CES)
Centre for Infrastructure, Sustainable Transport and Urban Planning , Indian Institute of Science, Bangalore 560012, India.
Corresponding author: cestvr@ces.iisc.ac.in
Results and Discussion
Land cover: The pre-processed temporal remote sensing data were used to derive the land cover of the region using NDVI. Table 3 lists the temporal (1975-2010) dynamics of vegetation cover in Ahmedabad. The results of the analysis show that the percentage of vegetation cover has drastically reduced to almost half in past four decades, with an increase of area under non-vegetation (buildings, open space, water etc.). Land use analysis was performed to understand the status of various classes in the region.
4.2 Land use: Figure 3 depicts the results of the temporal land use analyses based on GMLC. Table 4 lists the land use statistics, which indicates the decline of area under vegetation to about 24% from 45%, and the increase of the urban impervious class from 3% to about 14 %, which is more than 400 times during four decades. Table 5 depicts the overall accuracy and kappa statistics of the analysis. Higher overall accuracy is an indicative that the derived land use information is in agreement with the ground conditions.
|
Vegetation (%) |
Non-vegetation (%) |
1975 |
49.78 |
50.22 |
1990 |
39.96 |
60.04 |
2000 |
29.87 |
70.13 |
2010 |
24.73 |
75.19 |
Table 3: Vegetation cover (based on NDVI
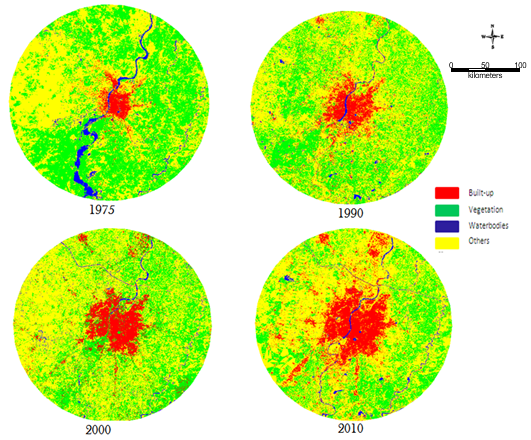
Figure 3: Temporal land use
|
Built-up (%) |
Vegetation (%) |
Water (%) |
Others (%) |
1975 |
3.2 |
45.4 |
2.8 |
48.54 |
1990 |
7.13 |
36.7 |
1.2 |
54.9 |
2000 |
9.41 |
32.6 |
1.44 |
56.5 |
2010 |
14.58 |
24.34 |
1.59 |
59.49 |
Table 4: Land use dynamics in Ahmedabad
Year |
Overall Accuracy (%) |
Kappa |
1975 |
72 |
0.4130 |
1990 |
98 |
0.6109 |
2000 |
79 |
0.7558 |
2010 |
87 |
0.8079 |
Table 5: Overall Accuracy and kappa statistics
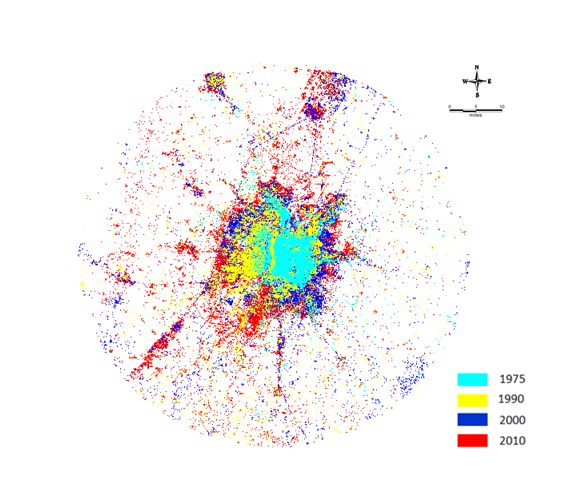
Figure 4: Urbanisation process during 1975- 2010
4.3 Shannon’s entropy (Hn): Figure 5 depicts Shannon entropy direction-wise, from 1975 to 2010. The values close to 0 in 1975 indicate that there was a compact growth, but the values have increased temporally to 0.3 indicating the tendency of sprawl or fragmented outgrowth. This highlights that the region is experiencing land transformation from centric growth to multi-dimensional fragmented growth. This growth might create more concentrated unconnected patch growths, leading to haphazard development without basic facilities, thereby impacting the local environment.
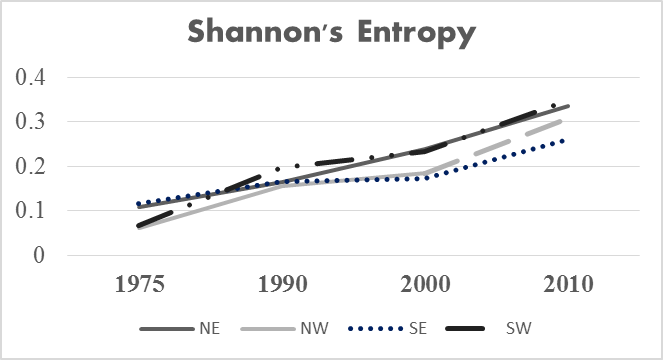
Figure 5: Shannon’s entropy
Spatial Metrics: Spatial metrics computed circle-wise for each zone are discussed next.
Metrics based on patch characteristics: Number of patches (NP) Patch density (PD) and Largest Patch Index (LPI) were computed to understand the urban dynamics. NP indicates the number of built-up patches in a landscape through the quantification of urban impervious patches in the landscape. It indicates the level of fragmentation and/or clumpiness in the landscape. Reduced number of patches shows that the patches are combining to form a single class patch (Bharath s et al., 2012, Saura et al., 2007). Patch density, analogous to number of patches, measures the patch concentration in an area. As the number of patches increases, patch density increases representing higher fragmentation, and vice versa (Wu, 2004). LPI is a measure of patch dynamics in the landscape and quantifies the size of the patch in the landscape and its extent (Wu, 2004). Results indicate the process of aggregation in the core or central business district compared to the periphery and the buffer zones. Globalisation and the reforms in the industrial sector during 1990’s witnessed a spurt in urban growth, which is evident from the occurrence of large number of urban patches surrounded by other land uses. Subsequent urban growth witnessed consolidation of fragmented patches with lower patch density and larger urban patch to form clumped urban pockets in all directions by 2010. Specifically, patches in Northwest and Southeast zones had clumped towards a single patch growth at the outskirts and even at the buffer zone.
Metrics based on shape characteristics: Area Weighted Mean Shape Index (AWMSI), Normalised Landscape Shape Index (NLSI) and Edge Density (ED) were computed to understand the urban pattern based on shape characteristics. AWMSI metric computes the average shape of patches considering the weighted average of patch areas so that larger patches are weighed higher than smaller ones (McGarigal et al., 2002). The results of this metric reveal that during 2010, the core area or the city centre has lower values indicative of regular clumped shapes such as square, circle etc., while outskirts and buffer regions have higher values that can be attributed to a fragmented landscape with irregular patch distributions. During 1970 and 1990s, patches were evenly distributed and were clumped with simple shapes. NLSI represents the normalised value of the shape of the class or patch under consideration. This index provides a simple measure of class aggregation or clumpiness through measure of the shape as complex or simple (Ramachandra et al., 2012a). Results show that in 1990 the buffer zones show the signs of urbanization with fragmented and complex shapes of growth, especially the gradients from 11 to 17. Further towards 2010, the core or the city administrative region (until gradient 7) show a clumped patch forming single dominant land use with little scope for further urbanization. City outskirts and also buffer region are experiencing dispersed growth or sprawl.
Edge density (ED) computes the total number of edges present in a landscape. The increase in the number of patches in a landscape would increase the edges, and compared to a clumped growth would show lesser edge density (Fauth et al., 2000; Botequilha-Leitao et al., 2006; DiBari, 2007; Rehm and Baldassarre, 2007). If ED is 0, then it indicates that the landscape has one single edge/class, or else the increasing values indicate the mixture of land use present in the landscape. Results show a trend of increasing edge densities in the periphery and the buffer zones; post 1990 there has been a steady increase in the gradients 7 to 17 which form the outskirts in NE and SW in 2010 indicating higher degree of fragmentation. Lower edge density in the surroundings of CBD indicates that the urban growth has taken a toll over other land uses and is in the process of clumped single patch formation.
Metrics based on contagion: Clumpiness Index (CLUMPY) and Aggregation Index (AI) were calculated. Clumpiness index measures patches’ aggregation or clumpiness (O’Neill et al., 1988) of the overall urban patches. Clumpiness ranges from -1 to 1 where Clumpy = -1, when urban patches are maximally disaggregated, Clumpy = 0 when the patch is distributed randomly, and Clumpy tends to 1 when urban patch type is maximally aggregated. Aggregation Index gives the similar indication as clumpiness. Values close to 1 at the centre in 2010, when compared to 1975 and in 1990, show the simple clumped growth at the centre and the values close to 0 are indicative of the random patch growth at the outskirts and buffer regions. Clumpiness index clearly indicates the disappearance of other land uses at the centre, and growing urban dominance at the city periphery (gradients 7 to 17) and the buffer region, which highlights that the region has to be monitored for appropriate planning to avoid haphazard growth. The aggregation index shows a similar trend as the clumpiness index indicating a single homogeneous patch at the central part of the city, whereas the outskirts are with urban fragmented patches
. Principal Component Analysis (PCA) was performed considering spatial metrics (area, shape and contagion), computed zone wise for each circle (Figure 6) and aided in assessing the patterns of urbanisation while prioritizing spatial metrics. PC 1 (Principal Component 1) explains 52.42 % variance is positively correlated to metrics NP, LSI and ED, and negatively correlated with Pland LPI and AI. PC1 represents fragmentation of the landscape (circles 10 to 26), evident from metrics (NP, and ED). PLAND, LPI and AI of Circles 1 to 9 lie in the negative plot with low correlation to PC1. These metrics indicate the presence of larger size patch representing aggregated or clumped growth. PC 2 has a percentage variance of 26, with positive loadings for circles 3 to 9, which are in the process of getting clumped. F

Figure 6: PCA of spatial metrics during 2010 (Note: A: Ahmedabad, Directions: NW, NE, SW, SE, concentric circles of incrementing 1 km radius: C1 to C 28)
Citation : Ramachandra T.V., Bharath H. Aithal and Sowmyashree M.V. Monitoring Spatial Patterns of Urban Dynamics in Ahmedabad City, Textile Hub of India Cit, Textile hub of INDIA, Spantial DE GRUYTER, International Review No 31, 85-91
* Corresponding Author :
Dr. T.V. Ramachandra
Energy & Wetlands Research Group, Centre for Ecological Sciences, Indian Institute of Science, Bangalore : 560 012, India.
Tel : 91-80-23600985 / 22932506 / 22933099, Fax : 91-80-23601428 / 23600085 / 23600683 [CES-TVR]
E-mail : cestvr@ces.iisc.ac.in, energy@ces.iisc.ac.in, Web : http://wgbis.ces.iisc.ac.in/energy