 |
Inventorying, Mapping and Monitoring of Mangroves towards Sustainable Management of West Coast, India
|
 |
Prakash N. Mesta1, Bharath Setturu1,3, Subash Chandran M. D.1, Rajan K.S3, T.V. Ramachandra1,2*
1Energy & Wetlends Research Group, Center for Ecological Sciences [CES], Indian Institute of Science,
2Center for Sustainable Technologies (astra), Indian Institute of Science,
3International Institute of Information Technology-Hyderabad [IIIT-H], India.
*Corresponding author:
Energy & Wetlands Research Group,
Centre for Ecological Sciences
Indian Institute of Science,
Bangalore – 560 012, INDIA, E-mail: cestvr@ces.iisc.ac.in, energy@ces.iisc.ac.in.
Materials and Method
Study area:
This study has been carried out in estuarine or brackish water environment of Bhatkal, Honnavar, Kumta and Ankola (partially) taluks of Uttara Kannada district in the west coast of India, located between 13°55' 15” to 14°36'3” N and, 74°17' 9” to 75°45’ 32” E (Figure 1). The region falls under the administrative jurisdiction of Honnavar forest division of Karnataka Forest Department. This region has gentle undulating hills, rising steeply from a narrow coastal strip bordering the Arabian Sea. Four major rivers Aghanashini, Gangavali, Sharavati and Venkatapura have their sources in the Sahyadri (Mountainous part of Western Ghats) and flow west through this region into the Arabian Sea. This region is having long stretch of dense and tall mangrove vegetation along the coast with a high number of mangrove plant species. Mangrove plants are locally known as Kandla or Sundari. In the district, planting of mangrove saplings took place post 1990’s with public and forest department participation. This sequence of activities at all estuaries has led to enhancement in mangrove cover of district. The constant blending and circulation of fresh water flow from one side, the tidal influx from the Arabian Sea oxygenates the water and circulates nutrients in these estuaries standing as high productive among west coast. The rich mangrove vegetation has significant role in food supply and act as a protective nurseries even for many species of marine fishes and prawns [39]. The major economic activity of this region is fishing, agriculture and horticulture. Fishery sector has been playing a crucial role in the economy of the district. Forests also play a significant role in economy and the region’s forest cover varies from semi-evergreen to evergreen and also with moist deciduous forests. This region is well known for the production of coconut, pepper, cardamom, cashew and areca nuts. The average rainfall ranges from 3009 to 4339 mm [40].
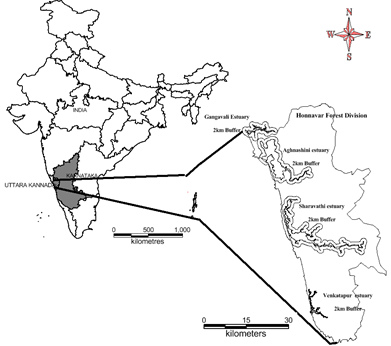 Figure 1 (a). Study area.
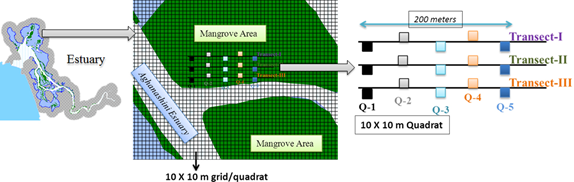
Figure 1(b). Field measurement and data collection
Remote sensing (RS) data:
The RS data used in the study include Landsat TM (1989), Landsat ETM+ (2003), IRS LISS-IV MX (2010), and Google Earth (http://earth.google.com). The Landsat data (a series of earth resource scanning satellites launched by the USA) is cost effective, with high spatial resolution and freely downloadable from public domains like Global Land Cover Facility (GLCF) (http://glcfapp.glcf.umd.edu:8080/esdi/index.jsp) and United States Geological Survey (USGS) (http://glovis.usgs.gov/). In this work, moderate spatial resolution remote-sensed imagery were employed, such as Landsat TM and ETM+ with high resolution IRS (Indian Remote Sensing Satellite system - launched in the course of the Indian Space Programme) L4MX data. The characteristics of datasets used are summarized in Table 1.
The prime use of ancillary data is to get assistance in the interpretation of different land use types from remotely sensed images. This includes Survey of India (SOI) topographical maps of scale 1:50,000 and 1:250,000, covering all taluks of Uttara Kannada district. These paper maps were digitized and geo-referenced to generate the base layers such as vector layers of taluk boundaries, drainage network, etc. These base layers were used for geometric correction of remote sensing data and training data collection.
Data set |
Year |
Resolution (M) |
Number of Bands |
Wavelength (μm) |
Landsat TM (Thematic Mapper) |
1989, 2000 |
28.5, 120 (6th band) |
7 |
B1:0.45-0.52
B2:0.52-0.60
B3:0.63-0.69
B4:0.76-0.90
B5:1.55-1.75
B6:10.4-12.5
B7:2.08-2.35 |
Landsat ETM+ (Enhanced Thematic Mapper Plus) |
2003 |
30, 60 (6th band); 15 (8th band) |
8 |
B1: 0.45-0.52
B2: 0.52-0.60
B3: 0.63-0.69
B4: 0.76-0.90
B5: 1.55-1.75
B6: 10.4-12.5
B7: 2.08-2.35
B8: 0.52-0.9 |
IRS-P6 L4 MX (Indian Remote sensing Satellite system P6 LISS 4 multi-spectral mode) |
2010 |
5 |
3 |
B2: 0.52 – 0.59
B3: 0.62 – 0.68
B4: 0.77 – 0.86 |
Table 1: Data used in the analysis.
The field survey of select training sites provided the attribute information of mangrove forests. Calibrated handheld GPS was used for collection of ground control points and training data. GPS calibration was done by taking the known coordinates like intersection of roads, buildings, etc. This is commonly used single step procedure which consists of extending existing adjustment procedures with additional observation equations [41]. The training data exercise provided the spatial extent and location (latitude and longitude) of different land uses. At 10 m intervals of each sample point, four distance limited quadrants of 5x5m2 were established with respect to the navigational direction and species wise locations and type were collected. Sampling was conducted at low tide time by placing the quadrat frames along each transect line, covering representative samples of the entire mangrove community. Transect based quadrat sampling was done to assess the species diversity, etc. Number of quadrats per transect depended on the species area curve. Transects were chosen to represent the study region and distributed uniformly all over the region, could be easily identified and located in the remote sensing data. This approach has provided good accuracy while allowing fairly rapid surveys. Transects were laid exclusively for training and validation exercises. Species level validation was done through independent validation plots. Categories exclusive and non-exclusive mangrove species were considered to determine the dominant species on the ground. Exclusive species referred to mangrove tree species that restricted to the mangrove habitat whereas non-exclusive species may be important in the mangrove habitat but which are not restricted to it. Training sites were selected for the most common species encountered in the mangrove regions. The remaining other species which did not form enough mono specific patches for training site selection are considered as other vegetation types. The site selection based on zonation of species availability, tidal condition place important role in field estimation [42]. In addition, essential ecological and botanical features of mangroves were observed and documented. The field observation, ground truth data are mainly aided to focus on locations where the landscape had been altered and land use had been changed over the past years.
The method used for mapping mangroves at west coast of India (Figure 2) involves downloading cloud free, atmospherically corrected RS data of Landsat from the public domain (http://glovis.usgs.gov/) and procuring IRS (Indian Remote Sensing) data from the National Remote Sensing Centre, Hyderabad (http://nrsc.gov.in). These data were subjected to the preprocessing which includes atmospheric correction and geometric correction (for correct area measurements), precise localization and multi-source data integration [43, 44]. Geometric correction was done by using ground control points collected from field survey as well as known points from topographic maps of the Survey of India. Landsat data was resampled to 30 meters to maintain common resolution across the multi resolution data.
Land use analyses involved i) generation of False Colour Composite (FCC) of remote sensing data (bands – green, red and NIR). This helped in locating heterogeneous patches in the landscape ii) selection of training polygons (these correspond to heterogeneous patches in FCC) covering 15% of the study area and uniformly distributed over the entire study area, iii) loading these training polygons co-ordinates into pre-calibrated GPS, vi) collection of the corresponding attribute data (land use types) for these polygons from the field. GPS helped in locating respective training polygons in the field. The field investigation was carried out for compilation of attribute data - mangroves species distribution at each training site, iv) supplementing this information with Google Earth v) 60% of the training data has been used for classification, while the balance is used for validation or accuracy assessment.
The land use analysis was done using supervised classification scheme of GMLC with the collected field data based on the spectral properties of features. GRASS GIS (Geographical Analysis Support System);a free and open source geospatial software with the robust functionalities for processing vector and raster data available at (http://wgbis.ces.iisc.ac.in/grass/) has been used for spatio-temporal analysis for the period 1989-2010. Species wise mangrove distribution maps were generated using higher spatial resolution IRS data (5 m) of 2010. The buffer of 2 km region is considered essentially to know the status of the estuary and its environs which have direct influence on the ecology of the estuary. Accuracy assessment of the classified remote sensing data was done to assess the quality of the information derived from remote sensed data by a set of reference pixels. The number of reference pixels are considered for each land use class is an important factor in determining the accuracy of the classification. These field data was overlaid on the species wise classified image, where each pixel can be considered to represent the dominant class in the region. Classification accuracy was determined using three complementary measures which are based on error matrices derived from independent field data. These test samples are then used to generate the error matrix (also referred as confusion matrix), kappa (κ) statistics and producer's (PA) and user' accuracies (UA) to assess the classification accuracies. An error matrix compares true reference data (from habitats visited in the field) to the habitat types predicted from image classification. The overall accuracy and a Kappa analysis were used to perform classification accuracy assessment. Kappa is an accuracy statistic that permits us to compare two or more matrices and weighs cells in error matrix according to the magnitude of misclassification. Kappa analysis is a discrete multivariate technique used in accuracy assessment [45]. The study provided spatio temporal dynamics of mangroves in the estuarine regionand the species wise mangrove distribution.
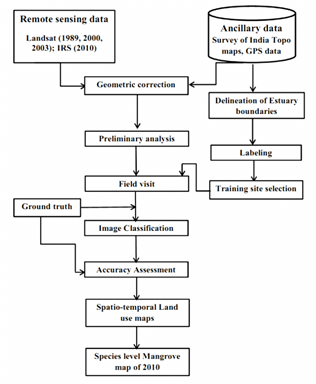 Figure 2. Flow chart of method used.
Citation : Mesta PN, Setturu B, Subash Chandran MD, Rajan KS, Ramachandra TV (2014) Inventorying, Mapping and Monitoring of Mangroves
towards Sustainable Management of West Coast, India. J Geophys Remote Sensing 3: 130. doi:10.4172/2169-0049.1000130.
|
|
|