Results
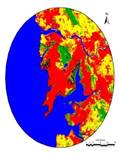
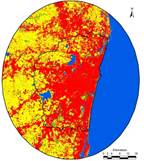
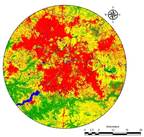
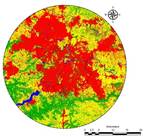
Geo-visualisation of urbanisation of five tier I cities are depicted in fig.1 to fig.5 and results are provided in tables 2 to 6 respectively. The cities on an average would grow by 1.5 to over 2 times the current state in next decade. By 2025, it is predicted that built up area in these cities and surroundings, grows over 57% (Delhi), 27% (Mumbai), 45.8% (Chennai), 50% (Pune) and 37% (Coimbatore) respectively. The various drivers of growth for different cities are as in annexure 1. In all these cases, spatially it could be understood that the CDP if implemented properly would play a major role in curtailing the unsustainable growth of the city in its limits, while some growth still takes place at the outskirts. Prime factors of growth include the transportation network, industrialisation, and educational sector.
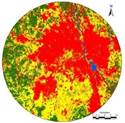
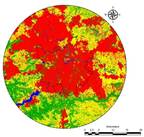
Modelling growth of Delhi
 |
|
Predicted 2017 |
Predicted 2024 |
 Predicted 2031 Predicted 2031
|
Fig.1: Predicted landscape dynamics of Delhi
Year |
Built up |
Vegetation |
Water |
Others |
2017 |
45.80 |
17.98 |
1.25 |
34.97 |
2024 |
57.37 |
8.77 |
1.18 |
32.68 |
2031 |
70.86 |
3.76 |
1.19 |
24.18 |
All units as percentage area
Table 2: Predicted landscape dynamics of Delhi
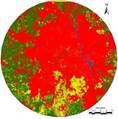
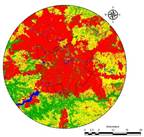
Modelling growth of Mumbai
 |
|
Predicted 2020 |
Predicted 2031 |

|
Fig.2: Predicted landscape dynamics of Mumbai
Year |
Built up |
Vegetation |
Water |
Others |
2020 |
25.83 |
9.09 |
44.52 |
20.56 |
2031 |
31.27 |
6.33 |
44.52 |
17.88 |
All units as percentage area
Table 3: Predicted landscape dynamics of Mumbai
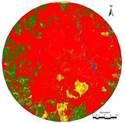
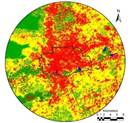
Modelling growth of Chennai
 |
Predicted 2026 |

|
Fig.3: Predicted landscape dynamics of Chennai
Year |
Built up |
Vegetation |
Water |
Others |
2026 |
45.80 |
17.98 |
1.25 |
34.97 |
All units as percentage area
Table 4: Predicted landscape dynamics of Chennai
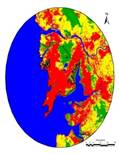
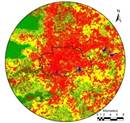
Modelling growth of Pune
|
|
Predicted 2016 |
Predicted 2019 |
|
|
Predicted 2022 |
Predicted 2025 |

|
Fig.4: Predicted landscape dynamics of Pune
Year |
Built up |
Water |
Vegetation |
Others |
2016 |
37.78 |
1.75 |
16.37 |
44.11 |
2019 |
41.64 |
1.75 |
20.16 |
36.45 |
2022 |
47.89 |
1.75 |
20.16 |
30.20 |
2025 |
50.02 |
1.75 |
20.16 |
28.06 |
All units as percentage area
Table 5: Predicted landscape dynamics of Pune
Modelling growth of Coimbatore
 |
|
Predicted 2023 |
Predicted 2033 |

|
Fig.5: Predicted landscape dynamics of Coimbatore
Year |
Built up |
Water |
Vegetation |
Others |
2023 |
32.64 |
0.29 |
17.14 |
49.94 |
2033 |
42.92 |
0.29 |
17.58 |
39.21 |
All units as percentage area
Table 6: Predicted landscape dynamics of Coimbatore
Citation : T.V. Ramachandra, Bharath H. A, Vinay S., Venugopal Rao K and. Joshi N V, Geospatial scenario based modelling of urban revolution in five major cities in India, 31st Annual In-House Symposium on Space Science and Technology ISRO-IISc Space Technology Cell, Indian Institute of Science, Bangalore, 8-9 January 2015