|
|
LAND USE (LU) DYNAMICS IN WETLANDS CATCHMENT
Land use changes in the wetland catchments are the direct and indirect consequence of human actions to secure essential resources. These changes encompass the greatest environmental concerns of human populations today, including loss of biodiversity, pollution of water and soil, and changes in the climate. Monitoring and mitigating the negative consequences of LU changes, while sustaining the production of essential wetlands resources has therefore become a major priority today.
Land use change analyses is done using Landsat MSS (1973), IRS P6 data (2013) and Google Earth (http://earth.google.com). The Landsat data is cost effective, with high spatial resolution and freely downloadable from public domains like GLCF (http://glcfapp.glcf.umd.edu:8080/esdi/index.jsp) and USGS (http://glovis.usgs.gov/). IRS P6 LISS-IV (Indian Remote Sensing Satellite, part of the Indian Space Programme) data was procured from the National Remote Sensing Centre, Hyderabad (http://www.nrsc.gov.in).
Remote sensing data obtained were geo-referenced, rectified and cropped corresponding to the study area. Geo-registration of remote sensing data (Landsat data) has been done using ground control points collected from the field using pre calibrated GPS (Global Positioning System) and also from known points (such as road intersections, etc.) collected from geo-referenced topographic maps published by the Survey of India. In the correction process numerous GCP’s are located in terms of their two image coordinates; on the distorted image and in terms of their ground coordinates typically measured from a map or located in the field, in terms of UTM coordinates as well as latitude and longitude. The Landsat data of 1973 are with a spatial resolution of 57.5 m x 57.5 m (nominal resolution), while IRS P6 are of 5.8 m.
Land use analyses involved (i) generation of False Color Composite (FCC) of remote sensing data (bands–green, red and NIR). This composite image helps in locating heterogeneous patches in the landscape, (ii) selection of training polygons by covering 15% of the study area (polygons are uniformly distributed over the entire study area) (iii) loading these training polygons co-ordinates into pre-calibrated GPS, (vi) collection of the corresponding attribute data (land use types) for these polygons from the field. GPS helped in locating respective training polygons in the field, (iv) supplementing this information with Google Earth and (v) 60% of the training data has been used for classification, while the balance is used for validation or accuracy assessment. The land use analysis was done using supervised classification technique based on Gaussian maximum likelihood algorithm with training data (collected from field using GPS).
Classifier based on Gaussian Maximum Likelihood algorithm has been widely applied as an appropriate and efficient classifier to extract information from remote sensing data. This approach quantitatively evaluates both the variance and covariance of the category spectral response patterns when classifying an unknown pixel of remote sensing data, assuming the distribution of data points to be Gaussian. After evaluating the probability in each category, the pixel is assigned to the most likely class (highest probability value). GRASS GIS (Geographical Resources Analysis Support System, http://ces.iisc.ac.in/grass ) a free and open source software with the robust support for processing both vector and raster data has been used for analyzing RS data. Temporal remote sensing data have been classified through supervised classification techniques by using available multi-temporal “ground truth” information. Earlier time data were classified using the training polygon along with attribute details compiled from the historical published topographic maps, vegetation maps, revenue maps, land records available from local administrative authorities.
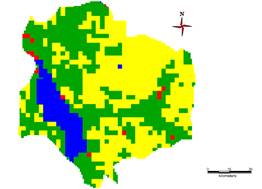
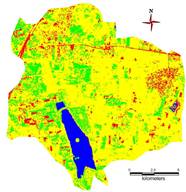
Figure 9: Land use dynamics in Jakkur lake catchment |
1973 (57M) |
|
2013 (2.7M) |
|

|
|
Table 6: Land use changes in Jakkur lake catchment (1973 -2013) |
|
Land Use categories (%) |
|
Years |
Urban |
Vegetation |
Water |
Others |
|
1973 |
1.19 |
44.06 |
5.63 |
49.1 |
|
2013 |
6.56 |
22.38 |
4.79 |
65.81 |
|
% Change |
5.37 |
-21.68 |
-0.84 |
18.71 |
|
Temporal remote sensing data of Landsat (1973) and IRS data (2013) were classified into four land use categories (Figure 9): tree vegetation, built-up, water-bodies and others (agriculture, open area, etc.). The analyses show decline of tree vegetation by 50% from 44.06% (1973) to 22.38% (2013), with an increase in built-up from 1.19 (1973) to 6.56% (2013). Details of land use analyses are listed in Table 6.
|
T.V. Ramachandra
Centre for Sustainable Technologies, Centre for infrastructure, Sustainable Transportation and Urban Planning (CiSTUP), Energy & Wetlands Research Group, Centre for Ecological Sciences, Indian Institute of Science, Bangalore – 560 012, INDIA.
E-mail : cestvr@ces.iisc.ac.in
Tel: 91-080-22933099/23600985,
Fax: 91-080-23601428/23600085
Web: http://ces.iisc.ac.in/energy
Durga Madhab MahapatraEnergy & Wetlands Research Group, Centre for Ecological Sciences, Indian Institute of Science, Bangalore – 560 012, INDIA.
E-mail: durgamadhab@ces.iisc.ac.in
Sudarshan P. BhatEnergy & Wetlands Research Group, Centre for Ecological Sciences, Indian Institute of Science, Bangalore – 560 012, INDIA.
E-mail: sudarshan@ces.iisc.ac.in
Asulabha K. S.
Energy & Wetlands Research Group, Centre for Ecological Sciences, Indian Institute of Science, Bangalore – 560 012, INDIA.
E-mail: asulabha@ces.iisc.ac.in
Sincy Varghese
Energy & Wetlands Research Group, Centre for Ecological Sciences, Indian Institute of Science, Bangalore – 560 012, INDIA.
E-mail: sincy@ces.iisc.ac.in
Bharath H. Aithal
Energy & Wetlands Research Group, Centre for Ecological Sciences, Indian Institute of Science, Bangalore – 560 012, INDIA.
E-mail: bharath@ces.iisc.ac.in
Citation: Ramachandra T.V., Durga Madhab Mahapatra, Sudarshan P. Bhat, Asulabha K.S., Sincy Varghese, Bharath H. Aithal, 2014. Integrated Wetlands Ecosystem: Sustainable Model to Mitigate Water Crisis in Bangalore, ENVIS Technical Report 76, Environmental Information System, CES, Indian Institute of Science, Bangalore 560012
| Contact Address : |
| |
Dr. T.V. Ramachandra
Energy & Wetlands Research Group,
Centre for Ecological Sciences,
New Biological Sciences Building, 3rd Floor, E-Wing, Lab: TE15
Indian Institute of Science, Bangalore – 560 012, INDIA.
Tel : 91-80-22933099 / 22933503(Ext:107) / 23600985
Fax : 91-80-23601428 / 23600085 / 23600683 [CES-TVR]
E-mail : cestvr@ces.iisc.ac.in, energy@ces.iisc.ac.in,
Web : http://wgbis.ces.iisc.ac.in/energy |
|