RESULTS
6.1. Pre-restoration
6.1.1. Water quality
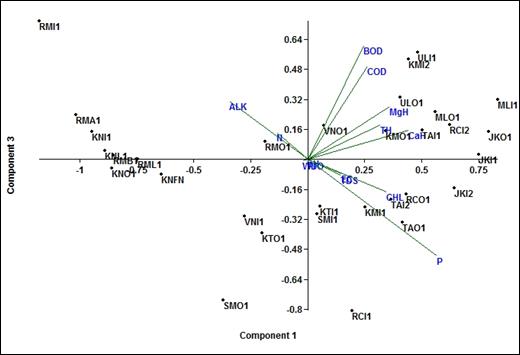
Physical and chemical parameters of water samples indicate significant variations across wetlands (Table 3, 4 and 5). pH, EC, BOD and COD values indicated marked difference among and as well as within wetlands. pH was lowest at Jakkur outlet (JKO1, 7.89), highest being at Mallathally inlet (MLI1, 10.30) and exceeding the BIS limits at Kommaghatta (KM), Kothanur (KT) and Rachenahalli (RC). Jakkur (JK) comprised high electric conductivity (1267.44 µScm-1) followed by Somapura (SM) (1022.67 µScm-1) and lowest observed at Venkateshpura (VN, 351.75 µScm-1). Sampling sites such as RC, VN, KM, RM and SM reflected low organic matter concentration in terms of BOD whereas high at JK, ML, Thalghattapura (TH), Ullau (UL), Kothanur (KT) and Konasandra (KN). A consistent high organic pollution in terms of COD was recorded at all wetlands with exception at RCI1, KMI1, SMO1, KNO1, RMA1 and RMB1 (refer table 2 for codes). Nitrates and phosphates concentration were within the permissible limits ranging between 0.015 to 0.092 mgL-1 and 0.001 to 0.064 mgL-1 respectively. Total hardness ranged between 67.5 mgL-1 (KTO1) to 346.67 mgL-1 (JKI2) and increased at MLO1 and JKI1. Chlorides level at KNI1 (41.75 mgL-1), JK, RCI2, MLI1 and JKI2 (295.36 mgL-1) reflected rigorous inflow of sewage due to densely built up catchment area. PCA biplot (Figure 3) explained 44.799% and 12.453 % variance from 1st and 3rd components respectively. PC1 explained influence of P at RC, KTI1, TAO1 and KMI1 sites. EC, TH, CaH, MgH and CHL were significantly high at right side of PC1 influencing ML, UL, JK and TH inlet sites where inflow of sewage with high ionic concentrations was apparent. The high alkalinity was evident through PC3 at RM and KN sites.
Figure 3 PCA tri-plot of water quality results analyzed from 11 Bangalore wetlands
Table 3: Water quality of Jakkur, Rachenahalli and Venkateshapura (HEBBAL VALLEY WETLANDS)
|
JAKKUR |
RACHENAHALLI |
VENKATESHPURA |
JKI1 |
JKI2 |
JKO1 |
JKM1 |
RCI1 |
RCI2 |
RCO1 |
RCM1 |
VNI1 |
VNI2 |
VNM1 |
pH |
7.98 |
8.1 |
7.9 |
8.3 |
9.2 |
9.1 |
9.0 |
9.0 |
8.54 |
8.21 |
8.41 |
Temperature(˚C) |
24.00 |
28.8 |
28.6 |
30.7 |
30.3 |
30.1 |
31.3 |
31.1 |
28.15 |
24.95 |
25.70 |
EC (µScm-1) |
1158.00 |
1325.7 |
1236.3 |
1239.3 |
871.3 |
885.7 |
854.3 |
884.7 |
342.00 |
361.50 |
346.50 |
Salinity (ppm) |
580.00 |
672.7 |
617.7 |
629.3 |
440.3 |
436.0 |
432.0 |
489.7 |
169.00 |
174.00 |
171.50 |
TDS (ppm) |
815.00 |
947.0 |
869.3 |
885.7 |
625.0 |
620.0 |
609.3 |
614.3 |
239.00 |
247.50 |
243.50 |
DO(mgL-1) |
3.25 |
6.9 |
4.8 |
8.0 |
6.1 |
7.8 |
7.3 |
9.3 |
8.13 |
6.18 |
7.40 |
BOD(mgL-1) |
|
3.2 |
2.6 |
2.4 |
3.1 |
3.7 |
4.3 |
1.9 |
3.02 |
2.74 |
2.29 |
COD(mgL-1) |
101.40 |
48.7 |
65.1 |
75.6 |
11.7 |
77.5 |
35.9 |
66.8 |
26.88 |
83.45 |
60.33 |
Nitrates(ppm) |
0.02 |
0.0 |
0.0 |
0.0 |
0.0 |
0.0 |
0.0 |
0.0 |
0.02 |
0.02 |
0.02 |
Phosphates(ppm) |
0.03 |
0.0 |
0.0 |
0.0 |
0.0 |
0.0 |
0.0 |
0.0 |
0.02 |
0.03 |
0.06 |
Sodium (ppm) |
77 |
79.7 |
78.0 |
79.7 |
72.5 |
62.2 |
57.6 |
66.4 |
16.8 |
17.0 |
17.2 |
Potassium(ppm) |
5.3 |
6.0 |
5.7 |
5.7 |
4.3 |
3.7 |
3.5 |
4.1 |
5.1 |
6.3 |
6.3 |
Total hardness (mgL-1) |
332.00 |
346.7 |
325.3 |
329.3 |
221.3 |
221.3 |
222.7 |
214.7 |
122.00 |
152.00 |
130.00 |
Ca hardness(mgL-1) |
104.00 |
100.0 |
85.3 |
84.0 |
84.7 |
72.7 |
80.0 |
68.0 |
63.33 |
56.00 |
64.00 |
Mg hardness(mgL-1) |
55.63 |
60.2 |
58.6 |
59.9 |
33.3 |
36.3 |
34.8 |
35.8 |
14.31 |
23.42 |
16.10 |
Alkalinity(mgL-1) |
160.00 |
163.3 |
160.0 |
156.7 |
126.7 |
120.0 |
120.0 |
133.3 |
100.00 |
95.00 |
80.00 |
Chlorides(mgL-1) |
303.88 |
295.4 |
267.9 |
273.6 |
196.0 |
191.2 |
208.3 |
200.7 |
45.44 |
44.02 |
35.50 |
Table 4: Water quality of Kommaghatta, Thalgattapura, Mallathally and Ullalu (K & C VALLEY WETLANDS)
|
KOMMAGHATTA |
THALGHATTPURA |
MALLATHALLY |
ULLALU |
KMI1 |
KMI2 |
KMO1 |
KMM1 |
TAI1 |
TAI2 |
TAO1 |
TAM1 |
MLI1 |
MLO1 |
MLM1 |
ULI1 |
ULO1 |
ULM1 |
pH |
9.3 |
9.0 |
9.0 |
9.1 |
9.0 |
9.13 |
8.5 |
9.1 |
10.30 |
9.28 |
10.37 |
8.80 |
8.97 |
8.70 |
Temperature(˚C) |
28.1 |
29.1 |
29.1 |
28.1 |
30.1 |
32.20 |
29.6 |
27.9 |
26.65 |
31.45 |
28.30 |
28.75 |
26.05 |
25.65 |
EC (µScm-1) |
812.0 |
782.0 |
782.0 |
791.5 |
779.0 |
763.00 |
790.5 |
784.0 |
1160.00 |
1105.00 |
1128.00 |
747.50 |
587.00 |
605.00 |
Salinity (ppm) |
400.5 |
394.0 |
394.0 |
385.5 |
385.0 |
383.00 |
388.5 |
388.0 |
574.00 |
553.50 |
566.00 |
511.50 |
295.50 |
348.00 |
TDS (ppm) |
594.0 |
558.0 |
558.0 |
552.0 |
536.0 |
527.00 |
670.0 |
544.0 |
807.00 |
803.00 |
783.50 |
514.00 |
416.50 |
495.00 |
DO(mgL-1) |
6.0 |
4.6 |
4.6 |
8.1 |
11.5 |
13.33 |
5.6 |
11.5 |
9.39 |
7.44 |
10.28 |
7.03 |
6.59 |
7.24 |
BOD(mgL-1) |
2.9 |
3.2 |
3.2 |
1.2 |
-- |
-- |
-- |
-- |
4.18 |
2.23 |
3.10 |
-- |
-- |
-- |
COD(mgL-1) |
24.0 |
84.0 |
84.0 |
60.0 |
70.0 |
40.00 |
30.0 |
40.0 |
10.00 |
12.00 |
30.00 |
106.00 |
82.00 |
22.00 |
Nitrates(ppm) |
0.0 |
0.1 |
0.1 |
0.1 |
0.0 |
0.05 |
0.0 |
0.1 |
0.07 |
0.06 |
0.07 |
0.09 |
0.08 |
0.06 |
Phosphates(ppm) |
0.0 |
0.0 |
0.0 |
0.0 |
0.0 |
0.05 |
0.0 |
0.1 |
0.06 |
0.05 |
0.12 |
0.04 |
0.04 |
0.03 |
Sodium (ppm) |
17.2 |
14.6 |
14.6 |
16.9 |
15.4 |
15.20 |
15.9 |
14.9 |
29.70 |
27.95 |
27.50 |
15.15 |
10.30 |
13.90 |
Potassium(ppm) |
0.7 |
0.7 |
0.7 |
0.7 |
7.7 |
7.40 |
7.6 |
7.4 |
4.50 |
4.50 |
4.10 |
0.35 |
0.40 |
0.30 |
Total hardness (mgL-1) |
264.0 |
298.0 |
298.0 |
285.0 |
178.0 |
188.00 |
180.0 |
164.0 |
278.00 |
302.00 |
330.00 |
298.00 |
224.00 |
255.40 |
Ca hardness(mgL-1) |
24.0 |
15.2 |
15.2 |
21.6 |
36.9 |
35.27 |
36.9 |
35.3 |
32.87 |
24.05 |
27.25 |
23.25 |
20.04 |
25.65 |
Mg hardness(mgL-1) |
58.5 |
69.0 |
69.0 |
64.3 |
34.4 |
37.27 |
34.9 |
31.4 |
59.81 |
67.82 |
73.87 |
67.04 |
49.77 |
56.06 |
Alkalinity(mgL-1) |
276.0 |
248.0 |
248.0 |
253.0 |
252.0 |
386.00 |
163.0 |
396.0 |
252.00 |
301.00 |
270.00 |
315.00 |
210.00 |
297.00 |
Chlorides(mgL-1) |
121.4 |
109.5 |
109.5 |
113.6 |
185.3 |
198.80 |
184.6 |
185.7 |
214.42 |
106.50 |
228.62 |
80.94 |
80.94 |
88.89 |
Table 5: Water quality of Sompura, Kothanur, Konasandra and Ramasandra wetlands (VRISHABHAVATHI VALLEY WETLANDS)
|
SOMAPURA |
KOTHNUR |
KONASANDRA |
RAMASANDRA |
SMI1 |
SMO1 |
SMM1 |
KTI1 |
KTO1 |
KNFN |
KNL1 |
KNI1 |
KNO1 |
RMI1 |
RMI1 |
RMI1 |
RMI1 |
RMI1 |
pH |
8.8 |
8.7 |
8.6 |
9.1 |
9.1 |
8.8 |
8.8 |
9.0 |
8.7 |
8.85 |
8.96 |
8.60 |
8.88 |
8.86 |
temperature(˚C) |
29.5 |
30.2 |
31.9 |
30.1 |
29.2 |
33.4 |
31.5 |
32.4 |
31.7 |
31.00 |
31.10 |
31.10 |
28.97 |
30.07 |
EC(µScm-1) |
1020.7 |
1024.7 |
1021.5 |
681.0 |
653.0 |
792.0 |
718.0 |
766.0 |
825.7 |
490.00 |
466.00 |
496.00 |
516.67 |
503.33 |
Salinity (ppm) |
504.0 |
500.7 |
506.5 |
338.0 |
329.5 |
397.0 |
387.3 |
385.3 |
414.3 |
242.00 |
230.00 |
249.00 |
257.67 |
248.33 |
TDS (ppm) |
708.7 |
709.7 |
721.0 |
472.0 |
467.0 |
551.3 |
548.0 |
537.7 |
582.0 |
343.00 |
369.33 |
356.00 |
357.67 |
353.67 |
DO(mgL-1) |
6.7 |
6.3 |
7.6 |
6.9 |
7.6 |
6.4 |
6.4 |
7.3 |
6.1 |
6.67 |
6.05 |
7.06 |
6.21 |
6.37 |
BOD(mgL-1) |
3.3 |
0.9 |
2.7 |
4.9 |
4.0 |
4.0 |
3.3 |
3.2 |
4.4 |
3.95 |
5.51 |
8.83 |
2.60 |
4.67 |
COD(mgL-1) |
36.0 |
26.7 |
18.0 |
31.0 |
12.0 |
38.7 |
30.7 |
49.3 |
26.7 |
44.89 |
19.11 |
58.67 |
36.44 |
17.79 |
Nitrates(ppm) |
0.1 |
0.1 |
0.1 |
0.1 |
0.1 |
0.1 |
0.1 |
0.1 |
0.1 |
0.05 |
0.07 |
0.04 |
0.05 |
0.03 |
Phosphates(ppm) |
0.0 |
0.0 |
0.0 |
0.1 |
0.1 |
0.0 |
0.0 |
0.0 |
0.0 |
0.00 |
0.00 |
0.02 |
0.01 |
0.01 |
Sodium (ppm) |
43.2 |
40.7 |
38.4 |
21.2 |
21.0 |
28.5 |
26.4 |
18.5 |
22.1 |
18.5 |
14.5 |
17.6 |
20 |
18.56 |
Potassium(ppm) |
1.6 |
1.7 |
1.5 |
5.5 |
5.4 |
6.2 |
6.8 |
5.56 |
5.75 |
2.5 |
2.19 |
3.45 |
3 |
2.49 |
Total hardness (mgL-1) |
112.7 |
109.3 |
112.0 |
82.5 |
67.5 |
88.7 |
86.0 |
80.0 |
85.3 |
113.33 |
129.33 |
164.00 |
112.67 |
107.33 |
Ca hardness (mgL-1) |
31.0 |
33.7 |
34.5 |
25.1 |
23.0 |
23.0 |
23.0 |
24.0 |
24.9 |
30.73 |
33.13 |
41.28 |
34.20 |
33.67 |
Mg hardness(mgL-1) |
19.9 |
18.5 |
18.9 |
14.0 |
10.8 |
16.0 |
15.4 |
13.7 |
14.7 |
20.16 |
23.47 |
29.94 |
19.15 |
17.97 |
Alkalinity(mgL-1) |
265.3 |
286.7 |
192.0 |
194.0 |
192.0 |
406.0 |
334.7 |
327.3 |
398.0 |
1088.67 |
788.67 |
744.00 |
974.00 |
1100.67 |
Chlorides(mgL-1) |
120.7 |
82.4 |
115.0 |
142.0 |
139.2 |
69.2 |
57.5 |
41.7 |
71.9 |
59.92 |
61.53 |
100.82 |
65.13 |
64.89 |
6.1.2. Diatoms
Forty diatom genera comprising 91 species were identified from 33 sampled habitats (epiphytic, epilithic and episammic), with 10 species occurring at ≥10% relative abundances (RA) in at least one sample (Table 6). The most common and abundant species were Achnanthidium Kützing, Cyclotella meneghiniana Kützing, Diadesmis confervaceae Kützing, Gomphonema Ehrenberg, Nitzschia palea (Kutzing) W. Smith, Halamphora veneta Kützing, Gyrosigma rautenbachiae Cholnoky and Cymbella kappi (Cholnoky) Cholnoky, Achnanthidium species was not further identified due to complexity and its wide range of occurrence. Two Gomphonema sp. could not be identified to species level (as this could be new records) and needs further taxonomic stuides.
Diatom assemblage was compared for its dominance, evenness and species richness (Table 6). Shannon diversity index value for diatoms was highest at JK (2.27) and lowest at ML (1.10). Dominance ranged from 0.18 to 0.58 with highest dominance of C. meneghiniana Kützing at ML (0.58). None of the sampling sites except VN (0.58) had evenness index more than 50%. VN being the least polluted site with low ionic concentrations inhabit pollution sensitive species such as Achnanthidium sp., and Cymbella sp.
Table 6: Dominance, Diversity indices of diatoms across Bangalore wetlands
Sampling site |
JK |
RC |
VN |
KM |
MA |
UL |
KT |
TA |
SM |
KN |
RA |
Taxa S |
24 |
18 |
25 |
20 |
14 |
21 |
19 |
20 |
24 |
23 |
22 |
Dominance D |
0.20 |
0.26 |
0.51 |
0.27 |
0.58 |
0.31 |
0.18 |
0.25 |
0.34 |
0.25 |
0.30 |
Shannon H |
2.27 |
1.97 |
1.38 |
2.08 |
1.10 |
1.88 |
2.12 |
1.88 |
1.78 |
1.99 |
1.87 |
Simpson |
0.80 |
0.74 |
1.36 |
0.73 |
0.42 |
0.69 |
0.82 |
0.75 |
0.66 |
0.75 |
0.70 |
Evenness |
0.42 |
0.42 |
0.79 |
0.46 |
0.28 |
0.35 |
0.44 |
0.33 |
0.29 |
0.36 |
0.31 |
Minimum and Maximum values are in Bold font. Sampling codes as mentioned in Table 2.
6.1.3. Mollusks
13 taxa of mollusks, of which 11 gastropods and two bivalves were found across sampling sites (Table 7). Among the surveyed wetlands, Ullalu had the highest number of species (7) and lowest at Thalghattapura (1), where as maximum abundance was found at Mallathahally (330) and minimum at Kommaghatta (11). Ullalu had the highest Shannon and Simpson diversity value, and lowest dominance. As single species was recorded at Thalghattapura, Shannon and Simpson diversity values were zero and dominance and evenness values accounted to be 1. The genus Physa was dominated (256 individuals) in Mallathahally wetland which leads to the lowest evenness value (0.52) (Table 8). Lymnaea and Melanoides were widely presented in nine wetlands followed by Gyraulus (7), Segmentina (5), Indoplanorbis and Bellamya (4), and rest were at only one wetland (Table 7). Presence of genus Lymnaea, Melanoides (Synonym Thiara), Physa and Indoplanorbis indicate that all the studied wetlands were polluted.
Table 7: Diversity, richness, evenness and dominance value of mollusk across 11 selected wetlands.
Sampling site |
JA |
RC |
VN |
KM |
MA |
UL |
TA |
SM |
KN |
RM |
KT |
Taxa S |
5 |
4 |
2 |
3 |
4 |
7 |
1 |
3 |
5 |
5 |
6 |
Individuals |
61 |
56 |
24 |
11 |
330 |
92 |
32 |
39 |
55 |
43 |
33 |
Dominance D |
0.34 |
0.31 |
0.92 |
0.69 |
0.62 |
0.26 |
1.00 |
0.51 |
0.32 |
0.27 |
0.30 |
Shannon H |
1.27 |
1.23 |
0.17 |
0.60 |
0.74 |
1.55 |
0 |
0.84 |
1.31 |
1.38 |
1.39 |
Evenness |
0.71 |
0.86 |
0.59 |
0.61 |
0.52 |
0.67 |
1.00 |
0.77 |
0.74 |
0.80 |
0.67 |
Minimum and Maximum values are in Bold font. Sampling codes as mentioned in Table 2.
6.1.4. Aquatic Insects
A total of ten groups of aquatic insects were recorded from 11 wetlands (Table 9). Among the entire, dominant groups were Corixidae (54.4%), Notonectidae (19%) and Nepidae (14%). MA sampling site was dominated by Corixidae with 305 individuals while Notonectidae with 142 and Nepidae with 51 individuals at JKO and JKI respectively. Contrastingly VN accounted only 1 taxon and JK with 6 taxa. Dominance was high at VN (Less polluted site) and less at RM with 0.2. Shannon and Simpson diversity indices showed a higher value for RM (1.6 and 0.8) and less was at VN (0).
Table 8: Presence (+) of mollusks in 11 wetlands of Bangalore (Refer codes in Table 1 & 2).
Genus/Tribe (T) |
JA |
RC |
VN |
KM |
MA |
UL |
TH |
SO |
KN |
RM |
KT |
Bellamya |
+ |
|
|
|
|
+ |
|
|
+ |
+ |
|
Gabbia |
|
|
|
|
|
+ |
|
|
|
|
|
Gyraulus |
|
+ |
|
+ |
+ |
+ |
|
+ |
+ |
|
+ |
Indoplanorbis |
+ |
|
+ |
|
|
+ |
|
|
|
|
+ |
Lymnaea |
+ |
+ |
|
+ |
|
+ |
+ |
+ |
+ |
+ |
+ |
Melanoides |
+ |
+ |
+ |
+ |
|
+ |
|
+ |
+ |
+ |
+ |
Physa |
|
|
|
|
+ |
|
|
|
|
|
|
Segmentinieae (T) |
|
|
|
|
+ |
|
|
|
|
|
|
Segmentina |
+ |
+ |
|
|
+ |
|
|
|
+ |
|
+ |
Tarebia |
|
|
|
|
|
|
|
|
|
+ |
|
Thiara |
|
|
|
|
|
|
|
|
|
|
+ |
Lamellidens |
|
|
|
|
|
|
|
|
|
+ |
|
Pisidium |
|
|
|
|
|
+ |
|
|
|
|
|
Table 9: Diversity, richness, evenness and dominance value of aquatic insects for 11 wetlands (Refer codes in Table 1 & 2).
Sampling sites |
JK |
RC |
VN |
KM |
MA |
UL |
TA |
SM |
KN |
RM |
KT |
Taxa |
6 |
2 |
1 |
2 |
5 |
2 |
3 |
2 |
2 |
5 |
3 |
Dominance |
0.57 |
0.68 |
1 |
0.41 |
0.53 |
0.34 |
0.53 |
0.67 |
0.53 |
0.2 |
0.37 |
Shannon |
0.83 |
0.47 |
0 |
0.51 |
0.9 |
0.45 |
0.31 |
0.52 |
0.67 |
1.60 |
1.04 |
Simpson |
0.42 |
0.32 |
0 |
0.33 |
0.46 |
0.23 |
0.32 |
0.33 |
0.47 |
0.8 |
0.62 |
Evenness |
0.49 |
0.82 |
1 |
0.75 |
0.57 |
0.36 |
0.48 |
0.83 |
0.97 |
1 |
0.94 |
6.1.5. Butterfly
In the present study 12 species were observed which belong to Lycaenidae (three species), Nymphalidae (4), Pieridae (4), and one unidentified species. Pachliopta hector were observed from all the wetlands, Danaus chrysippus (9), Jamides celeno and Euploea core (8), Ariadne merione (4), Catopsilia pomona (3), Tirumala septentrionis (2), and rest were found in only one wetland. Catopsilia pomona, Tirumala septentrionis, Prosotas nora, Pseudozizeeria maha were found only from the K and C Valley, where as Colotis eucharis and one unidentified species at the Vrishabhavathi Valley (Table 10). In cluster analysis, three groups were formed at euclidean distance three. The first group consist K and C Valley wetlands, which had high number of taxa than the other valley wetlands, Venkateshpura (8), Jakkur (7), and Rachenahalli (7). The second group consist mainly Hebbal Valley wetlands and one Vrishabhavathi Valley wetland (Somapura), where as third group consist mainly Vrishabhavathi Valley wetlands and one Hebbal Valley wetland (Thalghattapura). The wetlands of second group had four similar species in each, where as only Pachliopta hector were common to the third group wetlands. If the sampling time extended, and all seasons and more number of habitats will be sampled, it may reveal the true picture of butterfly richness of the studied area.
Table 10: Presence (+) of butterflies across wetlands (Sampling codes as mentioned in Table 2)
Common names |
Scientific names |
Sampling sites |
JA |
RC |
VE |
UL |
MA |
KM |
TH |
RA |
SO |
KT |
KN |
Crimson Rose |
Pachliopta hector |
+ |
+ |
+ |
+ |
+ |
+ |
+ |
+ |
+ |
+ |
+ |
Plain Tiger |
Danaus chrysippus |
+ |
+ |
|
+ |
+ |
+ |
|
+ |
+ |
+ |
+ |
Common Cerulean |
Jamides celeno |
+ |
+ |
+ |
+ |
+ |
+ |
|
|
+ |
|
+ |
Common Indian Crow |
Euploea core |
+ |
+ |
+ |
+ |
+ |
+ |
|
|
+ |
+ |
|
Common Castor |
Ariadne merione |
+ |
+ |
+ |
|
|
|
|
+ |
|
|
|
Common Emigrant |
Catopsilia pomona |
+ |
+ |
+ |
|
|
|
|
|
|
|
|
Dark Blue Tiger |
Tirumala septentrionis |
+ |
|
+ |
|
|
|
|
|
|
|
|
Common Grass Yellow |
Eurema hecabe |
|
|
+ |
|
|
|
|
|
|
|
|
Common Lineblue |
Prosotas nora |
|
+ |
|
|
|
|
|
|
|
|
|
Pale Grass Blue |
Pseudozizeeria maha |
|
|
+ |
|
|
|
|
|
|
|
|
Plain Orange Tip |
Colotis eucharis |
|
|
|
|
|
|
|
|
|
|
+ |
Unidentified |
|
|
|
|
|
|
|
|
|
+ |
|
6.1.6. Birds
Birds belonging to both quatic and terrestrial habitats across three valleys in Bnagalore have been listed in Table 11- 13. Within the studied sampling sites, 89 bird species were recorded among those, 20 were identified as aquatic birds and 69 as terrestrial birds. Common aquatic birds found in wetlands were common coot, little cormorant, little grebe, Indian pond heron, median egret, purple heron and Cattle egret. Common terrestrial birds were Ashy prinia, Black kit, Blyths reed Warbler, Common Myna, House Crow, White breasted Kingfisher, Brahminy kit, Indian robin, lesser Koukal, Purple sunbird and White browed wagtail. Wetlands such as RM (34), JK (33) and RC (30) comprised taxa more than 30 species. Fewer birds were recorded at Ullalu (11) and Mallathally (15). Birds that are found at single sampling site have been listed in Table 14. The migratory birds were as well observed at few wetlands such as Booted warbler and White tailed swallow at JK; Thick billed warbler at ML; Wood sandpiper at KM; Brown shrike at TA; Garganey, Osprey and Wire tailed swallow at RM; Rosy starling at KT and Great tit at KN. White tailed swallow as observed at JK is noted as vulnerable and listed under C2a (ii) as per IUCN red list.
Table 11 List of water and terrestrial birds across Hebbal Valley Wetlands
Common name |
Scientific name |
Red list status |
JK |
RC |
VN |
WATER BIRDS |
Black crowned night heron |
Nycticorax nycticorax |
Least Concern |
|
+ |
|
Cattle egret |
Bubulcus ibis |
Least Concern |
|
+ |
+ |
Common coot |
Fulica atra |
Least Concern |
+ |
+ |
+ |
Great white Pelican |
Pelecanus onocrotalus |
Least Concern |
+ |
|
|
Great egret |
Casmerodius albus |
Least Concern |
|
+ |
|
Grey heron |
Ardea cinerea |
Least Concern |
+ |
|
|
Indian Pond - Heron |
Ardeola grayii |
Least Concern |
+ |
+ |
+ |
Large Egret |
Casmerodius albus |
Least Concern |
+ |
|
+ |
Little Cormorant |
Phalacrocarax niger |
Least Concern |
+ |
+ |
+ |
Little Grebe |
Tachybaptus ruficollis |
Least Concern |
+ |
|
+ |
Median Egret |
Mesophoyx intermedia |
Least Concern |
+ |
+ |
|
Purple Heron |
Ardea purpurea |
Least Concern |
+ |
+ |
|
Purple Moorhen |
Porphyrio porphyrio |
Least Concern |
+ |
+ |
|
Red-wattled lapwing |
Vanellus indicus |
Least Concern |
+ |
|
|
White breasted water hen |
Amaurornis phoenicurus |
Least Concern |
|
+ |
|
TERRESTRIAL BIRDS |
Asian koel |
Eudynamys scolopaceus |
Least Concern |
|
+ |
|
Ashy drongo |
Dicrurus leucophaeus |
Least Concern |
+ |
+ |
|
Ashy prinia |
Prinia socialis |
Least Concern |
+ |
+ |
+ |
Black kite |
Milvus migrans |
Least Concern |
+ |
+ |
+ |
Blue rock pigeon |
Columba livia |
Least Concern |
+ |
|
|
Blyths reed Warbler |
Acrocephalus dumetorum |
Least Concern |
+ |
+ |
+ |
Booted warbler |
Hippolais caligata |
Least Concern |
+ |
|
|
Brahminy kite |
Haliastur anth |
Least Concern |
+ |
+ |
|
Brain fever bird |
Cuculus varius |
Least Concern |
+ |
|
|
Brown headed starling |
|
|
|
+ |
|
Common Myna |
Acridotheres tristis |
Least Concern |
+ |
+ |
+ |
Common sandpiper |
Actitis hypoleucos |
Least Concern |
+ |
|
|
Gargey |
Anas querquedula |
Least Concern |
|
|
|
Greater Coucal |
Centropus sinensis |
Least Concern |
|
+ |
|
House crow |
Corvus splendens |
Least Concern |
+ |
+ |
+ |
House martin |
Delichon urbicum |
Least Concern |
|
|
+ |
Hoopoe |
Upupa epops |
Least Concern |
|
|
+ |
House swift |
Apus affinis |
Least Concern |
+ |
+ |
|
Indian roller |
Coracias benghalensis |
Least Concern |
+ |
|
|
Indian blue robin |
Luscinia brunnea |
Least Concern |
|
|
+ |
Jungle Myna |
Acridotheres fuscus |
Least Concern |
+ |
+ |
|
Little green bee eater |
Merops orientalis |
Least Concern |
|
|
+ |
Large pied wagtail |
Motacilla maderaspatensis |
|
|
+ |
+ |
Marsh Sandpiper |
Tringa stagnatilis |
Least Concern |
+ |
|
|
Oriental Magpie Robin |
Copsychus saularis |
Least Concern |
|
|
+ |
Paddyfield Pipit |
Anthus rufulus |
Least Concern |
+ |
|
+ |
Pied Kingfisher |
Ceryle rudis |
Least Concern |
+ |
+ |
|
Pied bushchat |
Saxicola caprata |
Least Concern |
|
|
+ |
Purple sunbird |
Nectarinia asiatica |
Least Concern |
|
+ |
|
Red rumped swallow |
Cecropis daurica |
|
|
|
+ |
Red vented bulbul |
Pycnonotus cafer |
Least Concern |
|
+ |
+ |
Rose- ringed Parakeet |
Psittacula krameri |
Least Concern |
+ |
+ |
|
Spotted dove |
Streptopelia chinensis |
Least Concern |
+ |
+ |
|
Tickell’s flowerpecker |
Dicaeum erythrorhynchos |
Least Concern |
|
|
|
Western marsh Harrier |
Circus aeruginosus |
Least Concern |
|
+ |
|
White breasted kingfisher |
Halcyon smyrnensis |
Least Concern |
+ |
+ |
+ |
White cheeked barbet |
Megalaima viridis |
Least Concern |
+ |
|
|
White tailed Swallow |
Hirundo megaensis |
Vulnerable C2a(ii) |
+ |
|
|
Table 12 List of water and terrestrial birds across K and C Valley Wetlands
Common name |
Scientific name |
Red list status |
UL |
ML |
KM |
TA |
WATER BIRDS |
Common coot |
Fulica atra |
Least Concern |
+ |
|
+ |
|
Cattle egret |
Bubulcus ibis |
Least Concern |
|
|
+ |
+ |
Greater cormorant |
|
|
|
|
+ |
+ |
Little Grebe |
Tachybaptus ruficollis |
Least Concern |
+ |
+ |
|
+ |
Little Cormorant |
Phalacrocarax niger |
Least Concern |
+ |
+ |
|
|
Little egret |
Casmerodius albus |
Least Concern |
|
|
+ |
+ |
Median egret |
Mesophoyx intermedia |
Least Concern |
+ |
+ |
|
|
Indian Pond-heron |
Ardeola grayii |
Least Concern |
|
|
+ |
+ |
Purple heron |
Ardea purpurea |
Least Concern |
|
+ |
|
+ |
White breasted water hen |
Amaurornis phoenicurus |
Least Concern |
|
|
|
+ |
TERRESTRIAL BIRDS |
Ashy prinia |
Prinia socialis |
Least Concern |
|
|
+ |
+ |
Ashy drongo |
Dicrurus leucophaeus |
Least Concern |
|
|
+ |
|
Blyths reed warbler |
Acrocephalus dumetorum |
Least Concern |
+ |
|
+ |
+ |
Black headed cuckoo shrike |
Coracina melanoptera |
Least Concern |
+ |
|
+ |
|
Black winged stilt |
Himantopus himantopus |
Least Concern |
|
+ |
|
|
Black shoulder kite |
Elanus axillaris |
Least Concern |
|
|
|
+ |
Black kite |
Milvus migrans |
Least Concern |
|
|
|
+ |
Blue rock pigeon |
Columba livia |
Least Concern |
|
|
|
+ |
Brahminy kite |
Haliastur anth |
Least Concern |
|
|
+ |
+ |
Brown shrike |
Lanius cristatus |
Least Concern |
|
|
|
+ |
Coppersmith barbet |
Megalaima haemacephala |
Least Concern |
|
|
+ |
|
Common Myna |
Acridotheres tristis |
Least Concern |
+ |
+ |
+ |
+ |
Common sandpiper |
Actitis hypoleucos |
Least Concern |
|
|
+ |
|
Chestnut Headed
bee eater |
Merops antherntia |
Least Concern |
|
+ |
|
|
Common swallow |
Hirundo rustica |
Least Concern |
|
+ |
|
|
Greater couckal |
Centropus sinensis |
Least Concern |
|
+ |
|
|
House swift |
Apus affinis |
Least Concern |
+ |
+ |
|
+ |
House crow |
Corvus splendens |
Least Concern |
|
+ |
|
+ |
House sparrow |
Passer domesticus |
Least Concern |
|
|
|
+ |
Indian blue robin |
Luscinia brunnea |
Least Concern |
|
+ |
+ |
+ |
Jungle crow |
Corvus macrorhynchos |
Least Concern |
+ |
|
|
|
Jungle myna |
Acridotheres fuscus |
Least Concern |
|
|
|
+ |
Lesser Couckal |
Centropus bengalensis |
Least Concern |
+ |
|
|
|
Marsh sandpiper |
Tringa stagnatilis |
Least Concern |
|
+ |
|
|
Paddyfield pipit |
Anthus rufulus |
Least Concern |
|
|
|
+ |
Pied kingfisher |
Ceryle rudis |
Least Concern |
|
|
+ |
+ |
Pied bushchat |
Saxicola caprata |
Least Concern |
+ |
|
|
|
Purple sunbird |
Nectarinia asiatica |
Least Concern |
|
+ |
|
|
Rose ringed parakeet |
Psittacula krameri |
Least Concern |
|
|
+ |
+ |
Red whiskered bulbul |
Pycnonotus Jocosus |
Least Concern |
+ |
|
+ |
|
Spotted dove |
Streptopelia chinensis |
Least Concern |
+ |
+ |
|
|
Small green bee eater |
Merops orientalis |
Least Concern |
|
+ |
|
|
Tree pipit |
Anthus trivialis |
Least Concern |
+ |
|
|
|
Thick billed warbler |
Acrocephalus aedon |
Least Concern |
|
+ |
|
|
White breasted kingfisher |
Halcyon smyrnensis |
Least Concern |
+ |
|
|
|
White browed wagtail |
Motacilla maderaspatensis |
|
|
+ |
+ |
|
Wood sandpiper |
Tringa glareola |
Least Concern |
|
+ |
+ |
|
Table 13 List of water and terrestrial birds across Vrishabhavathi valley wetlands
Common names |
Scientific name |
Red list status |
RM |
SM |
KT |
KN |
WATER BIRDS |
Common coot |
Fulica atra |
Least Concern |
|
|
+ |
|
Cattle egret |
Bubulcus ibis |
Least Concern |
+ |
+ |
+ |
|
Great cormorant |
Phalacrocorax carbo |
Least Concern |
+ |
+ |
|
|
Grey heron |
Ardea cinerea |
Least Concern |
+ |
|
|
|
Little egret |
Egretta garzetta |
Least Concern |
|
+ |
+ |
|
Little cormorant |
Phalacrocorax niger |
Least Concern |
+ |
+ |
|
+ |
Little grebe |
Tachybaptus ruficollis |
Least Concern |
+ |
|
|
+ |
Median egret |
Mesophoyx intermedia |
Least Concern |
|
|
|
+ |
Asian Open billed stork |
Anastomus oscitans |
Least Concern |
+ |
|
|
|
Indian Pond-heron |
Ardeola grayii |
Least Concern |
|
+ |
+ |
+ |
Purple heron |
Ardea purpurea |
Least Concern |
+ |
+ |
|
+ |
White breasted water hen |
Amaurornis phoenicurus |
Least Concern |
|
|
|
+ |
TERRESTRIAL BIRDS |
Asian Koel |
Eudynamys scolopaceus |
Least Concern |
|
|
+ |
|
Ashy prinia |
Prinia socialis |
Least Concern |
|
+ |
+ |
|
Blyths reed warbler |
Acrocephalus dumetorum |
Least Concern |
+ |
|
+ |
+ |
Black headed Cuckoo shrike |
Coracina melanoptera |
Least Concern |
|
+ |
|
|
Black kite |
Milvus migrans |
Least Concern |
+ |
+ |
+ |
+ |
Brahminy Kite |
Haliastur anth |
Least Concern |
+ |
|
+ |
+ |
Blue rock pigeon |
Columba livia |
Least Concern |
|
|
+ |
|
Common Myna |
Acridotheres tristis |
Least Concern |
+ |
+ |
+ |
+ |
Common swallow |
Hirundo rustica |
Least Concern |
|
|
+ |
|
Darter |
Anhinga melanogaster |
Near Threatened |
+ |
|
|
|
Garganey |
Anas querquedula |
Least Concern |
+ |
|
|
|
Green billed Malkoha |
Phaenicophaeus tristis |
Least Concern |
+ |
|
|
|
Greater couckal |
Centropus sinensis |
Least Concern |
|
+ |
|
|
Great tit |
Parus major |
Least Concern |
|
|
|
+ |
Grey francolin |
Francolinus pondicerianus |
Least Concern |
+ |
|
|
|
House swift |
Apus affinis |
Least Concern |
+ |
|
+ |
|
House crow |
Corvus splendens |
Least Concern |
|
+ |
+ |
+ |
House sparrow |
Passer domesticus |
Least Concern |
|
|
|
+ |
Indian robin |
Saxicoloides fulicatus |
Least Concern |
+ |
+ |
+ |
|
Indian great reed warbler |
Acrocephalus arundinaceus |
Least Concern |
|
+ |
|
|
Jungle babbler |
Turdoides striata |
Least Concern |
+ |
|
+ |
|
Jungle crow |
Corvus macrorhynchos |
Least Concern |
+ |
|
|
|
Lesser Couckal |
Centropus bengalensis |
Least Concern |
+ |
|
+ |
+ |
Oriental magpie Robin |
Copsychus saularis |
Least Concern |
|
+ |
|
|
Osprey |
Pandion haliaetus |
Least Concern |
+ |
|
|
|
Indian Peafowl |
Pavo cristatus |
Least Concern |
|
+ |
|
|
Pied kingfisher |
Ceryle rudis |
Least Concern |
+ |
|
+ |
|
Pied bushchat |
Saxicola caprata |
Least Concern |
|
+ |
|
|
Paddyfield pipit |
Anthus rufulus |
Least Concern |
+ |
+ |
+ |
|
Purple Sunbird |
Nectarinia asiatica |
Least Concern |
+ |
+ |
|
+ |
Red vented bulbul |
Pycnonotus leucotis |
Least Concern |
+ |
|
+ |
+ |
Red whiskered bulbul |
Pycnonotus Jocosus |
Least Concern |
+ |
|
|
|
Red wattled Lapwing |
Vanellus indicus |
Least Concern |
+ |
+ |
|
+ |
River tern |
Sterna aurantia |
Least Concern |
+ |
+ |
|
|
Rosy starling |
Sturnus roseus |
Least Concern |
|
|
+ |
|
Rose ringed parakeet |
Psittacula krameri |
Least Concern |
+ |
+ |
|
|
Small green bee-eater |
Merops orientalis |
Least Concern |
+ |
|
|
|
Small Kingfisher |
Alcedo atthis |
Least Concern |
|
|
|
+ |
Tickell’s blue flycatcher |
Cyornis tickelliae |
Least Concern |
|
|
|
+ |
White cheeked barbet |
Megalaima viridis |
Least Concern |
|
|
+ |
|
White browed wagtail |
Motacilla maderaspatensis |
-- |
+ |
+ |
+ |
+ |
Wire tailed swallow |
Hirundo smithii |
Least Concern |
+ |
|
|
|
White breasted kingfisher |
Halcyon smyrnensis |
Least Concern |
+ |
+ |
|
+ |
Wood sandpiper |
Tringa glareola |
Least Concern |
+ |
|
|
|
Table 14 List of birds recorded at single wetland (Bold- Migratory birds)
SAMPLING SITES |
WATER BIRDS |
TERRESTRIAL BIRDS |
JK |
Great white Pelican,
Red-wattled lapwing |
Booted warbler, Brain fever bird, Indian roller, White tailed Swallow |
RC |
Black crowned night heron |
Brown headed starling, Western marsh Harrier |
VN |
-- |
Hoopoe, Indian blue robin, Red rumped swallow |
UL |
-- |
Tree pipit |
ML |
-- |
Black winged stilt, Chestnut Headed bee- eater, Thick billed warbler |
KM |
-- |
Wood sand piper |
TA |
Great cormorant |
Black shoulder kite, Brown shrike, Paddy field pipit |
RM |
Great cormorant,
Asian Open billed stork |
Darter, Garganey, Green billed Malkoha, Grey francolin, Osprey, Wire tailed swallow |
SM |
-- |
Black headed Cuckoo shrike, Indian great reed warbler, Indian Peafowl, River tern |
KT |
-- |
Rosy starling |
KN |
-- |
Great tit, Tickell’s blue flycatcher |
6.2. Post- restoration
As the restoration work at Ramasandra, Venkateshapura, Konasandra, Mallathahally and Ullalu wetlands was in progress/not completed, these wetlands were excluded from post-restoration monitoring. Ramsandra, Venkateshpura, Konsandra, Mallathally and Ullalu were still under construction process (during November 2011) though the time limit was mentioned as September- October 2010.
6.2.1. Water quality
Physical and chemical parameters analyzed after wetland restoration are listed in Table 14 (Hebbal valley), 15 (K & C valley) and 16 (Vrishabhavathi valley). pH at all valleys ranged from neutral of 7.14 at KTO1 to slightly alkaline i.e., 8.5 KMI2. Electric conductivity was well within the BIS standards at all sites except at Kothanur showing a highest of 1110 µScm-1 followed by 911 at Rachenahalli inlet (RCI1). Dissolved oxygen ranged from 0.97 at KTI1 to 8.94 at KMO1 site with low levels at wetlands such as JK, RC and KT. Biological oxygen demand (BOD) and Chemical oxygen demand (COD) were recorded as exceeding the BIS limits at all samplings sites of JK, RC, KT and TAI1. This may be due to the continued untreated sewage inflow into the wetland bed during restoration. BOD ranged from 6.2 mgL-1 (RCO1) –10.2 mgL-1 (JKI2); 4.6 (KMI1) –10.2 mgL-1 (TAI1) and 4.4(SMI1) –14.5 mgL-1 (KTI1) at Hebbal, K&C and Vrishabhavathi valleys respectively while, 31(RCO1) –51 mgL-1 (JKI2); 23 (KMI1) – 51 mgL-1 (TAI1) and 22(SMI1) –72.5 mgL-1 (KTI1) at Hebbal, K&C and Vrishabhavathi valleys respectively. There was no nutrient limitation condition observed at any of the sampling site which showed nitrates ranging from 0.02 (RCO1, TAI1) to 0.17 ppm at KMO1 followed by 0.15 ppm at (KTO1) and, phosphates ranging from 0.02(JKI1) to 0.37 ppm at KT sampling sites. Somapura wetland showed a lowest value of 33.4 ppm sodium (Na) and Kommaghatta inlet (KMI1) with 6.43ppm of potassium (K) while the highest values were recorded at RCO1 with 78.11 ppm of sodium and JKI1 with 11.5 ppm of potassium respectively. Total hardness was recorded as lowest of 30 mgL-1 at Talghattapura and highest of 198.66 mgL-1 at JKI2 followed by 180.5 mgL-1 at KTO1. The subsequent rise in calcium hardness was as well observed at JKI2 with 99.38 mgL-1 of Ca and lowest of 28.54 mgL-1 at TAI1 site. Chlorides ranged from 103.2– 189.43 mgL-1 at Hebbal valley; 30.21– 87.4 mgL-1 at K &C valley and highest being, 32.2– 276.5 mgL-1 at Vrishabhavathi valley. PCA biplot (Figure 4) explains 47.631 % and 24.997 % variance from 1st and 2nd components respectively. The significant influence of CHL, BOD, COD, EC, TDS and K on Kothanur wetland and influence of total hardness on JKI1 was observed through PC1 axis. While, PC2 explained alkalinity at Kommaghatta wetland and high magnesium hardness at Rachenahalli and JKI1 sites. There was no or less influence of any of the variables on TA sites. PC1 showed the more influence of sewage at Kothanur wetland followed by Jakkur inlet
.
Table 15: Water quality of Jakkur and Rachenahalli wetlands (HEBBAL VALLEY wetlands)
|
JAKKUR |
RACHENAHALLI |
VENKATESHAPURA |
JKI1 |
JKI2 |
RCO1 |
RCI1 |
RCI2 |
NO DATA COLLECTED BECAUSE OF
INCOMPLETE RESTORATION |
pH |
7.89 |
7.96 |
8.02 |
8.43 |
8.36 |
Temperature(˚C) |
23 |
23.5 |
24.3 |
24.6 |
25.6 |
EC (µScm-1) |
889 |
865 |
844 |
911 |
890 |
Salinity (ppm) |
-- |
-- |
-- |
-- |
-- |
TDS (ppm) |
635 |
617.8571 |
602.8571 |
650.7143 |
635.7143 |
DO (mgL-1) |
5.691057 |
5.325203 |
4.878049 |
5.772358 |
4.390244 |
BOD (mgL-1) |
8.2 |
10.2 |
6.2 |
7 |
8.1 |
COD (mgL-1) |
41 |
51 |
31 |
35 |
40.5 |
Nitrates (ppm) |
0.072 |
0.065 |
0.02 |
0.095 |
0.04816 |
Phosphates (ppm) |
0.020164 |
0.044124 |
0.042416 |
0.034 |
0.053945 |
Sodium (ppm) |
64.5 |
63.6 |
78.11 |
74.89 |
69.23 |
Potassium (ppm) |
11.5 |
11.4 |
10.4 |
10.22 |
9.3 |
Total hardness (mgL-1) |
178.6667 |
198.6667 |
174.6667 |
73.33333 |
82.574 |
Ca hardness (mgL-1) |
99.38425 |
84.87875 |
88.28535 |
40.44652 |
37.11 |
Mg hardness (mgL-1) |
19.34491 |
27.76425 |
21.07704 |
8.024382 |
11.09 |
Alkalinity (mgL-1) |
120 |
128 |
134 |
150 |
178 |
Chlorides (mgL-1) |
189.43 |
187.23 |
167.3 |
103.2 |
111.3 |
Table 16: Water quality of Kommaghatta and Talghattapura wetlands (K & C VALLEY wetlands)
|
KOMMAGHATTA |
TALGHATTAPURA |
MALLATHA-HALLY |
ULLALU |
KMI1 |
KMI2 |
KMO1 |
TAI2 |
TAO1 |
TAI1 |
NO DATA COLLECTED BECAUSE OF
INCOMPLETE RESTORATION |
pH |
8.60 |
8.50 |
8.10 |
8.14 |
8.45 |
7.89 |
Temperature(˚C) |
22.00 |
24.11 |
24.70 |
25.50 |
25.00 |
25.70 |
EC (µScm-1) |
675.00 |
690.00 |
612.00 |
827.00 |
877.00 |
835.00 |
Salinity (ppm) |
-- |
-- |
-- |
-- |
-- |
-- |
TDS (ppm) |
482.14 |
492.86 |
437.14 |
590.71 |
626.43 |
596.43 |
DO (mgL-1) |
7.24 |
7.48 |
8.94 |
5.37 |
6.14 |
6.59 |
BOD (mgL-1) |
4.60 |
7.30 |
4.71 |
9.20 |
8.52 |
10.20 |
COD (mgL-1) |
23.00 |
36.50 |
23.55 |
46.00 |
42.60 |
51.00 |
Nitrates (ppm) |
0.05 |
0.04 |
0.17 |
0.15 |
0.11 |
0.02 |
Phosphates (ppm) |
0.08 |
0.03 |
0.05 |
0.04 |
0.12 |
0.10 |
Sodium (ppm) |
44.50 |
42.30 |
42.78 |
58.20 |
51.70 |
51.89 |
Potassium (ppm) |
6.43 |
7.45 |
7.30 |
8.40 |
8.10 |
7.89 |
Total hardness (mgL-1) |
116.00 |
150.00 |
138.00 |
42.00 |
32.00 |
30.00 |
Ca hardness (mgL-1) |
52.17 |
61.51 |
58.21 |
31.84 |
29.09 |
28.54 |
Mg hardness (mgL-1) |
15.57 |
21.59 |
19.47 |
2.48 |
0.71 |
0.36 |
Alkalinity (mgL-1) |
240 |
210 |
196 |
88 |
70 |
84 |
Chlorides (mgL-1) |
30.21 |
33.2 |
34.11 |
87.4 |
75.3 |
53.2 |
Table 17: Water quality analysis of Kothanur, Somapura, Konasandra and Ramasandra wetlands (VRISHABHAVATHI VALLEY wetlands)
|
KOTHANUR |
SOMAPURA |
KONASANDRA |
RAMASANDRA |
KTI1 |
KTO1 |
SMI1 |
SMO1 |
NO DATA COLLECTED BECAUSE OF
INCOMPLETE RESTORATION |
pH |
7.2 |
7.14 |
8.3 |
8.23 |
Temperature(˚C) |
26.5 |
26.5 |
22.9 |
22 |
EC (µScm-1) |
1110 |
968 |
574 |
522 |
Salinity (ppm) |
-- |
-- |
-- |
-- |
TDS (ppm) |
792.85 |
691.428 |
410 |
372.85 |
DO (mgL-1) |
0.975 |
2.195 |
7.154 |
6.82 |
BOD (mgL-1) |
24.5 |
20.33 |
4.4 |
4.6 |
COD (mgL-1) |
72.5 |
66.65 |
22 |
23 |
Nitrates(ppm) |
0.078 |
0.15 |
0.12 |
0.08 |
Phosphates(ppm) |
0.298 |
0.3667 |
0.09 |
0.13 |
Sodium (ppm) |
71.02 |
75.43 |
47.67 |
33.4 |
Potassium (ppm) |
7.43 |
8.3 |
8.8 |
9.1 |
Total hardness (mgL-1) |
165 |
180.5 |
56.7 |
67.8 |
Ca hardness (mgL-1) |
65.62 |
129.88 |
35.87 |
38.92 |
Mg hardness (mgL-1) |
24.24 |
12.34 |
5.08 |
7.04 |
Alkalinity (mgL-1) |
130 |
80 |
60 |
40 |
Chlorides (mgL-1) |
235.63 |
276.5 |
34.2 |
32.2 |
Figure 4 PCA tri-plot of water quality results analyzed from 11 Bangalore wetlands
Figure 5 Bar plot explaining water quality variation during pre-restoration and post restoration studies across selected wetlands. (Codes as in text). a= variation in pH; b= electric conductivity; c= Chlorides; d= total alkalinity; e= total hardness and f= Calcium hardness
Figure 5 explains variation in water chemistry within and among six wetlands during pre (PRR) and post (POR) restoration period. pH ranged from 8.02-9.315 and 7.14 to 8.6 during PRR and POR respectively which infers a higher pH range in former study period than in later stages (fig. 5a). Conductivity was found to be highest of 1325.67 µScm-1 at JK during PRR sampling sites compared to the EC concentration during POR (range, 522- 1110 µScm-1) (Fig. 5b) which also reflected the ioninc levels i.e., cations and anions.
6.2.2. Variation in water chemistry among Pre-restoration (PRR) and Post-restoration (POR) period
Total hardness (range, 67.5- 346.67 ppm) and calcium hardness (range, 15.23- 100 ppm) during PRR of water decreased drastically during post restoration i.e., TH ranging 28.542- 129.89 ppm and CaH ranging 28.542- 129.89 ppm, excluding higher calcium hardness at KT with 129.89 ppm (figs. e & f). Kothanur wetland sampling after restoration resulted in high chlorides when compared to pre- restoration period, i.e., ranging from 235.63- 276.5 mgL-1.
However, there was no variation in alkalinity during PRR (120- 293 mgL-1) and POR (40- 240 mgL-1) (fig. d). Lower dissolved oxygen levels (<5 mgL-1) was recorded at JK, KM and TA during PRR and at wetland KT during POR studies which shows the higher amount of oxygen deficiency in wetlands. The overall BOD concentration ranged from 2.96- 34.35 ppm in PRR sites while it was decreased all through POR with a range of 4.4-14.5 ppm. The COD as well constituting for high organic matter was found to be exceeding BIS limits at all sampling sites except at Kommaghatta wetland and Somapura wetland during POR. No nutrient limiting condition was observed at any of the site which had nitrates of 0.015-0.079 ppm (PRR), 0.02- 0.17 ppm (POR) and phosphates of 0.02- 0.056 ppm (PRR) and 0.02- 0.366 ppm (POR).

Figure 6 Bar plot representing comparison of variation in water quality across selected Bangalore wetlands during PRR and POR. Top to bottomin order = Nitrates, Phosphates, dissolved oxygen, biological oxygen demadn & chemical oxygen demand.
6.2.3. Diatom distribution
A total of 103 taxa from 29 genera have been recorded during post restoration analysis. The dominant genera were Rophalodia sp., Nitzschia sp., Achnanthidium sp., Gomphonema sp., Navicula sp., Mastagloia sp.and Staphanodiscus sp. Diatom diversity indices were calculated across 5 wetlands for post restoration analysis (Table 18). Among these, highest taxa was recorded at Kommaghatta (41), followed by rest which showed less than 50% of taxa compared to former. A successive high Shannon index, low dominance value was recorded from Kommaghatta and high evenness at Jakkur (0.6). A significant variation in diversity indices could be observed in PRR and POR analysis. Shannon diversity and taxa number has been increased in POR while, no taxa was found dominating any of the sampling sites. Somapura wetland which comprised of 24 taxa before restoration showed a decreased in taxa number.
Table 18 Diatom diversity indices at 6 selected Bangalore wetlands during Post restoration water quality studies
Wetland name |
Taxa |
Dominance (D) |
Shannon (H) |
Evenness (E) |
Jakkur |
18.00 |
0.13 |
2.37 |
0.60 |
Rachenahalli |
20.00 |
0.16 |
2.27 |
0.50 |
Thalghattapura |
14.33 |
0.24 |
1.86 |
0.48 |
Komaghatta |
41.00 |
0.11 |
2.75 |
0.43 |
Somapura |
9.67 |
0.26 |
1.54 |
0.60 |
Kothanur |
9.00 |
0.38 |
1.43 |
0.64 |
6.2.3a. Diatom community structure during Pre and Post restoration studies
In order to investigate persistence of diatom taxa throughout restoration program, only those taxa which are more than 50% RA in at least one sampling site were considered for further analysis. A change in diatom community composition could be observed within wetlands and was significant with post-restoration water quality analysis. Wetlands such as JK, RC and KT which were dominated with C. meneghiniana (CMEN), Achnanthidium sp. (ACHD) and, ACHD and A. granulate (AGRA) respectively during PRR was later in POR replaced with N. palea (NPAL). Kommaghatta (KM) sampling sites were later in POR dominated with G. angustum and R. gibba (RGIB). Even though Somapura (SM) wetland had lowest species richness (Table 18), the community composition continued with Staphanodiscus hantzschii (SHAN) followed by ACHD and N. phylipta (NPHY). Achnanthidium sp. persistent to be dominant at Talghattapura wetland (TA) even after restoration together with M. smithii (MSMI) with a RA of 24%. The other dominating taxa found during post-restoration diatom analysis were N. pura (NPUR, 9%), N. gregaria (NGRE, 9%) at JK; CMEN (12%), N. gracilis (NGRA, 5%) at RC; A. veneta (AVEN, 10%), E. sorex (ESOR, 9%) at KM; Gomphonema sp. (GOMP, 16%) at SM; ACHD (37%) at TA and N. umbonata (NUMB, 29%) along with NPAL (26%) at KT wetlands.
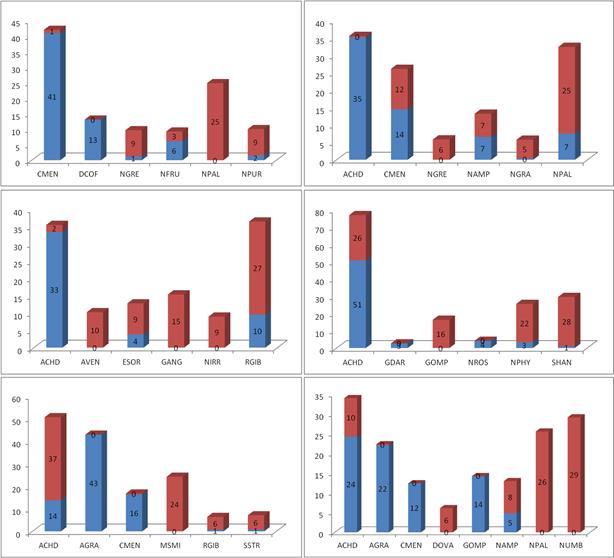
Figure 7 Column graph plot representing diatom species composition and a comparison between pre (BLUE) and post restoration (RED) studies. The numbers on columns indicate its %Relative abundance (RA). The diatom taxa codes are as elaborated in text/