3.1 Quantification of spatio temporal changes & implementation of the forest fragmentation model:
A. Land use analysis and change detection: Land use analysis was carried out at different time scales to determine the current status of forest ecosystem and the causes of transition in the land cover of the area. Temporal land use analyses show a decrease in the evergreen forests from 67.73% (1973) to 32.08% (2013). Land use changes involving the expansion of agricultural and horticultural lands are the prime causal factors of forest degradation.
The change in the land use pattern of the area can also attributed to various on-going developmental projects in Uttar Kannada. Portion of the evergreen forest is lost due to the horticultural plantations like areca and coconut plantation which have showed an increase from 2.01% to 5.25% during the time period from 1973 to 2013. The image differentiation is performed to identify the loss of forest cover from 1973 to 2013. This was done by thresholding the forest class and considering other classes as null. This visualization helps in assessing the impacts of unsustainable policy interventions, market induced changes and their implications.
3.2 Measuring LULC changes: LULC changes in Uttara Kannada district is analysed using temporal remote sensing data with ancillary data and field data. The method followed for LULC analysis is represented in figure1.2.
B. Forest fragmentation: Forest fragmentation category at pixel level is computed through Pf (the ratio of pixels that are forested to the total non-water pixels in the window) and Pff (the proportion of all adjacent (cardinal directions only) pixel pairs that include at least one forest pixel, for which both pixels are forested. In other words, The Pf is simply the proportion of non-missing pixels within the moving window with a specified size that are forest, and Pff is the ratio of the number of pixel pairs in cardinal directions that are both forest divided by the number of pixel pairs in cardinal directions where either one or both are forested. Pff estimates the conditional probability that given a pixel of forest, its neighbour is also forest. A moving window with the size of 5 X 5 pixels was used for the fragmentation analysis to maintain a fair representation of the proportion (Pf) of pixels in the window and to maintain interior forest at an appropriate level, due to the fact that the outcomes of the model are scale-dependent and threshold dependent (Riitters et al., 2000). The spatial maps of forest fragmentation components thus derived by computing ‘Pf’ and ‘Pff’ using the sliding kernel (of size 5 x 5) based on the total extent of forest and its occurrence as adjacent pixels. A pixel is classified by the type of fragmentation and the result of the kernel is stored at the location of the center pixel (in the derived map), which represents between-pixel fragmentation around the corresponding forest location. Details of levels of fragmentation with discriminant criteria of the each component are listed in Table 1 based on two indices, Pf and Pff. Depending on these indices values, the analysis will derive different fragmentation components to assess the health of forest of a region. Forest pixels that comprise a small forested area surrounded by non-forested land cover refers to Patch forests. Forest pixels that define the boundary between interior forest and large non forested land cover features are Edge forests. Perforated forest refers to pixels that are the boundary between interior forest and relatively small clearings (perforations) within the forested landscape. Interior forest are the forest pixels that are reasonably far away from the forest-non forest boundary. Interior forested areas are surrounded by more thick forested areas. Transitional types are clearly depending on non-forest and edge pattern. These are in between edge type and non-forest types. If higher pixels are non-forest then they will be tending to non-forest cover with higher degree of edge. The water bodies or river coarse are considered as non-fragmenting features, because they act as natural corridors in forested landscape. Non-forested areas including buildings, roads, agricultural field, and barren land, along with developed land, are considered fragmenting features.
Table 1: Fragmentation components and their description:
Fragmentation component |
Description |
Interior |
(Pf = 1), All of the pixels surrounding the center pixel are forest |
Patch |
(Pf < 0.4), Pixel is part of a forest patch on a non-forest background, such as a small wooded lot within a built-up region. |
Perforated |
(Pf > 0.6 and Pf - Pff > 0), Most of the pixels in the surrounding area are forested, but the center pixel appears to be part of the inside edge of a forest patch, such as would occur if a small clearing was made within a patch of forest. |
Edge |
(Pf > 0.6 and Pf - Pff < 0), Most of the pixels in the surrounding area are forested, but the center pixel appears to be part of the outside edge of forest, such as would occur along the boundary of a large built-up area, or agricultural field. |
Transitional |
(0.4 < Pf < 0.6), About half of the cells in the surrounding area are forested and the center forest pixel may appear to be part of a patch, edge, or perforation depending on the local forest pattern |
Temporal (1973 to 2013) land use information was used for the fragmentation analysis. The natural forest cover represents the categories of moist deciduous, evergreen to semi evergreen, scrub/grass, dry deciduous forest areas and this excludes forest plantations (acacia, teak, others). Figure 4 illustrates the changes in forest cover during the period. Figure 4 (a) illustrates the natural forest cover in 1973 (represented in green color). Figure 4 (b) provides forest cover in 1979, (Yellow pixels represent the extent of forest loss during 1973 to 1979). Similarly Figure 4 (c) portray the forest cover in 1989 (yellow pixels represent forest lost during 1973 to 1979, and pink pixels represents forests lost during 1979 to 1989. Figure 4(d) shows forest cover in 1999 and forest lost during 1973 to 1979 (yellow pixels), 1979 to 1989 (pink pixels), 1989 to 1999 (saffron pixels). Figure 4(e) and 4 (f) shows forest cover in 2010 and 2013 respectively, with changes during the earlier time periods. Table 2 provides the spatial extent of loss of forests during 1973 to 2013. The natural forest cover in the year 1973 shows 855854 ha, where as in 1979 it has reached to 7, 80,778 ha. The area of forest lost is 75076 ha (8.77% reduction) due to large scale projects such as Supa hydro-electric project and conversion of native forest to plantations and cultivation. The change pattern from 1979 to 1989 is moderate (6.03% reduction) whereas rapid loss has taken place during 1999 (forest cover 63.93 %) to 2010 (56.11%) due to implementation of many infrastructure, hydroelectric projects and other associated developments. The major disturbances noted in the forests of rural areas are due to the conversion of forest into agriculture (encroachments), and diversion of forest lands for other purposes and logging of wood by forest based industries. The current area of forest cover is 542475 ha (52.71%) and loss of area from 2010 to 2013 is 35021 ha (6.06%). The temporal analyses of vegetation cover in the designated forest boundaries (forests and forest plantation) of the district, which includes the temporal analysis of vegetation, reveal that forest plantations (of single species) though successful in restoring the green cover but have failed in maintaining the biodiversity or sustaining hydrological services in the region. The district has witnessed large scale afforestation in early 1980’s. The decline in vegetation cover during 1973 to 1979 is about 6.45% and during 1979-1989 is about 4.77%.
Table 2: Forest cover change from 1973 to 2013
Year |
Natural Forest cover |
Forest loss |
Vegetation cover (forests and forest plantations - monoculture) |
Forest loss |
Ha |
% |
Ha |
% |
Ha |
% |
Ha |
% |
1973 |
855854 |
83.17 |
|
910756 |
88.50 |
|
1979 |
780778 |
75.87 |
75076 |
8.77 |
851995 |
82.79 |
58761 |
6.45 |
1989 |
733692 |
71.30 |
47086 |
6.03 |
811323 |
78.84 |
40672 |
4.77 |
1999 |
657877 |
63.93 |
75815 |
10.33 |
770442 |
74.87 |
40881 |
5.04 |
2010 |
577496 |
56.11 |
80381 |
12.22 |
742007 |
72.09 |
28435 |
3.69 |
2013 |
542475 |
52.71 |
35021 |
6.06 |
732513 |
71.17 |
9494 |
1.28 |
The analysis of forest fragmentation has been done to assess the spatial extent of interior forests, edge forest, etc. Temporal analyses of forest fragmentations reveal change transition with respect to all agents of influence. The fragmentation analysis was done in two stages. Stage 1 by considering only the forest cover of the region and stage 2 explains the fragmentation at landscape level. This information will provide more insights of forest cover in the region. Figure 5 (a, b,c,d,e,f) depicts the temporal pattern of forest fragmentation in Uttara Kannada district. Natural forest cover has declined from 83.17% (1973) to 52.71% (2013). Similarly Figure 6 (a, b, c, d, e, f) depicts the temporal pattern of forest and plantations in the district.
Table 3 lists the spatial extent of various types of fragments (interior, perforated, edge, transitional and patch forests) during 1973 to 2013. The analysis reveals the fragmentation evident from the decline of interior forests from 7507 sq km (1973) to 2636 sq.km (2013) and a considerable increase in other categories. Increase in the spatial extent of edge forests from 8.14% (1973) to 33.16% (2013) highlight the extent of fragmentations in the district.
Figure 5 (a) depicts the extent of forest fragmentation in 1973, the region was dominated by interior forest (87.51%) and edge forest (8.14%) was located along linear corridors, including roads, rivers and the boundary pixels of large forest patches. Patch forest is mainly located in the interfaces of forest intermixed with agriculture and urban classes over the small portions. The major disturbances noted in the forests in rural areas are due to the conversion of forest into agriculture and logging by forest based industries. The industrial sector’s exploitation peaked up in 1950’s due to industrialization and selective felling of trees in the evergreen forest reached peak in 1960’s to 1980’s period (Gadgil and Chandran, 1989). The exploitation of wood in the evergreen forest has severely affected the forest ecosystem. The selective felling of large trees created many canopy gaps in the forest, leading to the spread of invasive exotic species adversely affecting the faunal species.
Table 3: temporal changes in forest fragmentation (stage 1) from 1973 to 2013
Year |
1973 |
1979 |
1989 |
1999 |
2010 |
2013 |
Fragment type |
Ha |
% |
Ha |
% |
Ha |
% |
Ha |
% |
Ha |
% |
Ha |
% |
Patch |
3151.75 |
0.37 |
3711.73 |
0.48 |
13368.35 |
1.82 |
18043.33 |
2.74 |
15198 |
2.63 |
30618 |
5.64 |
Transitional |
17282.89 |
2.01 |
20369.03 |
2.61 |
33833.24 |
4.61 |
40884.58 |
6.21 |
35135 |
6.08 |
59435 |
10.96 |
Edge |
69841 |
8.14 |
75281.05 |
9.64 |
123490.4 |
16.83 |
168266.32 |
25.58 |
168084.9 |
29.11 |
179870 |
33.16 |
Perforated |
16869.18 |
1.97 |
18517 |
2.37 |
14150.94 |
1.93 |
11434.67 |
1.74 |
9339 |
1.62 |
8909 |
1.64 |
Interior |
750709.99 |
87.51 |
662909.2 |
84.90 |
548849.8 |
74.81 |
419248.5 |
63.73 |
349739.1 |
60.56 |
263643 |
48.60 |
Total area |
857854.81 |
780788.01 |
733692.73 |
657877.4 |
577496 |
542475 |
Table 4: temporal changes in forest fragmentation at landscape level (stage 2) from 1973 to 2013
Year |
1973 |
1979 |
1989 |
1999 |
2010 |
2013 |
Fragment type |
Ha |
% |
Ha |
% |
Ha |
% |
Ha |
% |
Ha |
% |
Ha |
% |
Patch |
3151.75 |
0.31 |
3711.73 |
0.36 |
13368.35 |
1.30 |
18043.33 |
1.75 |
15198 |
1.48 |
30618 |
2.98 |
Transitional |
17282.89 |
1.68 |
20369.03 |
1.98 |
33833.24 |
3.29 |
40884.58 |
3.97 |
35135 |
3.41 |
59435 |
5.78 |
Edge |
69841 |
6.79 |
75281.05 |
7.32 |
123490.4 |
12.00 |
168266.32 |
16.35 |
168084.9 |
16.33 |
179870 |
17.48 |
Perforated |
16869.18 |
1.64 |
18517.00 |
1.80 |
14150.94 |
1.38 |
11434.67 |
1.11 |
9339 |
0.91 |
8909 |
0.87 |
Interior |
750709.99 |
72.95 |
662909.2 |
64.42 |
548849.8 |
53.33 |
419248.5 |
40.74 |
349739.1 |
33.99 |
263643 |
25.62 |
Non-forest area |
171231.19 |
16.64 |
248297.99 |
24.13 |
295393.27 |
28.7 |
371208.6 |
36.07 |
451590 |
43.88 |
486611 |
47.3 |
Total area |
1029086 |
The figure 5 (b) shows the fragmentation status for year 1979. Interior forest has become 84.90% (1979) from 87.51% (1973) with increase in edge forests (9.64%). The major activities include industrialisation, infrastructure development, intensified agriculture, plantations. Supply of resources to industries at highly subsidised rates and permission to polluting industries in the ecologically sensitive regions has influenced the forest cover in the region. The major loss of interior forest cover and human induced disturbances to natural vegetation has become prominent during 1979 to 1989. Unplanned developmental activities such as large scale industrial and power projects - manganese mining, a ferromanganese plant, a paper mill, several irrigation projects and a series of major hydroelectric projects have led to the retreat of forest and the degradation were evident with barren hilltops. Large scale land use changes were witnessed during the period evident from the increase of paddy lands, , coconut/areca nut plantations. These activities are aggravated due to the inaction of local administration and also due to regularizing encroachments. All these resulted in the reduction of interior forest cover by 10% (from 84.90% to 74.81%). The edges and transitional patches are created more which was reached to 16.31%, 4.61%. Figure 5 (c) shows the fragmentation status for the year 1999 of Uttara Kannada district. The region has lost major portion of interior forest and reached to 63.73% with the increase in edge forests to 25.58%. Drivers of these changes are implementation of series of hydroelectric projects, Kaiga NPH (Nuclear Power House), Project Sea Bird, national highways (NH), Konkan railway line and other infrastructure projects. Tree logging is banned in 1986 to minimize the environmental impacts. However, implementation of developmental projects influenced the forest cover changes. Edge forests have immense impact on interior forests due to changes in the composition of forest cover. The figure 5 (e & f) shows the status of forest for 2010, 2013. The region has 48.60% interior forest and 26.16% of edge forests. These interior forests are already protected wither in the form of sanctuaries, protected areas or sacred grooves. Increasing demand for fuelwood is contributing towards forest degradation and fragmentation. Fragmentation analysis is done considering the entire landscape (Stage 2) to understand the status of forest and its health for a high forested district of Karnataka. This analysis has been done to gain insights of non-forest activities and its influence on interior forest cover. The figure 6 (a) reveals of the spatial extent of interior forest in 1973 is 72.95% and non-forest land use (16.64%) had moderate influence. Implementation of Supa Hydro project and conversion of grass lands and small tracts of forests to plantations apart from permitting agricultural activities in the forest area have adversely affected interior forests, evident from its decline to 64.42% (1979) with increase of area under non-forests to 24.13%.
Kans or the sacred groves of Uttara Kannada are "sacred places where trees and plants were allowed to grow undisturbed and where reptiles, birds and animals could have free living without fear of poaching or interference by man". A kan was even clear-felled and converted into a Eucalyptus plantation in Menasi village of Siddapur taluk. In 1976, the village kans of the Muroor-Kallabbe village forest panchayat, which were in excellent state of preservation, were leased out to a plywood company which extracted hundreds of logs, also creating enormous incidental damage. The operation of series of dams, other human induced activities impelled alteration of interior forests, which has reached to 53.33% and non-forest region was 28.7% by 1989. The mismanagement of Kans and reserve forests also aggravated the situation to lost interior cover. One of these kinds is allotment of 4121 Ha of Kan forests in Sirsi forest division based on Sirsi working plan (Subash Chandran, 1989). The intervention and conversion is continuing till date which is revealed by 1999, 2010 and 2013 images. The clearing of forest area for non-forest usage has increased in the last two decades. Area under non-forests has increased from 36.07% (1999) to 47.3% (2013) at the loss of interior forest, which declined to 25.63% (2013) from 40.74% (1999). Edge and perforated patches have increased indicating the loss of connectivity and interior forest patches.


Figure 7: Spatio temporal Pattern of fragmentation from 1973 to 2013 at land scape level
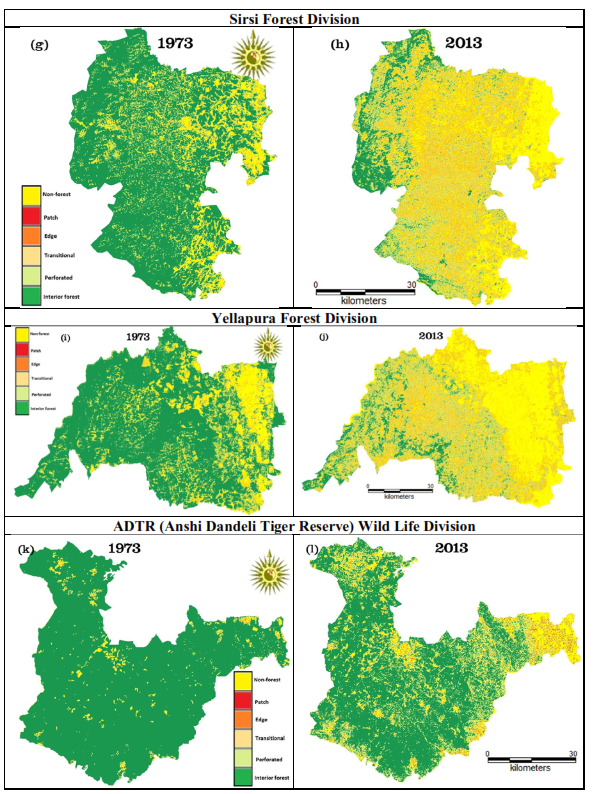
4.1 Taluk wise fragmentation analysis:
Taluks are administrative sub-divisions for the management of natural resources. The district falls in three agro-climatic zones namely coast, Sahyadri interior and plains. Hence zonewise, fragmentation of forests in each taluk was carried out for the period 1973 to 2013. The extent forest fragmentation in Ankola taluk (categorywise) is given in Table 5a and figure 8 (a, b). The interior forest in this coastal taluk has declined from 78.19% (1973) to 45.19% (2013), while area under edge has increased from 6.5% to 17.63%. The non-forest cover land use constitutes 30.17% of the landscape. Drivers of these changes are monoculture plantations of exotic species, coconut plantations in Bedthi river valley, encroachments for areca and crop lands and NH63- national high way. The new proposed industrial estates, widening the existing NH-63 will further erode forests.
Figure 9 (a, b) and table 5(a) presents the forest fragmentation status of Bhatkal taluk. Interior forest has changed from 58.97% (1973) to 22.89% (2013)) with an increase of edge forests from 9.58% to 19.36%. Drivers here are increasing population and associated agricultural activities and logging for fuel wood. Konkan railway line has bisected continuous interior forest. Intensified plantation activities to meet the fuel; wood demand are causal factors for the decline of natural forest cover. Weeds Lantana camara,Chromolaena odorata have occupied canopy gaps, road edges, etc. restricting the natural regeneration. Similar problem is observed in all taluks of the district.
Figure 10 (a, b) and table 5 (a) highlight the forest fragmentation in Honnavar taluk. Interior forest has declined from 63.76 (1973) to 18.82% (2013), non-forest region covers 46.72% of the taluk with half of interior forests have been converted to edge forests. Drivers of these changes are construction of dams and conversion of forests to agriculture and horticulture. Due to availability of water, many individuals who were affected during the construction of dams have returned and occupied forest patches in the taluk.
Karwar taluk with thick forest cover is the part of conservation reserve (Anshi-Dandeli Tiger Reserve, ADTR). Figure 11 (a, b) and table 5 (a) highlight the decline of interior forest from 73.42 (1973) to 47.60% (2013) with edge forests incresing from 7.82% to 18.97%. The taluk has witnessed many major developmental projects (Nuclear power project, Project Seabird, major industries, etc.) and inappropriate management have lead to imbalnces in the ecosystem, evident from series of landslides in the district. This necessitates comprehensive land use management with restoration of ecosystesms to mitigate the impacts.
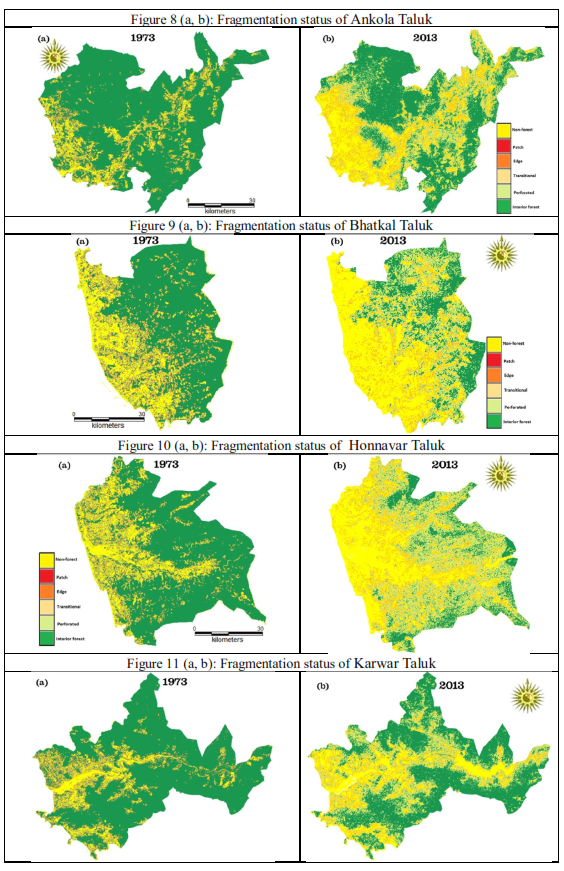
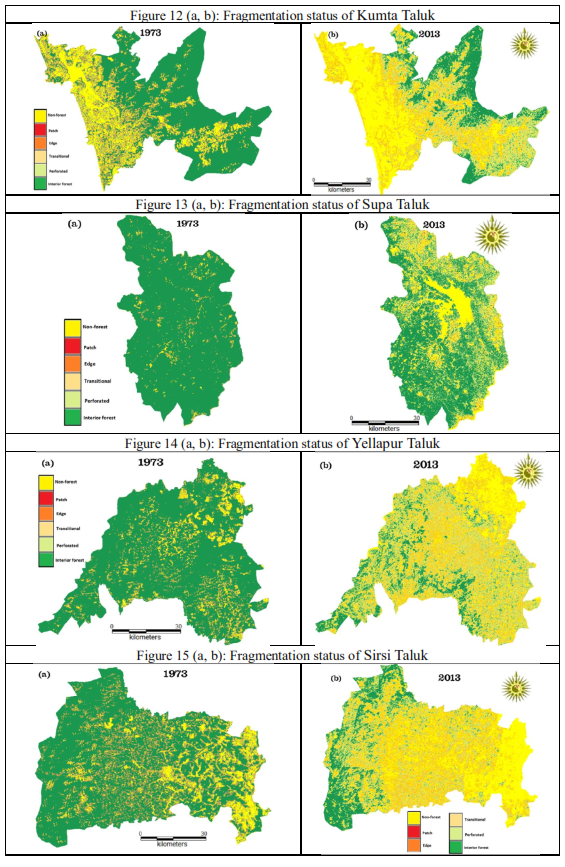
Forest fragmentation analysis in Kumta taluk (figure 12 (a, b) & table 5 (a)) reveals the decline of interior forests from 58.70 (1973) to 21.46% (2013) and increase of edge forests from 9.39% to 17.48% due to intensive human pressure. The fuel wood requirement in many parts of the taluk is leading to deforestation in many forest patches.
Supa taluk has highest interior forest cover among the other taluks in the district. The interior forest in the district (figure 13 (a, b), table 5 (b)) has declined from 92.64% (1973) to 51.59% (2013) and the edege forests has increased from 1.87% to 23.45%. Supa hydro electric project, Kaneri dam, mining activties have impcated the forest in this region. The more edge forest is due to manifestation of conversion from forest to other cover types, which includes agriculture, matchwood plantations, softwood plantations by the forest department. Vast expanse of teak plantations in Joida taluk (Chandwadi Jugalbet etc) and recent acacia plantations have significantly contributed to the changes in the forest.
Yellapur taluk is at the center of Uttara Kannada district, and forests have been experiencing dynamic changes (figure 14 (a, b), table 5 (b)), evident from the reduction of interior forests from 82.68% (1973) to 17.08% (2013). The intensification of plantation and developmental projects, infrasturture projects have contributed to the retreat of forests in the regtion. Edge forest patches are increased in the region due to the national highway NH-63 (bisecting continuous forest) and conversion of many forest patches to agriculture and coconut plantaions. The Kaiga nuclear power transmission lines are another major driver changing the interior forest cover and the same phenomenon can be observed in Sirsi and Haliyal taluks.
Figure 15 (a,b) and table 5(b) highlight the decline of interior forest from 67.42 (1973) to 17.58% (2013) and increase of edge forests to 16.79% reflecting fragmentation of forests in Sirsi taluk. Drivers of these changes are encroachment of forests and conversion to plantataions, agriculture fields and built-up areas. Area under non-forest cover is about 52.85%. Shift to water-intensive commercial crops in the downstream of Bedthi river and increase of plantations with decline of subsistence food crops (paddy and pulses) is noticed in the region. Growing demand for commercial crops (sugarcane, vegetables, oilseeds, etc) is forcing expansion and intensification of irrigated areas by removal of forest trees and diversion of water course.
Forest fragmentation dynamics of Siddapur taluk given in figure 16 (1,b) and table 5 (b) show the decline of interrior forests from 79.43 (1973) to 8.93% (2013) and increase of edge from 7.10 (1973) to 24.71% (2013). Forest encroachments and onversion to agriculture, plantations are the prime reasons for degradation. Reserved forests have also seen changes due to diversion of land for hospitals, primary schools, bus stops, etc. Many of the plantations have come up in the valleys by converting the natural vegetation, some times even the ecologically important ecosystems - Myristica swamps (Chandran and Mesta 2001). It is well documented of encroached for mulching material evident from the presence of dominant species Hopea ponga in some kans.
Haliyal taluk located in the eastern part of the district, experienced large scale forest transitions 63.65% of interior forest in 1973 reduced to 1.22% (2013), which is depicted in figure 17 (a,b) and table 5 (c). Intensive plantation activities were taken up to meet raw material requirements for West coast paper mill at Dandeli in Haliyal taluk. The construction of new roads, conversion of forests for agriculture and plantations have affected the forest ecosystem. Area under non-forests is 80.32% and 2nd highest among all taluks. Availabiliy of water due to hydro electric reservoir have enhanced the agricultural activities. projects are also showing immense effcet on this region.
The interior forest in Mundgod taluk has reduced 1.43% (2013) from 43.60% as as shown in figure 18 (a, b), table 5 (c). This taluk has highest area under (87.42%) non-forests Weeds such as Lantana camar, Chromolaena odorata are seen growing prolifically in many places.
Table 5 (a): temporal changes in forest fragmentation from 1973 to 2010 for Coastal taluks
Taluk |
ANKOLA |
BHATKAL |
HONNAVAR |
Year |
1973 |
2013 |
1973 |
2013 |
1973 |
2013 |
Ha |
% |
Ha |
% |
Ha |
% |
Ha |
% |
Ha |
% |
Ha |
% |
Non forest |
10649.93 |
11.60 |
27706.98 |
30.17 |
8802.65 |
25.22 |
17628.05 |
50.51 |
16779.03 |
22.11 |
35455.54 |
46.72 |
Patch |
214.95 |
0.23 |
2242.63 |
2.44 |
189.66 |
0.54 |
785.41 |
2.25 |
372.12 |
0.49 |
1747.83 |
2.30 |
Transitional |
1513.77 |
1.65 |
3675.58 |
4.00 |
1080.17 |
3.09 |
1472.15 |
4.22 |
2136.58 |
2.82 |
3998.95 |
5.27 |
Perforated |
1689.03 |
1.84 |
522.00 |
0.57 |
903.83 |
2.59 |
267.51 |
0.77 |
1918.29 |
2.53 |
570.12 |
0.75 |
Edge |
5965.95 |
6.50 |
16187.29 |
17.63 |
3342.67 |
9.58 |
6758.29 |
19.36 |
6296.58 |
8.30 |
19830.07 |
26.13 |
Interior |
71809.25 |
78.19 |
41507.70 |
45.19 |
20583.29 |
58.97 |
7990.87 |
22.89 |
48381.23 |
63.76 |
14281.30 |
18.82 |
TOTAL |
91842.88 |
34902.27 |
75883.82 |
Taluk |
KARWAR |
KUMTA |
Year |
1973 |
2013 |
1973 |
2013 |
Ha |
% |
Ha |
% |
Ha |
% |
Ha |
% |
Non-forest |
10995.65 |
14.86 |
20219.30 |
27.33 |
14597.68 |
24.91 |
30507.26 |
52.07 |
Patch |
313.97 |
0.42 |
1047.84 |
1.42 |
374.55 |
0.64 |
1832.21 |
3.13 |
Transitional |
1351.47 |
1.83 |
2769.50 |
3.74 |
1997.41 |
3.41 |
3068.77 |
5.24 |
Perforated |
1219.69 |
1.65 |
695.08 |
0.94 |
1726.74 |
2.95 |
368.39 |
0.63 |
Edge |
5784.58 |
7.82 |
14031.78 |
18.97 |
5502.65 |
9.39 |
10240.64 |
17.48 |
Interior |
54316.54 |
73.42 |
35218.40 |
47.60 |
34393.22 |
58.70 |
12574.98 |
21.46 |
TOTAL |
73981.90 |
58592.25 |
Table 5 (b): temporal changes in forest fragmentation from 1973 to 2010 for Sahyadri Interior
Taluk |
SUPA |
SIDDAPUR |
Year |
1973 |
2013 |
1973 |
2013 |
Ha |
% |
Ha |
% |
Ha |
% |
Ha |
% |
Non-forest |
9225.53 |
4.78 |
38984.93 |
20.19 |
8928.14 |
10.48 |
42596.70 |
49.98 |
Patch |
75.79 |
0.04 |
1881.65 |
0.97 |
141.23 |
0.17 |
3599.65 |
4.22 |
Transitional |
564.66 |
0.29 |
5918.70 |
3.07 |
996.01 |
1.17 |
9261.69 |
10.87 |
Perforated |
742.53 |
0.38 |
1395.40 |
0.72 |
1416.28 |
1.66 |
1101.69 |
1.29 |
Edge |
3607.40 |
1.87 |
45274.22 |
23.45 |
6054.98 |
7.10 |
21060.08 |
24.71 |
Interior |
178812.83 |
92.64 |
99610.12 |
51.59 |
67693.00 |
79.42 |
7609.83 |
8.93 |
TOTAL |
193028.74 |
85229.64 |
Taluk |
SIRSI |
YELLAPURA |
Year |
1973 |
2013 |
1973 |
2013 |
Ha |
Ha |
% |
Ha |
% |
Ha |
% |
Ha |
Non-forest |
21562.50 |
16.25 |
70132.85 |
52.85 |
11136.54 |
8.50 |
55683.42 |
42.50 |
Patch |
540.08 |
0.41 |
5931.00 |
4.47 |
417.58 |
0.32 |
4321.38 |
3.30 |
Transitional |
2817.44 |
2.12 |
9849.54 |
7.42 |
1500.54 |
1.15 |
11948.63 |
9.12 |
Perforated |
2370.25 |
1.79 |
1186.33 |
0.89 |
1302.50 |
0.99 |
2033.87 |
1.55 |
Edge |
15941.59 |
12.01 |
22279.30 |
16.79 |
8338.37 |
6.36 |
34663.60 |
26.45 |
Interior |
89472.30 |
67.42 |
23325.14 |
17.58 |
108336.37 |
82.68 |
22381.00 |
17.08 |
TOTAL |
132704.16 |
131031.90 |
Table 5 (c): temporal changes in forest fragmentation from 1973 to 2010 for plain
Taluk |
HALIYAL |
MUNDGOD |
Year |
1973 |
2013 |
1973 |
2013 |
Ha |
% |
Ha |
% |
Ha |
% |
Ha |
% |
Non-forest area |
20256.23 |
23.92 |
68009.67 |
80.32 |
25526.83 |
38.00 |
58607.23 |
87.24 |
Patch |
171.84 |
0.20 |
4750.98 |
5.61 |
559.98 |
0.83 |
2261.64 |
3.37 |
Transitional |
1947.28 |
2.30 |
5107.37 |
6.03 |
2137.17 |
3.18 |
2091.67 |
3.11 |
Perforated |
2043.41 |
2.41 |
343.05 |
0.41 |
2123.25 |
3.16 |
348.12 |
0.52 |
Edge |
6356.98 |
7.51 |
5427.71 |
6.41 |
7543.10 |
11.23 |
2908.72 |
4.33 |
Interior |
53897.07 |
63.65 |
1034.02 |
1.22 |
29289.42 |
43.60 |
962.17 |
1.43 |
TOTAL |
84672.80 |
67179.75 |

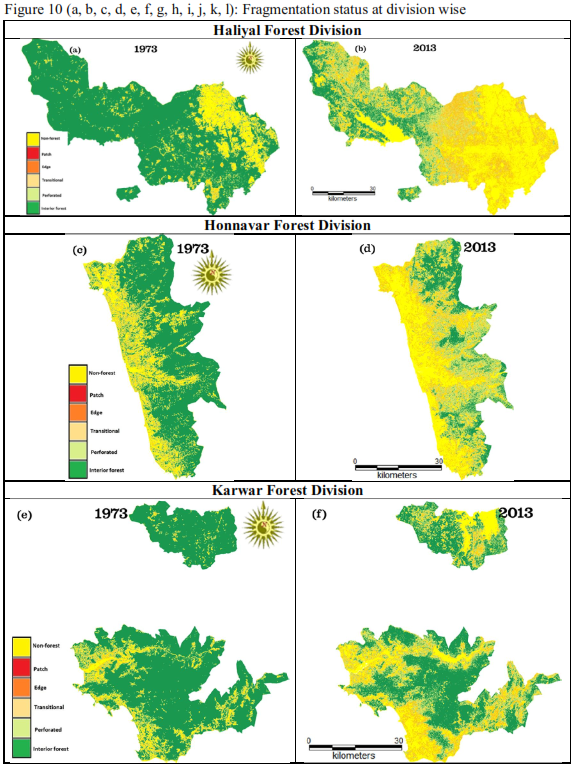
4.2 Forest Divisionwise Fragmentation Analysis:
Division wise fragmentation of forests have been analysed to understand the status of forests under different jurisdictions of Uttara Kannada. The total forest area of the district is 8296.4569 km2, (as per the legal status) including areas released for various non-forestry activities and recent orders of regularization of encroachment. The total geographical area of the district is 10,291.00 km2. The forest area under the control of the Forest Department is 7759.794 km2 (93.53% of the total forest area). The forest area under revenue and other departments is 536.66 km2. Uttara Kannada forest region is administered under Kanara circle. Kanara Circle comprises of 5 Territorial Forest Divisions (Table 6a), a Wild Life Division and one Social Forestry Division (Karwar Social Forestry division) (Figure 9). Each division is further divided into subdivisions for effective management.
Table 6a: taluks under various forest divisions in Kanara Circle
Forest Divisions |
Taluks |
Haliyal forest division |
Haliyal, part of Supa taluk |
Honnavar forest division |
Ankola, Kumta, Honnavar, Bhatkal |
Karwar division |
part of Ankola, Karwar, part of Supa taluk |
Sirsi division |
Sirsi, Siddapura |
Yellapur division |
Yellapur, Mundgod taluks |
Dandeli wild life division |
major portion of Supa taluk |
Taable 6b provides the spatial extent of each forest types as per legal status. These divisions harbours varitites of flaora and fauna. The minor forest areas are marked and left as a right and privilege for the people. Betta lands (lands alloted for open collection of resources for the farmers) are set apart to provide litter and other resources to support arecanut cultivation,. Betta lands are supposed to be managed through joint forest mangement framework, but present status depicts poor conditions in the district. Hakkals are areas set apart for shifting cultivation and shifting cultivation practice is no longer in vogue. The exotic plantations started in the forest area of this circle as back as 1865-66. The cumulative effect of these introduction visualised earlier in land use and fragmentation analysis at landscape level.
Table 6b: Forest cover in Uttara Kannada district as per legal status
Sl. No. |
Department (as per legal status) |
Type of Forest |
Area (in Sq. Km) |
1 |
Forest |
Reserved Forest |
7727.712 |
Protected Forest |
31.644 |
Village Forest |
---- |
Un-classed |
0.438 |
Total |
7759.794 |
2 |
Revenue |
Reserved Forest |
----- |
Protected Forest |
510.485 |
Village Forest |
26.177 |
Un-classed |
---- |
Total |
536.662 |
Grand total |
8296.456 |

Figure 9: Forest division map of Uttara kannada district
4.2.1 Haliyal Forest Division: Haliyal forest division located between 140 58’ 34” to 150 31’ 16” N and 740 4’ 52” to 740 29’ 52” E comprising Haliyal, Bhagavati, Sambrani, Dandeli, Virnoli, Kulgi, Barchi, Jagalbet, Tinneghat and Gund Ranges. Forest types include broadly tropical wet evergreen forest to semi evergreen forests, moist deciduous forests, tropical dry deciduous forests. Figure 10(a and b) and Table 7 depicts the forest status during 1973 and 2013. The region had 77.78% of interior forests and only 14.31% area was under non-forest (table 7). The dense interior forests were lost due to construction of series of dams on river Kali and some area was replaced for plantaions. Current spatial extent of interior forests is about 18.8%, which is mostly concentrated in Supa taluk part and Kali river valley regions.
In certain places of forest area, widening or creation of road works were noticed without obtaining clearance under FC Act 1980 (KFD, 2009). The Kaiga power grid lines have bisected thick tracts of intrior forests and formed additional edges. Cultivation areas grew up taking mainly dry forest areas which represent a general loss due to the changes to dry forest, grassland, and shrub-type vegetation. At the same time, abandonment of agricultural zones can be observed. These decreases can possibly be attributed to different socio-economic factors such as the limited availability of water resources, high production costs and migration.
Table 7: Haliyal Forest Division |
Year |
1973 |
2013 |
Ha |
% |
Ha |
% |
Non-forest |
21,306.25 |
14.31 |
88,503.14 |
59.44 |
Patch |
176.27 |
0.12 |
5299.76 |
3.56 |
Transitional |
2070.44 |
1.39 |
7841.99 |
5.27 |
Edge |
2265.11 |
1.52 |
4094.17 |
2.75 |
Perforated |
7259.46 |
4.88 |
15,159.10 |
10.18 |
Interior forest |
115,816.97 |
77.78 |
27,996.34 |
18.80 |
Total |
148,894.50 |
4.2.2 Honavar Forest Division: This division with 1490 Km2 forest area located between 130 56’15” to 140 41’15” N and 740 26’0” to 740 46’20” E on the west Coast with three sub divisions at Kumta, Honavar and Bhatkal. This division has thick evergreen forests, moist deciduous forests and many medicinal plants. Eventhough heavy human pressure exists, the region is still having rich biodiversity due to major rivers Gangavalli, Agnanashini, Sharavati and innumerable streams which flows from Ghats to Arabian sea. The region had 62.84% area under interior forests, 21.35% under non-forest cover (figure 10 (c, d)). The intensification of commercial plantations and exotic plantaions hhave led to the decline of inerior forests. Now the interior forests accounts to 23.14% with the increase in non-forest land and the current spatial extent constitute about 46.76% (table 8). Forest perforations (21.62%) highlight the conversion of forest to fram-lands or plantaions. The survival percentage of forest plantations is significantly lower due to weeds, bushes, vegetation and rocky out crops in certain regions. The rehabilitations of evacuees of Sharavathi and other dams has affected interior forests and created more edges and perforations. Effort by VFC’s (Village forest committees) have contributed to the success of afforestation programmes.
Table 8: Honnavar Forest Division |
Year |
1973 |
2013 |
Ha |
% |
Ha |
% |
Non-forest |
41,098.01 |
21.35 |
90,019.05 |
46.76 |
Patch |
992.86 |
0.52 |
4829.35 |
2.51 |
Transitional |
7174.54 |
3.73 |
9406.11 |
4.89 |
Edge |
5630.08 |
2.92 |
2084.55 |
1.08 |
Perforated |
16,654.86 |
8.65 |
41,629.45 |
21.62 |
Interior forest |
120,975.65 |
62.84 |
44,557.49 |
23.14 |
Total |
192,526.00 |
4.2.3 Karwar Division: Karwar division is located within 140 35’54” to 150 17’18” N and 740 5’10” to 740 42’18” E, with thearea under forets about 1446 Km2. Karwar, is the district head quarter of Uttara Kannada having greater population pressure on forest for resources. The forests in the region are mainly evergreen to semi evergreen type, moistdeciduous cover also present in certain pockets. Like Honnavar forest division, this division also has coastal area and Ghats portion. High percentage of forest cover exists in the Sahyadri mountain ranges and also in the coastal areas. Most of the forests are under protected forests area status. The division had 79.99% of inerior forest and only 11% under non-forest cover (figure 10 (e, f)). The urbanisation followed by industrialisation led to loss of interior covrerage. The plantations also agravated the situation to reach interior forest by 48.07% in 2013 (table 9). The execution of series of dams, power plants, novel base projects are responsible for decline of inerior forests.
The Sirsi division is located between 140 12’ and 140 51’ N, 740 34’ and 750 4’ E and comprises of evergreen to semi evergreen, moist deciduous, dry deciduous forests cover type. The division is having topographically undulating terrain in the west and turn out to be plains on east. The forest division covers Sirsi, Siddapur towns and villages. This division is having unique feature among the other divisions, consisting Dharma and Varada rivers drain flowing towards the eastern region; Aghanashini, Bedthi, Sharavathi flowing towards the western region. About 40650 Hectare forest land is alloted as Betta land to support farmers for their garden requirements. The interior forest cover in 1973 was 72.5% and non-forest land use was only 13.5% (table 10). The market based agriculture practise encouraged the conversion of forest land for commercial plantrations, and the current (2013) spatial extent of area under non-forests is 52.12% ( figure 10 (g, h)). The betta lands have degraded due to over exploitation and poor maintainence. Forest perforations (19.89%) are mainly due to conversion of forest to agriculture inside the interior forests. The diversion of streams also led to removal of trees in swampy regions of Siddapur taluk for agriculture and gardens worsen the situation in recent times. All these cumulative pressures are evident as the current spatial extent of interrior forests is about 13.83%.
Table 9: Karwar Forest Division |
Year |
1973 |
2013 |
Ha |
% |
Ha |
% |
Non-forest |
20,879.35 |
11.00 |
53,657.93 |
28.27 |
Patch |
501.29 |
0.26 |
3225.48 |
1.70 |
Transitional |
2658.93 |
1.40 |
6879.07 |
3.62 |
Edge |
2601.77 |
1.37 |
2032.03 |
1.07 |
Perforated |
11,340.16 |
5.97 |
32,782.59 |
17.27 |
Interior forest |
151,827.20 |
79.99 |
91,231.60 |
48.07 |
Total |
189,808.70 |
Table 10: Sirsi Forest Division |
Year |
1973 |
2013 |
Ha |
% |
Ha |
% |
Non-forest |
29,600.06 |
13.50 |
114,256.96 |
52.12 |
Patch |
688.52 |
0.31 |
9565.45 |
4.36 |
Transitional |
3890.08 |
1.77 |
19,173.99 |
8.75 |
Edge |
3818.55 |
1.74 |
2298.78 |
1.05 |
Perforated |
22,100.44 |
10.08 |
43,598.78 |
19.89 |
Interior forest |
159,122.87 |
72.59 |
30,326.56 |
13.83 |
Total |
219,220.52 |
4.2.4 Yellapur Division: Yellapur division lies between 140 44’ to 150 7’ N and 740 25’ to 750 6’ E with the geographical area of 187,304 Ha, is surrounded by Honnavar, Karwar and Sirsi divisions and on the eastern side by Dharwad Division. This division also also consisti of Betta lands of 1,65,458 Ha to encourage garden farmers like in Sirsi division. The intensified plantation activities and regularising of eearlier encrochments have affected the interior forests which has declined from 71.18 (1973) to 17.59% in 2013 (table 11). Non-forest land use cover has reached to 50.20% of landscape (figure 10 (i, j). The plantations of Acacia auriculiformis; Tectona grandis in moist deciduous and dry deciduous tracks of Mundgod and Kirwatti have registered high survival rate as compared to other ranges have encouraged the forest department to replace the natural regions like grassy blanks and open patches, irrespective of rainfall, depth of the soil by plantations. The dry forest areas were initially occupied by shrub-type vegetation, and grasslands which were converted to other land uses. The majority of changes have happened in the regions that are in contact with human habitations. This is major reason for loss of coonctivity and shrinkage of interior forests. To cope up with the situation, efforts have been taken by the Forest Department to increase the forest and tree cover through promotion of social forestry, farm forestry, agro forestry, community forestry and afforestation on wasteland, panchayt land, private lands, etc. outside the notified Forest area.
Table 11: Yellapura Forest Division |
Year |
1973 |
2013 |
Ha |
% |
Ha |
% |
Non-forest |
29981.34 |
16.01 |
94,026.75 |
50.20 |
Patch |
1035.09 |
0.55 |
6643.94 |
3.55 |
Transitional |
3789.64 |
2.02 |
14,029.24 |
7.49 |
Edge |
3387.05 |
1.81 |
2366.32 |
1.26 |
Perforated |
15795.23 |
8.43 |
37,294.57 |
19.91 |
Interior forest |
133315.65 |
71.18 |
32,943.18 |
17.59 |
Total |
187,304.00 |
4.2.5 ADTR (Anshi Dandeli Tiger Reserve) wild life division consists of Dandeli Wild Life Sanctuary and Anashi National Park. The entire region has lush green cover and harbours rich and diverse flora and fauna. The forests of Dandeli Wild Life division area has mainly evergreen to semi evergreen and moist deciduous in nature. It is the only Wild Life division in Kanara Circle (declared in 4-01-2007). The revised management plan, for the period of 2008 to 2018 has now been prepared and is under implementation. The region had 94.05% area under interior cover (1973) and due to mangement plans of plantations the current interior cover is about 66.18% (table 12). The easter part of ADTR has inflence of Haliyal taluk’s villages. Plantations activities in protected area have altered the composition of species. Apart from continuous monitoring, socio-economic survey and bio-diversity survey are also required to be taken up at periodic intervals for knowing the impact of existing activities and status of conservation and development of the forest resources.
Table 12: ADTR wild life Division |
Year |
1973 |
2013 |
Ha |
% |
Ha |
% |
Non-forest |
2489.88 |
2.69 |
10,841.49 |
11.73 |
Patch |
63.28 |
0.07 |
1086.2 |
1.17 |
Transitional |
479.59 |
0.52 |
2854.44 |
3.09 |
Edge |
371.4 |
0.40 |
613.72 |
0.66 |
Perforated |
2096.97 |
2.27 |
15,869.59 |
17.17 |
Interior forest |
86,950.00 |
94.05 |
61,185.68 |
66.18 |
Total |
92451.12 |