|
|
ENVIS Technical Report 136, January 2018 |
CARRYING CAPACITY OF NETRAVATHI RIVER BASIN BASED ON THE ECOLOGICAL SENSITIVENESS
|
4.1 Land use analysis:
The forests of Netravathi river basin with the repository of rich biodiversity has been supporting the livelihood of people in the districts of Central Western Ghats. The land use analysis of Netravathi river basin depicts the status of forest cover during the year 2016 (Figure 12 and Table 1). The area under forest cover shows 51.67 % after losing significant patch of forests for mini-hydroelectric, infrastructure projects and monoculture plantations. The plantations constitute 26.42 % of the basin and major forests are confined to the eastern side of the basin (Figure 13). The market interventions in agriculture (through commercial plantations) have resulted in the loss of cropland as well as encroachment of forests. Large tracts of forests were replaced with exotic species of monoculture plantations such as acacia, eucalyptus, rubber and teak etc.. Land conversion is major problem noticed i.e. conversion of forest to agriculture; agriculture to coffee/coco/areca nut plantations. The western portion of the basin is dominated by agriculture and plantations and built-up cover. More edges reveals loss of connectivity and largest forest patches and are prevalent due to anthropogenic interventions in the landscape,. The entire basin is a habitat for key species such as tigers and elephants. The accuracy of classification has been verified with sample data collected from the field and online spatial data (Google earth). The overall accuracy of classification is 89 %.
Table 1: Land use information of Netravathi basin.
SNO |
CATEGORY |
DESCRIPTION |
Ha |
% |
1 |
FOREST |
Evergreen forests, deciduous forest, degraded forests, scrublands, Soppina betta |
224900 |
51.67 |
2 |
PLANTATIONS |
Horticulture and Forest plantations |
115010 |
26.42 |
3 |
AGRICULTURE |
Current Sown and Fallow Agricultural lands |
21800 |
5.01 |
4 |
BUILT-UP |
Buildings, Roads and paved surfaces |
9410 |
2.16 |
5 |
OTHERS |
Open area, Grasslands, Riverbed, Sand, Quarries, Cloud and Shadow |
61030 |
14.02 |
6 |
WATER |
Rivers, Lakes, Ponds, Estuary |
3150 |
0.72 |
TOTAL AREA |
435300 |
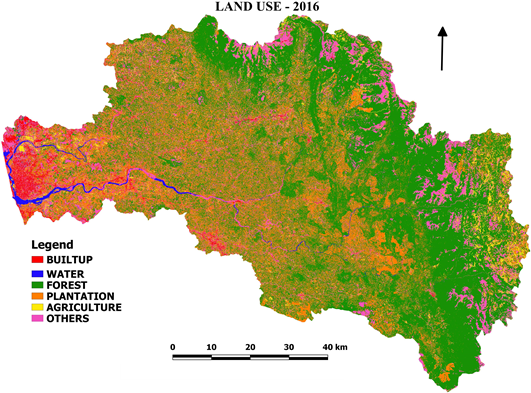
Figure 12: Land use analysis of Netravathi river basin.
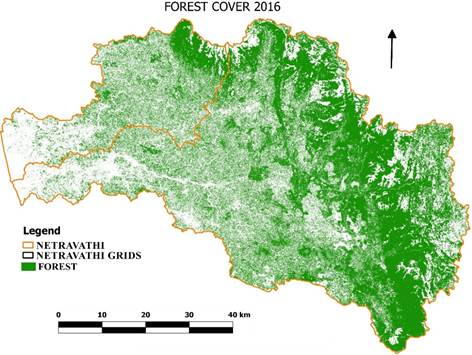
Figure 13: Forest cover of Netravathi Basin.
4.2 Ecological Sensitive Regions (ESR) of Netravathi River Basin:
ESR demarcation provided a detailed picture of Netravathi River basin across various themes through multi sector datasets. The various themes are selected and evaluated based on literature and field measurements. Themes considered are: Land, Ecology, Geo-climatic, Hydrology, Social and Estuarine diversity, which are discussed in the following subsections.
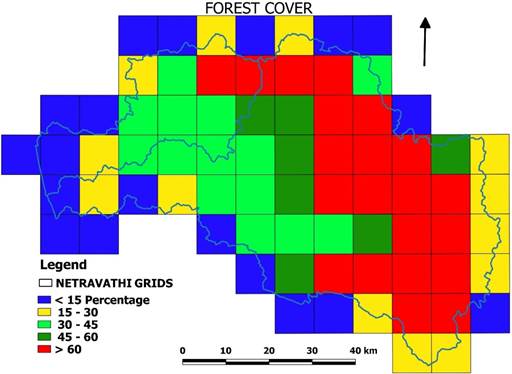
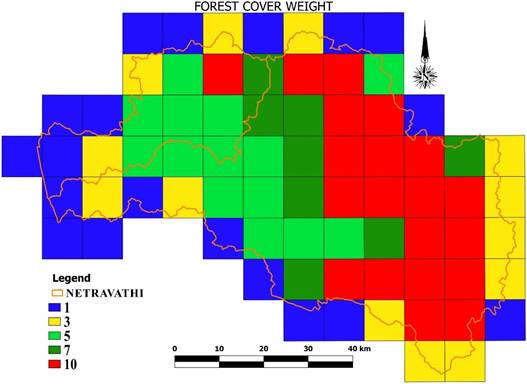
Land: Land use analysis provided the spatial extent and the present status in the basin (Figure 14). The forest cover of the basin was considered to understand the connectivity, extent of fragmentation and ecological functionalities. The eastern portion represents good forest cover as compared to the west. The greater forest cover is represented by grids of Kumara Parvatha, Gundia, Kudremukh National Park (KNP) region. The forest cover weightages (Figure 15) shows higher, moderate ranking is observed in eastern grids. The cultivation in the nearby plots and roads are badly affecting natural cover. The higher intact forest can be seen in grids of KNP, Gundia region, and were assigned higher weights.
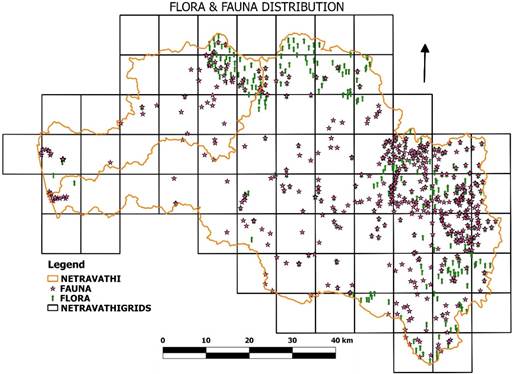
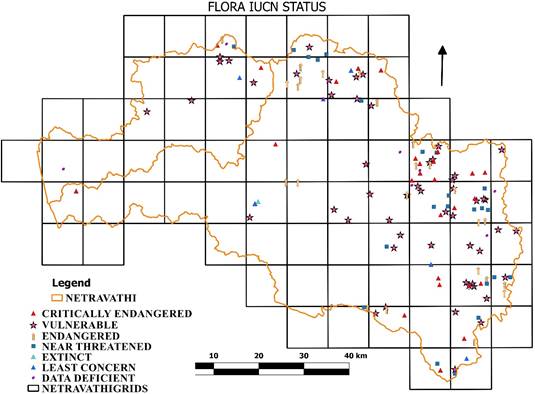
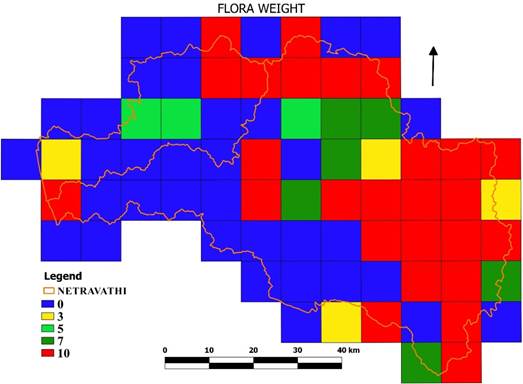
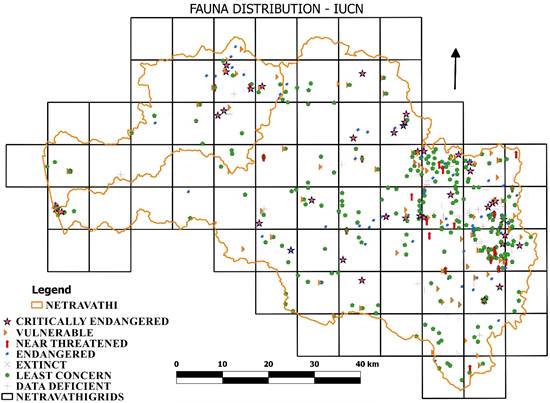
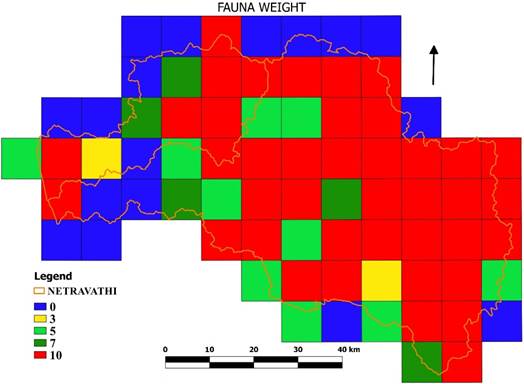
Ecology: The ecology of Netravathi River basin is analyzed by variables explaining biodiversity such as endemic taxa (flora and fauna), the status of conservation reserves, elephant movement path etc., using field data and also the data compiled from published literatures. A detailed database of flora and fauna has been developed which includes occurrence (latitude, longitude), species name, family name, International Union for Conservation of Nature (IUCN) status, data source, protection etc., and Figure 16 depicts the distribution pattern of these taxa. Figure 17 and 18 depicts flora categorised as per IUCN status and its relative weightages (Annexure A; B) in grids. The flora database has 762 entries covering 429 flora species in 95 families. The basin has good distribution of endemic, critically endangered and threatened species such as Actinodaphne malabarica, Aglaia canarensis, Aglaia lawii, Artocarpus hirsutus, Calophyllum apetalum, Cinnamomum sulphuratum, Garcinia indica, Kingiodendron pinnatum, Madhuca insignis, Myristica malabarica, Syzygium travancoricum, Vateria indica, Hopea parviflora, Hopea ponga and Knema attenuate etc., The region is home to many very rare, endemic and endangered wildlife (Figure 19). The faunal database has 864 entries covering 418 species under 126 families. Main predators are tiger (Panthera tigris), leopard, wild dog (dhole) and sloth bear. Leopards are in good number and wild dogs are in very less number, usually sighted in KNP region and Gundia basin. Prey animals are barking deer, spotted deer (Axis axis), wild boar, sambar (Cervus unicolor), gaur (Bos gaurus). One can also find Lion-Tailed Macaque (Macaca silenus), Malabar Giant Squirrel, Slender Loris etc. Some of the important birds are Malabar Parakeet, Malabar Trogon, Malabar Pied Hornbill, Malabar Grey Hornbill, Indian Grey Hornbill, Great Indian Hornbill, Emerald Dove, Ceylon Frog mouth, Indian Paradise-flycatcher etc. There are a wide variety of snakes i.e., King Cobra, Cobra, Malabar Pit Viper, Hump-nosed pit Viper, Bamboo Pit Viper, Kraft, Ornate flying snake, wolf snake etc. There is also a wide variety of butterflies found in the reserve. Some of them are Crimson Rose, Common Rose, Leaf, Clipper, Tigers, Southern Bird wing, Cruiser etc. So, higher weightages (10) are assigned to grids (Figure 20) covering all endemic, critically endangered, threatened species and least were given as 3 for Least concern category of fauna.
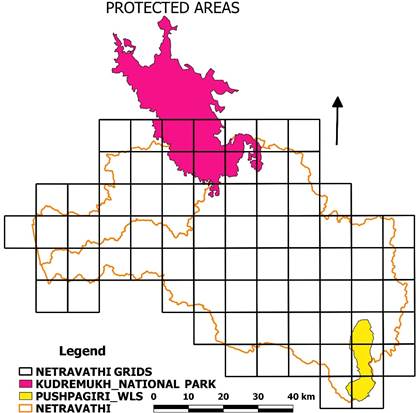
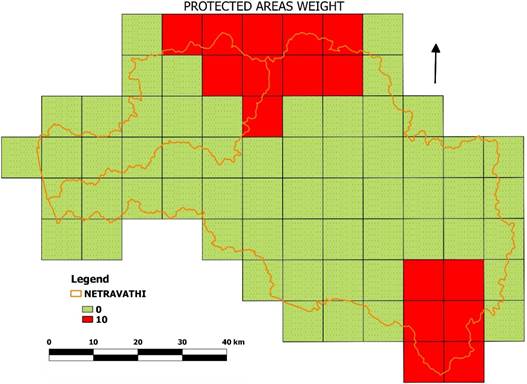
The conservation area or protected area are considered as crucial regions in ESR delineation. The basin has large tracts of forest protected under Kudremukh National Park, Pushpagiri Wildlife Sanctuary (PWLS) (Figure 21). KNP is administered and protected as NP from 1987 under the Karnataka Forest Act 1963, Karnataka Forest Rules 1969 and Wildlife Act 1972. KNP is spread over an area of 563 km2. And falls in three districts namely, Dakshina Kannada district (158 km2), Udupi district (89 km2) and Chikmagalur district (316 km2). There are four forest ranges - Belthangadi, Karkala, Kerekatte and Kudremukh. There are two forest sub-divisions: Kudremukh and Kundapur, which contribute to the area of the national park. The Lion-Tailed Macaque (LTM) considered ‘flagship’ species occur in this region and conserving their habitats helps in conserving wildlife population in the region (Change, 2013). KNP is aiding as repository of rich biodiversity reserve with several endangered and globally significant wildlife species like the tiger (Panthera tigris), Malabar civet (Viverra civettina), Leopard (panthera pardus), Wild dog (Cuon alpinus), Sloth bear (Melurus ursinus) Flying Lizard (Draco dussumieri), Flying Snake (Chrysopelea ornata), King Cobra (Ophiophagus hannah), Shield Tail Snakes (Uropeltidae spp.), Travancore Tortoise (Indotestudo jorsteni), Forest Cane Turtle (Geoemyda silvatic) and possibly several of which are endemic to the area. There are about 200 species of birds, 30 species of reptiles, 100 species of butterflies and moths, and 50 species of fish found in KNP. KNP comes under the Global Tiger Conservation Priority-I, under the format developed jointly by Wildlife Conservation Society (WCS) and World Wide Fund-USA.
Pushpagiri Wildlife Sanctuary (PWLS) is located in Somwarpet taluk of Kodagu district, Karnataka. PWLS adjoins Bisle reserve forest to the north and Kukke Subramanya forest range to the west. PWLS was declared vide notification number AHFF. 173 FWL. 87(11) dated 2nd September 1987. The final notification was issued on No.FEE.57 FWL. dated 13th June 1994. The topography of PWLS is dominated by steep terrains (160-1712 m) with waterfalls, swampy areas and streams. The rivers Lingadaholé, Kumaradhara, Marigundholé and Uppangalholé flows through the sanctuary and acting as lifeline for the downstream population by the maintenance of ecological balance and soil and moisture conservation. It has dense evergreen and semi-evergreen vegetation, with shola forests and grasslands in areas of higher elevation. It is one of the largest tropical evergreen forests in Karnataka with nearly 70% of the sanctuary covered with evergreen forests. The flora includes Artocarpus integrifolia, Artocarpus hirsuta, Artocarpus fraxinifolius, Alstonia scholaris, Calophyllum elatum, Calophyllum inophyllum, Calophyllum apetalum, Cedrella toona, Poeciloneuron indicum, Mesua ferrea, Palaquium ellipticum, Dipterocarpus indicus, Hardwickia binata, Vateria indica, Canarium strictum, Adina cardifolia, Syzigium cuminii, Lagerstromia lanceolate, Caryota urens, Antiaris toxicaria, Trewia nudiflora, Eugenia gardneri, Emblica officinalis, Terminalia peniculata, Terminalia chebula, Terminalia chebula, Terminalia belerica, Lagerstromia lanceolata, Xylia xylocarpa, Terminalia tomentosa, Diopyros species, Ficus species, Albezzia species and Anthocephalus cadamb, etc. PWLS is rich in fauna, which includes Asian Elephant, Lion-Tailed Macaque, Indian Wild Dog, Brown Palm Civet, Indian Giant Squirrel, Indian Hare, Spotted Deer, Sambar, Gaur, Giant Flying Squirrel, Travancore Flying, Otter species, Stripe-necked Mongoose, cobra, Indian rock python, king cobra and bamboo pit viper. The region has a rich diversity of birds (16 endemic endangered) such as Nilgiri wood-pigeon, Grey-breasted laughing thrush, blue-winged parakeet, grey-headed bulbul, Malabar grey hornbill, black and orange flycatcher and Nilgiri flycatcher. It harbors beautiful endemic and endangered papilionids viz, Malabar banded peacock, Paris peacock, Malabar raven, and Malabar banded swallowtail. Pushpagiri lies at the junction of the southern and northern ranges of Western Ghats. Towards the south, wildlife migration corridors extend from Pushpagiri to far away Wayanad Tiger Reserve in Kerala via Nagarhole and Bandipur tiger reserves. In the north, the 12 contiguous reserve forests act as vital corridors, connecting Kudremukh and two other tiger reserves in the state. Figure 22 depicts grids assigned higher weightages that covered in protected areas.
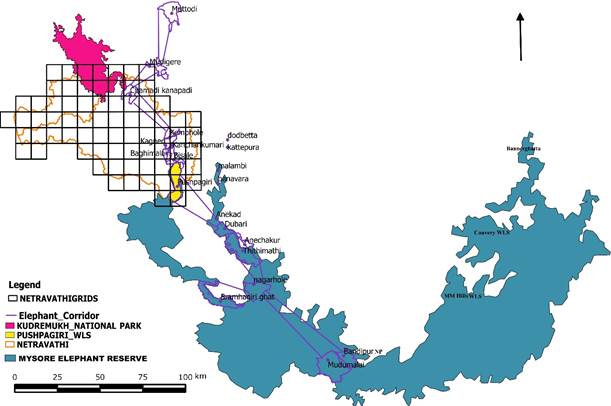
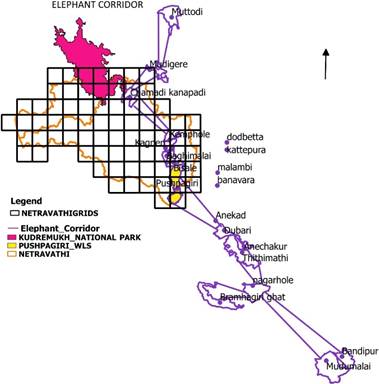
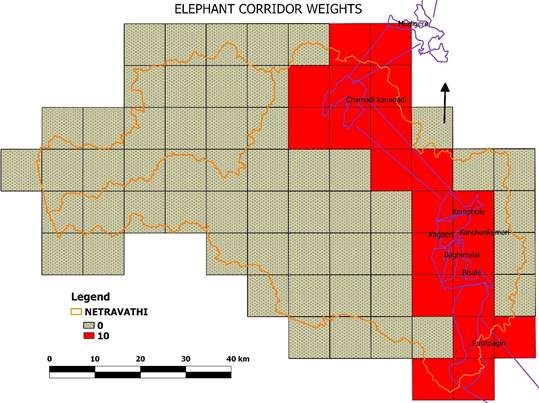
The elephants regarded as ‘Umbrella species’ or premier ‘Flagship species’ and sometimes as ‘Keystone species’. Due to their prime role in ecology and environment elephants are described as endangered by the Wildlife Protection Act, 1972 (Appendix-1) and by Appendix 1 of the Convention of International Trade of Endangered Species of Flora and Fauna (CITES) in 1975. Netravathi basin forms a vital elephant corridor that connects to notified Mysore Elephant Reserve. The Mysore Elephant Reserve was notified by the Karnataka Government in November 2002 (Vide GO FEE 231 FWL 2000, 25/11/2002), which forms a link connecting Western Ghats and Eastern Ghats covering many wildlife sanctuaries, National Parks etc. It covers the total area of 6,724 sq.km. The Bisle Reserve Forest of Netravathi river basin, vide the said GO, constitutes a vital part of the Mysore Elephant Reserve. It covers an area of 3,339 ha (Survey Number I and II in Bisle reserve forest). It adjoins Kempholé Reserve Forest in north and Pushpagiri Wildlife Sanctuary in the south. It is an integral and important part of the Mudumalai-Nagarhollé-Brahmagiri-Muttodi Corridor (Figure 23, 24). The grids that are part of these ecologically sensitive areas are assigned higher weightages (elephant corridor area) as shown in Figure 25.
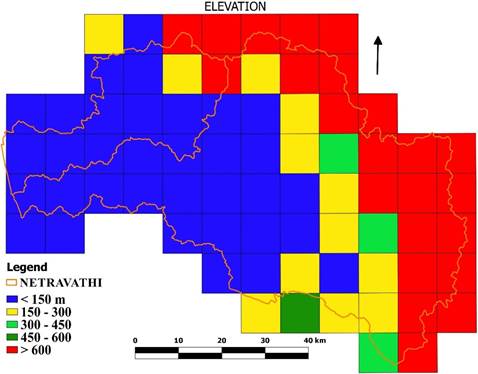
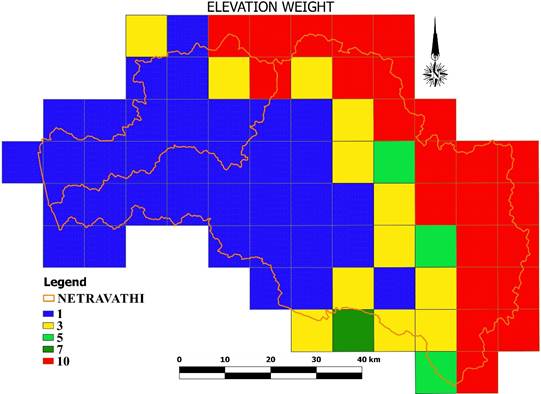
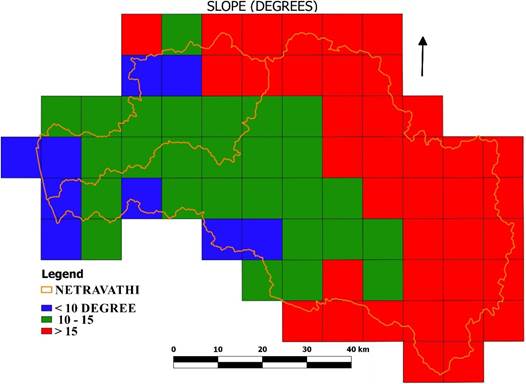
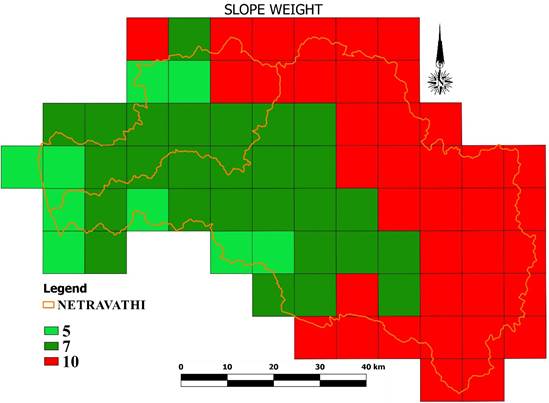
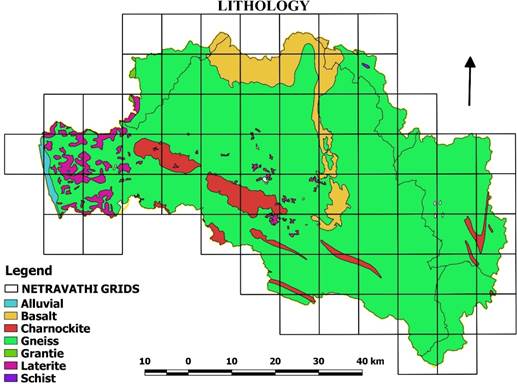
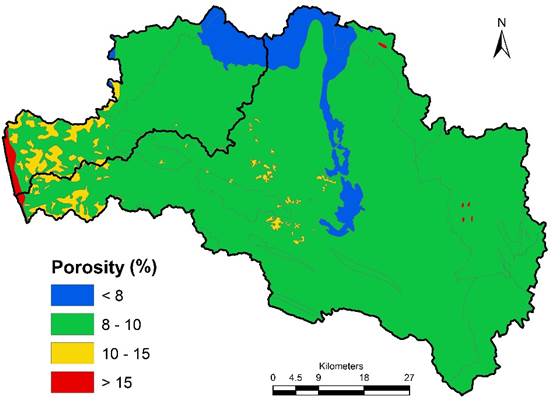
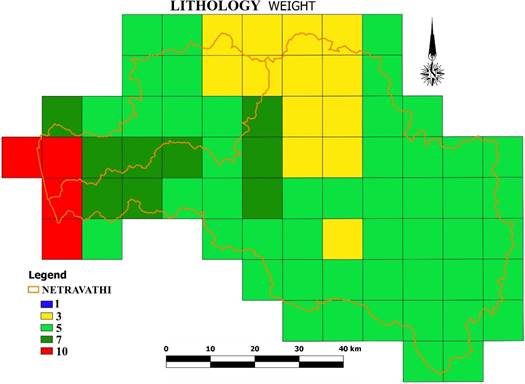
Geo-climatic: Geo-climatic information of region was analyzed to identify sensitive zones by considering altitude, slope, agro-climatic zones and rainfall. The high altitude regions are prone to landslides due to heavy rain, has extreme weather conditions, low humidity. Figure 26 shows the altitude map of the district; highest elevation is 1872 m in Mudigere taluk. The weightage map is generated by considering > 800 m as a higher priority for conservation and > 400 m is moderate and rest is least concern (Figure 27). Slope map (Figure 28) is generated to identify the regions which are more sensitive; alteration of these regions will have a higher impact. Increase in the population makes people move towards sensitive areas like highlands because of soil fertility, market-based agricultural ativities intensification. In such areas, landscape disturbances have lead to soil erosion, landslides, secondary plant succession, and ultimately to land abandonment. The slope > 15 degrees is considered as a more sensitive region and assigned higher weightage (Figure 29). Geologically, the catchment is dominated by Gneiss rocks. Lateritic rocks are found in at Mangalore, Buntwala and Karkala taluks. Charnokites are found in abundance in Buntwala and Puttur, Basaltic rocks are found at the transition zones in the taluks of Puttur and Beltangadi. Alluvial type is found at the Coast. Traces of Schist and Granitic rocks are found at Puttur, Beltangadi and Sakleshpura Taluks. Figure 30 depicts the lithological map of Netravathi river basin. These bedrocks play a major role in transferring water to the aquifers which contribute to base flow. Porosity and specific yield of bedrocks are the factors that define aquifer recharge and base flows. In general, Granitic rocks have low porosity i.e., about 3 - 5%, Aluvial rocks have the highest porosity i.e., about 20 -25%. Netravathi catchment is dominated by gneisses rock type which is a secondary rock formed due to metamorphism of primary volcanic rocks and has a porosity of 8 – 10% (31). Figure 32 portraits the weightages assigned as per porosity of basin.
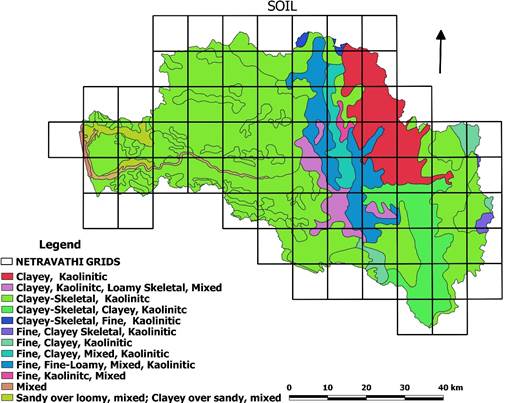
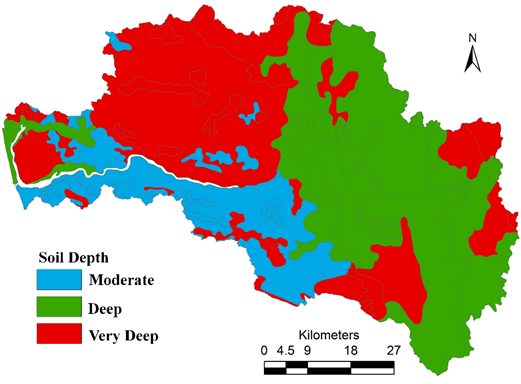
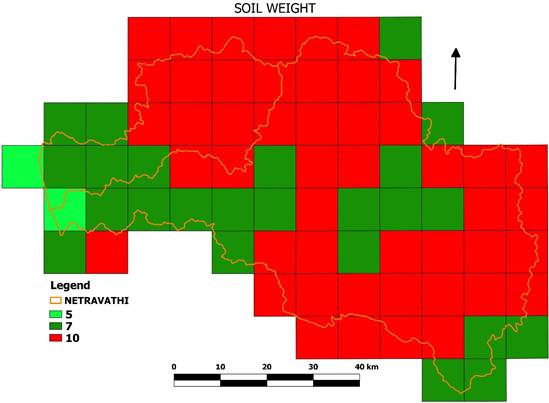
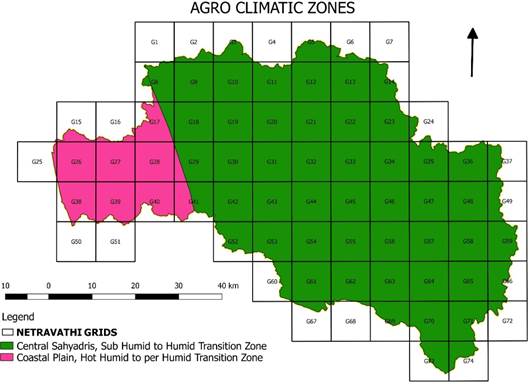
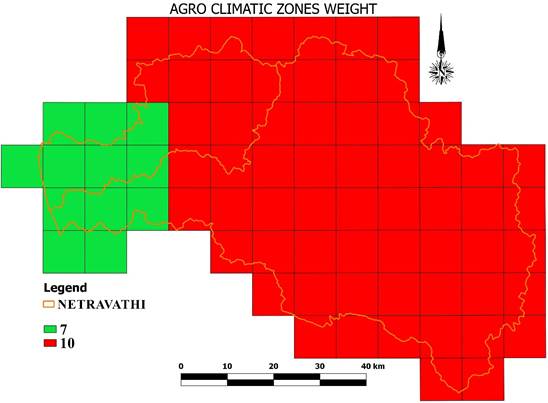
Soil depth and texture decides the water holding capacity of the catchment. Forests aid the soils with organic matter, roots penetrate deeper creating more void spaces allowing more water to percolate and store in the substrata. Netravathi catchment is dominated by clayey soils, only the coastal portion of the catchment is dominated by sandy soil (Figure 33). Gravelly, sandy soils have high water infiltration capability and allow water to easily pass through the strata without much retention, where a loamy and clayey soils have fewer pore spaces due to which infiltration capability is very low but have a higher water holding capacity which supports larger vegetation, keeps the rivers perennial in natural condition. Soils are moderately deep to very deep in nature (Figure 34). Soils along the Plains to the transition zones, Ridges are Clayey-Skeletal. Ghats and Transition Zones of Netravathi is dominated by Deep Soils with sparse Moderate Deep Soils, whereas the Ghats and transition zones of Gurupura have Very Deep Soils. The plains of both Catchment were dominated by Moderate Deep Soils. Coast zone again shows the dominance of Very Deep Soils. Presence of deeper soils with clayey content in the Ghats have higher water retention capability during post monsoons and summer, keeping the Netravathi perennial, but overexploitation of water for monoculture had altered some of the perennial streams to intermittent streams. The weightages are assigned based on water infiltration and soil depth characteristics as shown in Figure 35. Agroclimatic zones of the basin are considered to understand climatically suitable for different crops. The planning based on this will aim at scientific management of regional resources to meet the food, fodder and fuelwood without adversely affecting the status of natural resources and environment. The region has two major agroclimatic zones as per National Bureau of Soil Survey & Land Use Planning based on rainfall, soil group etc., as shown in Figure 36. The efficient management of agroclimatic zones indicates balanced growth attained by proper utilization of local resources involving local people. The higher weightages have been assigned to the grids covered in Sahyadri’s with rich resource base (Figure 37).
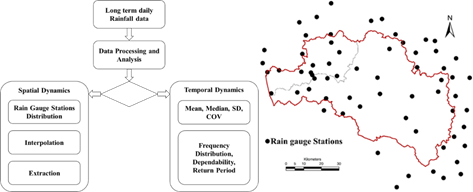
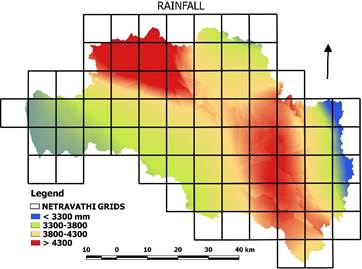
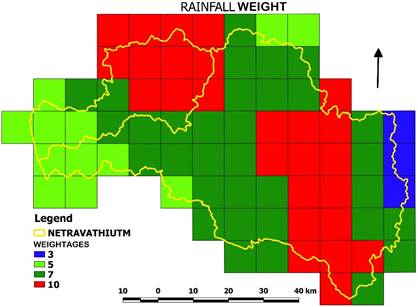
Long-term daily precipitation data of 1901-2013 were collected from the Directorate of Economics and Statistics, Government of Karnataka (Directorate of Economics and Statistics) pre-processed in order to rectify missing/erroneous rainfall records considering rainfall in neighboring rain gauge stations. Rectified data were further analysed for spatiotemporal variations. The data were further analysed for assessing trend, frequency, dependability, return period. Rain Gauge stations were identified and located using Google earth and Karnataka State Rain Gauge station map (Karnataka State Rain Gauge Stations). Interpolation was carried out understand the spatial dynamics of rainfall across the catchment. Post-processing (extraction) was carried out to quantify rainfall within the catchment. The temporal analysis was carried out to understand the variability, dependability, return period of rainfall at each taluk. India Meteorological Department classifies rainfall at regional scale as Excess, Normal, Deficient/Drought, Scanty/Severe Drought conditions as excess (Rainfall > + 20% average annual rainfall); normal (20% average annual rainfall < Rainfall < + 20% average annual rainfall); deficient (60% average annual rainfall < Rainfall < - 20% average annual rainfall); scanty (99% average annual rainfall < Rainfall < - 60% average annual rainfall). Figure 38 depicts the method involved in understanding the temporal dynamics of precipitation. The rainfall pattern of the district is analyzed to mark the sensitive regions for conservation. Most of the basin (Figure 39) is falling in the high rainfall zone (> 3500 mm), except eastern parts of Hassan district. The tallest emergent exceeding, endemic species are well distributed in higher rainfall region. The diversity, endemism, and rainfall are interrelated each other. The disturbance in these regions will have a major impact on the landscape. Spatial analysis indicates, Ghats receive the highest rainfall in the catchment about Average Annual rainfall of 4000-5200 mm, whereas the transition zones receive rainfall in the range of 4000 mm to 4500 mm, lowest rainfall is observed in the plains of Mudigere and Sakleshpura Taluks ranging between 2800 mm to 4000 mm. The detailed taluk level rainfall temporal dynamics are analysed and included in Annexure C. The Figure 40 shows weightage map considering higher rainfall gradient with greater weightage followed by moderate and low.
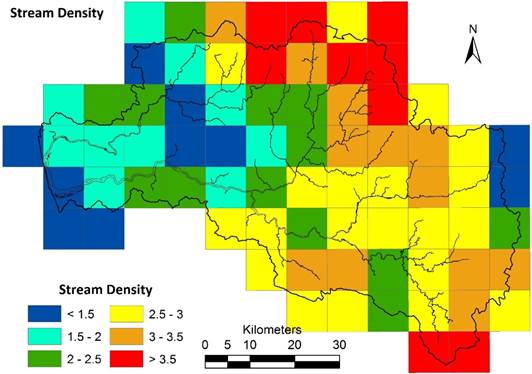
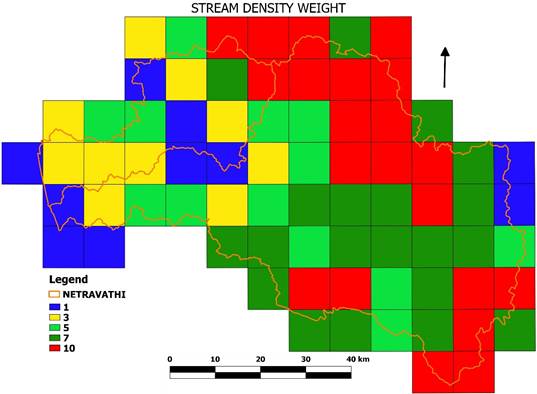
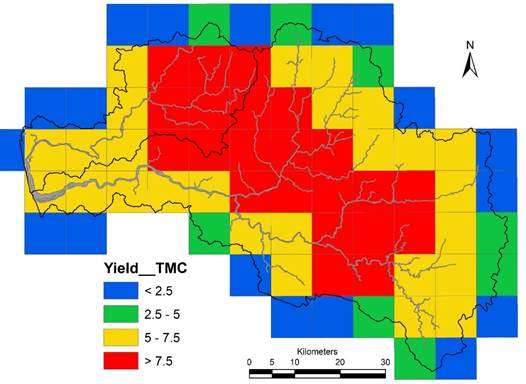
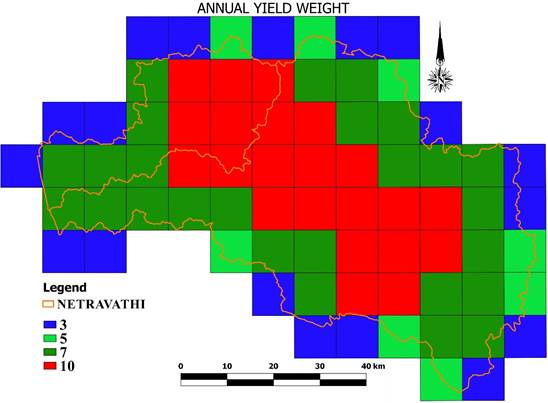
Hydrology: Hydrology of the region is assessed sub-basin wise to account perennial, seasonal flows of the region. Perennial flows in streams of a region depict health of the ecosystem. Hydrological characteristics of the basin have been analysed and assigned weights based on the variables such as stream density; water yield; runoff; runoff/rainfall ratio; supply vs demand. Stream density is defined as the ratio of stream length the catchment area. Higher the stream density in a catchment indicates of good hydrologic regime. Stream density has a direct impact on lag time and hydrograph peak. For a rainfall event, basins with high drainage densities will have relatively rapid response time (shorter lag time) and steeper limbs as against low-density drainages, i.e., precipitation gets into streams quicker in high dense drainages, in contrary to catchments with low dense drainages, precipitation has to travel as surface runoff, base flow, pipe flow, through fall enhancing lag time. Figure 41 depicts that Ghats have higher drainage density as against the coast and plains. Netravathi and Gurupura catchment together have Stream density of 2.5km per sq.km. Grids in the Ghats indicates higher stream density as against the coastal plains and assigned higher weights as shown in Figure 42. Natural Resource Conservation method was used to quantify the Runoff at Sub basin level in the catchment. Annual water yield is represented in Figure 43. The catchment has an annual average yield of 400 TMC (2603 mm). Figure 43 shows weightages assigned as per runoff.
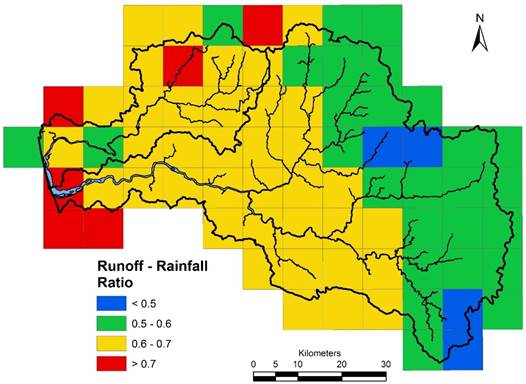
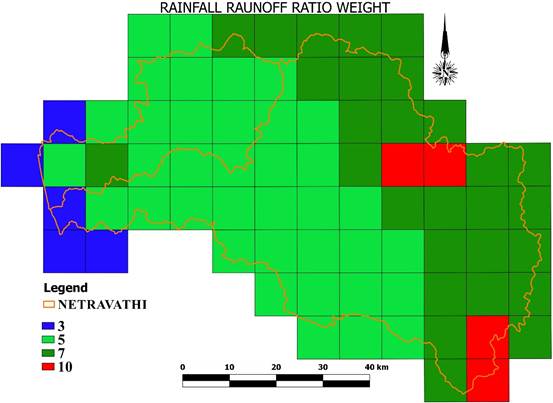
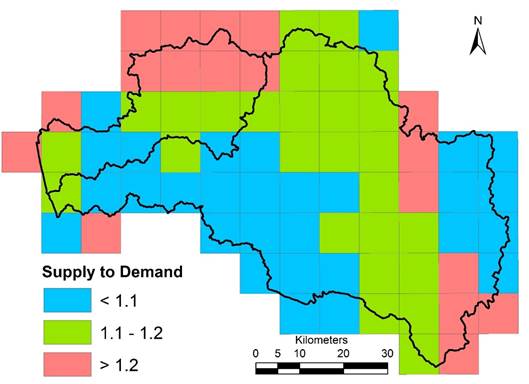
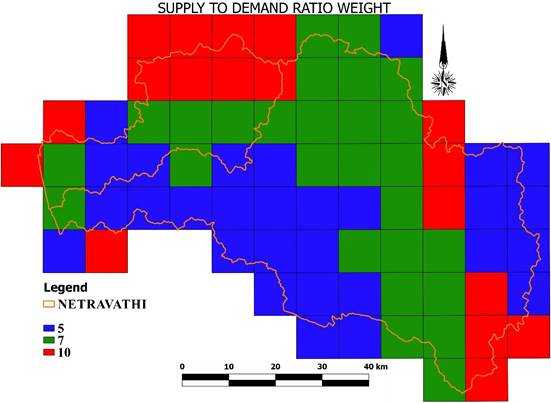
Runoff to Rainfall ratio across sub-catchments area depicted in Figure 44, indicating that the Ghats with good forest cover has lower runoff capabilities i.e., high retention capacities, compared to the coastal and plain lands. Figure 45 depicts weightages assigned as per runoff-rainfall ratio. Hydrological status, i.e., ratio of Supply to Demand indicates that the water available in the catchment after meeting biotic requirements. Total Water demand was quantified as a function of Agriculture Demand, Domestic and Livestock water demands. Total water demand other than Terrestrial Environmental demand (Evapotranspiration from the forest) and Aquatic Environmental Demand (Streamflow maintenance), is about 124 TMC.and with the addition of Evaporation of about 98 TMC, total water demand would increase to 222 TMC, considering Environmental flow of 30% Mean Annual Runoff, about 128 TMC, Total water Demand would increase to 350 TMC. The basin depicts Supply to existing Annual demand ratio of 1.1 (Figure 46). The higher weights were assigned to the grids with greater ratio , which indicates of surplus water conditions (Figure 47).
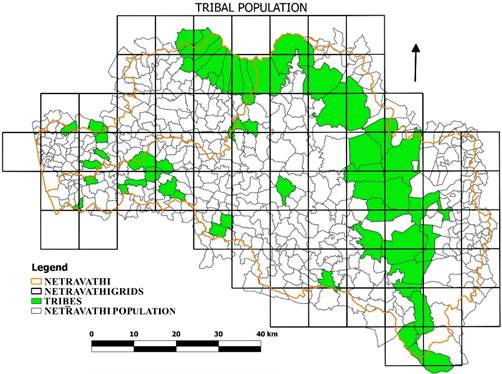
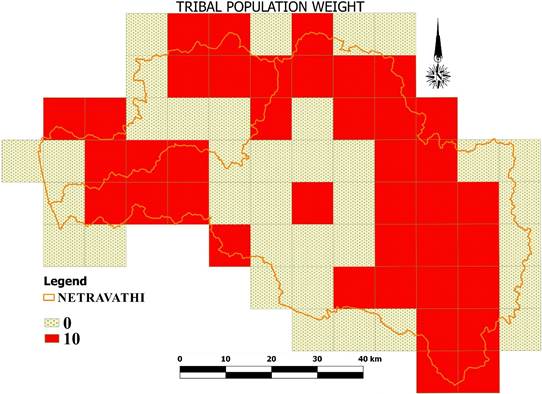
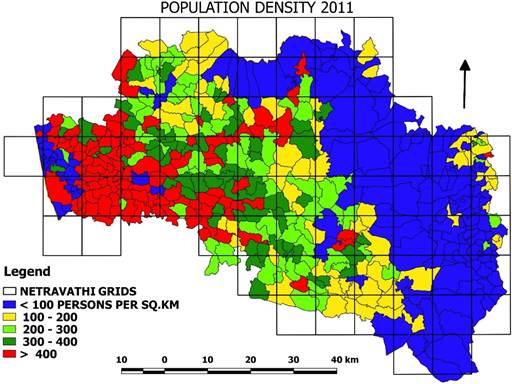
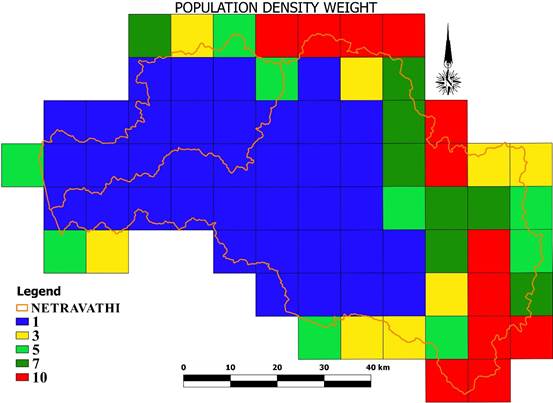
Social Aspects: The forest-dwelling communities of the region are considered as one of the key variables for grids prioritization. These people are directly and indirectly being contingent on forest resources. The forest-dwelling communities are Malekudiya, Marathi Naiks Gowdlu. Jenukuruba Kadukuruba and Yeravas (Lalitha, 2015). They are socially and politically backward and most of them depend on casual labor, trading forest products for their livelihood. Malekudiyas speak Tulu language are employed as agricultural laborers on bigger farms and also gain income from the forest produces. The Marathi Naiks, Gowdlu speak Kannada language and distributed well and gain income from Non-timber forest produce (NTFPs) that they collect and also as daily labor. The cattle population in the villages is creating a greater problem in KNP and affecting regeneration. The department was taken restorative activities to move 5,000 families (20,000 people, 90 percent of them were tribal people) from KNP area. The presence of tribes considered as higher weightages (Figure 48, 49). Population density is considered as another proxy of ESR mapping. The population density of each grid is analyzed (Figure 50) based on census data of 2011. It is noticed of higher resource extractions with the population (Figure 51). The grids with higher population densities were assigned lower weightages (1) and lower density regions were assigned higher conservation weightages (10).
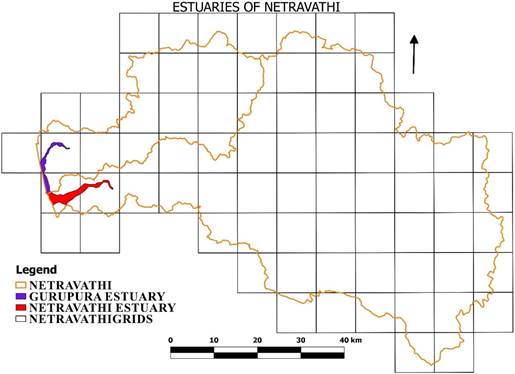
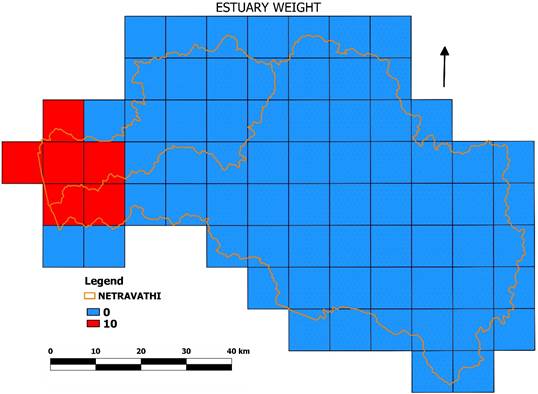
Estuarine diversity: Estuarine ecosystems are a tiny ribbon of land, but the emissions from their destruction are nearly one-fifth of those attributed to deforestation worldwide (Pendleton et al., 2012). The major mangrove species present are Acanthus ilicifolius, Acrostichum aureum, Aegiceras corniculatum, Avicennia alba, Avicennia officinalis, Bruguiera gymnorrhiza, Excoecaria agallocha, Kandelia candel, Rhizophora mucronata, Sonneratia alba and Sonneratia caseolaris (Suma, 2013; Reddy et al., 2015).The farmers also plant rows of mangrove trees just outside these bunds to fortify them from collapse (Figure 52). This traditional system of estuarine cultivation with mangrove planting was a sustainable system. Netravathi estuary is one of the highly productive estuarine system in west coast supporting numerous life forms. The higher weightages are assigned emphasizing productivity to protect in future from further disturbances (Figure 53).
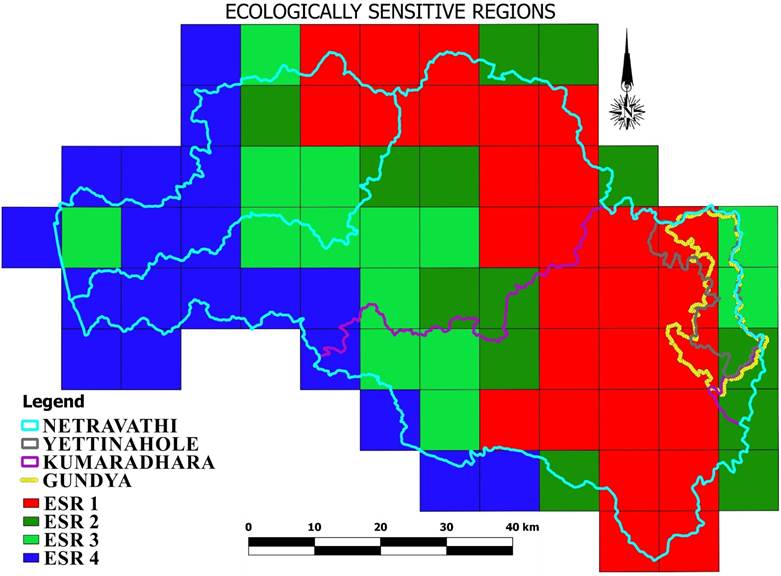
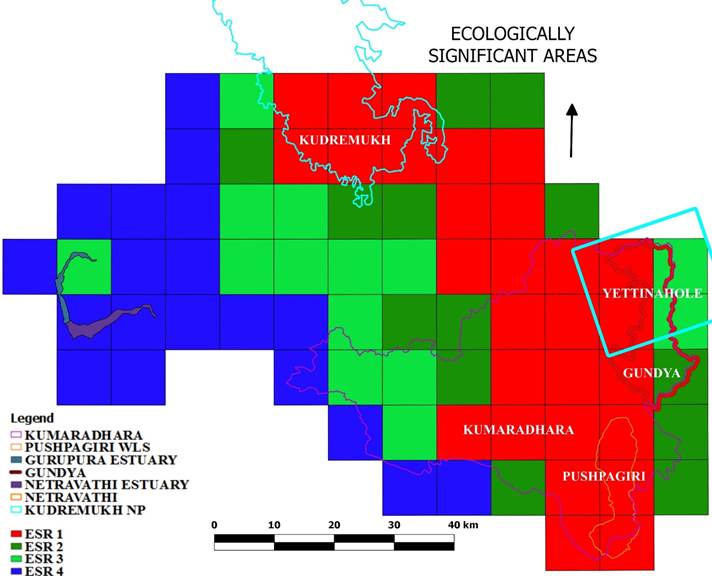
Theme wise spatial layers with prioritized grids were overlaid, which aided in delineating ecologically sensitive regions (ESR). The grid wise weights were aggregated to compute final composite weights and grouped into four categories. Figure 54 shows 28 grids represent ESR 1, 12 grids represent ESR 2, 14 grids represent ESR 3 and the rest 20 grids represent ESR 4. The 38% of the area of grids represents ESR 1, 16% of the area shows ESR 2, 19 % of the area shows ESR 3 and only 27 % area covers ESR 4. Figure 54 depicts village level ecological sensitiveness and Table 3 provides the details of the villages in the respective ESRs spread across five districts. ESR 1 represents zone of highest conservation, no further degradation allowed. ESR 1 can be treated as a highly sensitive region and more conservation is to be imposed by regulatory authorities as well as VFCs (Village forest committees). ESR 2 represents a zone of higher conservation and forms a transition for highest conservation and moderate conservation regions. ESR 3 represents moderate conservation region and only regulated development is allowed in these areas. ESR 4 represents least diversity areas and the developments are allowed as per the requirement by strict vigilance from regulatory authorities. It is recommended that these regions are also has a lot of scope for further enrichment of environment by stakeholders and forest department intervention. In ESR 2 & ESR 3 further developments are allowed only after critical review of regulatory and extensive consultations with stakeholders. Small-scale tourism may be encouraged adopting benefit sharing with local communities such as homestay, spice farms, eco-friendly boating etc. The uncontrolled development should be discouraged in and around of pristine lakes, primeval forest patches, perennial water bodies. The site-specific (clustered base) sustainable developments can be taken up at each panchayat, which has least impact on the ecosystem.
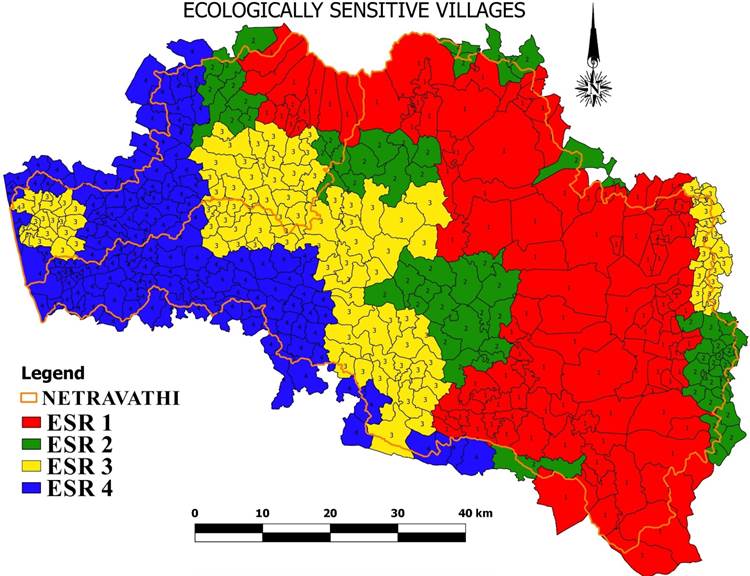
Figure 55 shows ecologically significant areas such as Gundya, Pushpagiri WLS, Kudremukh NP, Yettinaholé regions. These areas are majorly covered in ESR-1 & 2 which signifies the necessity of protection from further degradations. The village wise ESR delineation has shown in Figure 56 and Annexure D provides taluk wise categorized ESR villages under each district. The village wise ESR analysis shows Netravathi river basin covers total 433 villages of across five districts (Table A). The ESR-1 shows 111 villages, ESR-2 shows 69 villages, ESR-3, 4 shows 119 and 134 villages respectively. The Dakshina Kannada district has 307 villages out of which 62 villages depict ESR-1. Forests of these villages need to be protected on priority. The controlled and regulated activities in each ESR region are listed in Table 4. The Annexure E and Figure I, II shows ecologically sensitive areas as per earlier literatures (Gadgil committee report and Kasturirangan committee reports).
Table 2: ESR Villages under various districts of Kali river basin.
SNO |
DISTRICT NAME |
ESR-1 |
ESR-2 |
ESR-3 |
ESR-4 |
TOTAL |
1 |
Dakshina Kannada |
62 |
31 |
95 |
119 |
307 |
2 |
Udupi |
1 |
6 |
0 |
15 |
22 |
3 |
Chikmagaluru |
9 |
7 |
0 |
0 |
16 |
4 |
Hassan |
33 |
21 |
24 |
0 |
78 |
5 |
Kodagu |
6 |
4 |
0 |
0 |
10 |
NETRAVATHI RIVER BASIN |
111 |
69 |
119 |
134 |
433 |
Table 3: Activities that can be allowed in ESR -1, 2 3 & 4.
SNO |
ACTIVITIES |
ECOLOGICALLY SENSITIVE REGIONS |
ESR-1 |
ESR-2 |
ESR-3 |
ESR-4 |
1 |
ENERGY |
ü |
ü |
ü |
ü |
|
|
û |
ü |
ü |
ü |
|
û |
ü |
ü |
ü |
- Coal based (Thermal power)
|
û |
û |
û |
û |
|
û |
û |
û |
ü |
|
û |
û |
û |
û |
|
û |
û |
û |
ü |
|
û |
û |
û |
û |
2 |
FORESTS |
û |
û |
û |
û |
- Land use change (Forest to non-forest usages)
|
|
û |
û |
û |
û |
- Extraction of medicinal plants (with strict regulations)
|
û |
û |
ü |
ü |
- Forest improvement through VFCs
|
ü |
ü |
ü |
ü |
|
ü (Strict regulation by department) |
ü |
ü |
ü |
3 |
AGRICULTURE |
ü |
ü |
ü |
ü |
|
|
ü |
ü |
ü |
ü |
- Land use change / Encroachments
|
û |
û |
û |
û |
|
- Genetically modified crops
|
û |
û |
û |
û |
|
|
ü |
ü |
ü |
ü |
4 |
HORTICULTURE |
ü |
ü |
ü |
ü |
|
- Nitrogen and Phosphorus (N&P) fertilizers
|
û |
û |
û |
ü Dosage as prescribed by Agriculture department |
|
û |
û |
û |
û |
|
û |
û |
û |
ü |
|
- Watermelon & Muskmelon farming
|
û |
ü |
ü |
ü |
5 |
INDUSTRIES (Larger scale) |
ü |
ü |
ü |
ü |
- Agro-processing industries
|
- Information Technology industries (IT)
|
û |
û |
ü |
ü |
- Red category (Polluting) industries
|
û |
û |
û |
û |
|
û |
û |
ü |
ü |
|
- New establishment of Industries
|
û |
û |
û |
ü (Allowed only after critical review by local stake holders and experts) |
|
- Nonpolluting (Green) Industries
|
û |
û |
ü |
ü |
6 |
INDUSTRIES (Small scale) |
û |
ü |
ü |
ü |
|
- Domestic (Home based) industries
- Papad
|
ü |
ü |
ü |
ü |
|
ü |
ü |
ü |
ü |
- Areca nut processing & Coir industries
|
û |
ü |
ü |
ü |
- Milk products and processing
|
ü |
ü |
ü |
ü |
|
ü |
ü |
ü |
ü |
- Fruit processing (Ex: Kokum Juice (Garcinia indica))
|
ü |
ü |
ü |
ü |
|
ü |
ü |
ü |
ü |
- Bee keeping and bee nurseries
|
ü |
ü |
ü |
ü |
- Pongamia plantations for biofuel (in private lands)
|
û |
ü |
ü |
ü |
- Bio pesticides manufacturing
|
û |
ü |
ü |
ü |
- Poultry farms and powdered eggs
|
û |
ü |
ü |
ü |
- Vegetable dyes; fruits and vegetables preservation
|
ü |
ü |
ü |
ü |
- Medicinal plants cultivation and processing
|
ü |
ü |
ü |
ü |
- Aromatic plants and essential oil distillation; orchids and cut flowers harvesting industries
|
û |
ü |
ü |
ü |
7 |
TOURISM INDUSTRY |
û |
ü |
ü |
ü |
|
- Organic village and homestay
|
ü |
ü |
ü |
ü |
|
ü |
ü |
ü |
ü |
- VFC managed homestay tourism in higher forest cover regions and protected areas
|
û |
ü |
ü |
ü |
- Arts and handicrafts museum and trade center
|
ü |
ü |
ü |
ü |
8 |
MINING AND MINERAL EXTRACTION |
û |
û |
û |
û |
|
|
û |
û |
û |
û |
|
û |
û |
û |
û |
|
û |
û |
û |
ü |
|
û |
û |
û |
ü |
- Sand extraction (on sustainable basis by
Ban on exporting) |
û |
û |
ü |
ü |
9 |
WASTE DISPOSAL |
û |
û |
û |
û |
- Hazardous waste processing units
|
|
û |
û |
û |
ü (For composting and manure preparation) |
|
û |
û |
û |
ü (Treatment plants (STP) for processing) |
- Recycling and waste processing and units
|
û |
û |
û |
ü(compliant with PCB) |
10 |
TRANSPORTATION |
û |
û |
û |
ü(Allowed only after strict EIA) |
|
- Rail and freight corridors
|
Subject to EIA; Strict regulation and social audit |
- Up gradation of existing infrastructure
|
û |
û |
ü(Subject to
EIAs, strict regulation and
social audit) |
ü |
Remarks |
- The ESR_1 represents a zone of highest conservation, no further degradation allowed. ESR-2 has the potentiality to become as ESR-1 provided with strict regulations and improvement of forests and its environs by more protection. A small change in ESR-2 will have more adverse effects in ESR-1.
- Forest Rights Act to be implemented in its true spirit by reaching out to people.
- Monoculture plantations are not allowed, existing exotics should be replaced by planting endemic species.
- Promote decentralized electricity, use of renewable energy sources such as (solar, wind power).
- The local bio resource based industry should be promoted. All should be strictly regulated and be subject to social audit.
- Adapt development projects which will have a least environmental impact by involving local community members in decision making and environmental monitoring.
- No new major roads, railway lines are allowed, except when highly essential and subject to EIA, by imposing strict regulation and social audit.
- Tourism Master Plan should be based on MoEFCC regulations (after taking into account social and environmental costs).
- Controlled activities are permitted based on socio-economic importance and activities such as depriving wetlands, natural forests, the introduction of alien invasive species are not permitted.
|
LAND |
Figure 14: Forest cover of Netravathi river basin |
|
Figure 15: Forest cover weightage map |
|
ECOLOGY |
Figure 16: Flora and Fauna distribution in Netravathi |
|
Figure 17: Flora diversity of Netravathi as per IUCN status |
|
Figure 18: Weightages of flora |
|
Figure 19: Faunal diversity of Netravathi as per IUCN status |
|
Figure 20: Weightages of fauna diversity |
|
Figure 21: Protected Areas of Netravathi basin |
|
Figure 22: Weightages of reserves |
|
Figure 23: Elephant movement path (Mutthodi to Bannerghatta) |
|
Figure 24: Prime elephant movement path in Netravathi basin |
|
Figure 25: Weightages assigned for elephant movement path. |
|
GEO-CLIMATIC |
Figure 26: Altitude (m) of Netravathi |
|
Figure 27: Weightages of altitude |
|
Figure 28: Slope (%) map of Netravathi |
|
Figure 29: Weightage map of slope values |
|
Figure 30: Lithology of Netravathi basin |
|
Figure 31: Porosity and Specific Yield |
|
Figure 32: Weightages based on porosity |
|
Figure 33: Soils of Netravathi |
|
Figure 34: Soil depth across the basin |
|
Figure 35: Weightage map as per soil type and depth |
|
Figure 36: Agro climatic zones of Netravathi basin. |
|
Figure 37: Agro climatic zones weightage map |
|
Figure 38 (a): Method adopted for analyzing and rain gauge stations spatial distribution |
|
Figure 39: Rainfall map of Netravathi basin |
|
Figure 40: Weightage map based on rainfall |
|
HYDROLOGY |
Figure 41: Stream density of Netravathi |
|
Figure 42: Weightage map based on stream density |
|
Figure 43: Annual Runoff of entire basin |
|
Figure 43: Annual yield weight |
|
Figure 44: Runoff and Rainfall raio |
|
Figure 45: Weightages based on ratio of runoff and rainfall |
|
Figure 46: Supply to demand ratio of water in Netravathi. |
|
Figure 47: Weightate maps asper ratio. |
|
SOCIAL ASPECTS |
Figure 48: Forest dwelling communities distribution in Netravathi river basin |
|
Figure 49: Weightage map of forest dwelling communities |
|
Figure 50: Population density map |
|
Figure 51: Weightage associated with population density |
|
ESTUARINE DIVERSITY |
Figure 52: Estuaries of Netravathi |
|
Figure 53: Estuarine diversity weightages |
|
Figure 54: Ecologically Sensitive Regions of Netravathi river basin |
|
Figure 55: Ecologically Significant areas of Netravathi river basin |
|
Figure 56: Village level Ecologically Sensitive Regions |
|
References:
- Beinat, E., Value functions for environmental management. Kluwer Academic, Boston. MA, 241, 1997.
- Bharath S, Bharath H A, Sanna Durgappa, D., Ramachandra T. V., 2012, Landscape Dynamics through Spatial Metrics, Proceedings of India Geospatial Conference, Epicenter, Gurgaon, India, 7-9 February, 2012.
- Bharath, S., Rajan, K.S. and Ramachandra, T.V., 2014a. Status and future transition of rapid urbanizing landscape in central Western Ghats-CA based approach. ISPRS Annals of the Photogrammetry, Remote Sensing and Spatial Information Sciences, 2(8), p.69.
- Bharath S., Rajan K.S., Ramchandra T.V., 2014b. Visualization of Forest Changes in Uttara Kannada, Vol. 8, Proceedings Lake 2014, 13-15 November.
- Brooks, T.M., Da Fonseca, G.A. and Rodrigues, A.S., 2004. Protected areas and species. Conservation Biology, pp.616-618.
- Change, G, 2013. Biodiversity Conservation and Rehabilitation of Tribal’s from Kudremukh National Park Seventh Biennial Conference of Indian Society for Ecological Economics (INSEE)-Global Change, Ecosystems, Sustainability.
- Dai, X., Li, Z., Lin, S. and Xu, W., 2012. Assessment and zoning of eco-environmental sensitivity for a typical developing province in China. Stochastic environmental research and risk assessment, 26(8), pp.1095-1107.
- Egoh, B., Rouget, M., Reyers, B., Knight, A.T., Cowling, R.M., van Jaarsveld, A.S. and Welz, A., 2007. Integrating ecosystem services into conservation assessments: a review. Ecological Economics, 63(4), pp.714-721.
- Fusco, G., 2002. Conceptual modelling of the interaction between transportation, land use and the environment as a tool for selecting sustainability indicators of urban mobility. Cybergeo: European Journal of Geography.
- Gadgil, M., Krishnan, B., Vijayan, V., Borges, R., Sukumar, R. and Subrahmanyam, G., 2015. Report of the Western Ghats ecology expert panel submitted to the ministry of environment and forests, the government of India.
- Grant, F., Young, J., Harrison, P., Sykes, M., Skourtos, M., Rounsevell, M., Kluvánková-Oravská, T., Settele, J., Musche, M., Anton, C. and Watt, A., 2008, April. Ecosystem services and drivers of biodiversity change. In Report of the RUBICODE E-Conference.
- Gonzalez, R.C., Woods, R.E., 2007. Digital Image Processing (3rd Edition). Available at: http://www.amazon.ca/exec/obidos/redirect?tag=citeulike09-20&path=ASIN/013168728X.
- Kasturirangan, K., Babu, C.R., Mauskar, J.M., Chopra, K., Kishwan, J., Shankar, D., Narain, S., Roy, P.S., Tyagi, A. and Chandrasekharan, I., 2013. Report of the high-level working group on the Western Ghats. Submitted to the Ministry of Environment and Forests, Government of India.
- Kennedy, R.E., Townsend, P.A., Gross, J.E., Cohen, W.B., Bolstad, P., Wang, Y.Q. and Adams, P., 2009. Remote sensing change detection tools for natural resource managers: Understanding concepts and tradeoffs in the design of landscape monitoring projects. Remote sensing of environment, 113(7), pp.1382-1396.
- Kinzig, A., Ryan, P., Etienne, M., Allison, H., Elmqvist, T. and Walker, B., 2006. Resilience and regime shifts: assessing cascading effects. Ecology and society, 11(1).
- Knight, A.T., Cowling, R.M. and Campbell, B.M., 2006. An operational model for implementing conservation action. Conservation Biology, 20(2), pp.408-419.
- Lalitha K.P., 2015. Unique Tribes of Coorg. International Journal of Research in Humanities and Social Studies, 10(2): 61-65.
- Leman, N., Ramli, M.F. and Khirotdin, R.P.K., 2016. GIS-based integrated evaluation of environmentally sensitive areas (ESAs) for land use planning in Langkawi, Malaysia. Ecological indicators, 61, pp.293-308.
- Lillesand, T.M., Kiefer, R.W., Chipman, J.W., 2004. Remote sensing and image interpretation, Lloydia Cincinnati. Available at: http://www.osti.gov/energycitations/product.biblio.jsp?osti_id=6028047.
- Lillesand, T.M., Kiefer, R.W. and Chipman, J., 2014. Remote sensing and image interpretation. John Wiley & Sons, Newyork.
- MoEF, 2000. Report of the Committee on identifying parameters for designating Ecologically Sensitive Areas in India (Pronab Sen Committee Report).
- Naidoo, R., and Ricketts, T.H. 2006. Mapping the economic costs and benefits of conservation. PLoS Biology 4(11): e360. DOI: 10.1371/journal.pbio.0040360.
- Olson, D.M., Dinerstein, E., Wikramanayake, E.D., Burgess, N.D., Powell, G.V.N., Underwood, E.C., D’Amico, J.A., Itoua, I., Strand, H.E., Morrison, J.C., Loucks, C.J., Allnutt, T.F., Ricketts, T.H., Kura, Y., Lamoreux, J.F., Wettengel, W.W., Hedao, P., Kassem, K.R., 2001. Terrestrial ecoregions of the world: a new map of life on earth. BioScience 51, 933–938.
- Pascal, J.P., 1986. Explanatory booklet of vegetation maps 1, 2 and 3. Institut Français de. Pondichéry, India. 88 pp.
- Pendleton, L., Donato, D.C., Murray, B.C., Crooks, S., Jenkins, W.A., Sifleet, S., Craft, C., Fourqurean, J.W., Kauffman, J.B., Marbà, N. and Megonigal, P., 2012. Estimating global “blue carbon” emissions from conversion and degradation of vegetated coastal ecosystems. PloS one, 7(9), p. e43542.
- Peng Z.W., Wang Y.C., Gao J., 2013. Village Planning and Development Study in Environmentally Sensitive Area. Journal of Urban Planning Forum, 208:7-14.
- Pressey, R.L. and Cowling, R.M., 2001. Reserve selection algorithms and the real world. Conservation Biology, 15(1), pp.275-277.
- Ramachandra, T.V., Bharath S and Bharath H. A, 2014a. Spatio-temporal dynamics along the terrain gradient of diverse landscape, Journal of Environmental Engineering and Landscape Management, 22:1, 50-63, doi:http://dx.doi.org/10.3846/16486897.2013.808639.
- Ramachandra, T.V., Bharath S and Subashchandran, M D, 2016. Geospatial analysis of forest fragmentation in Uttara Kannada District, India. Forest Ecosystems, 3(1), p.10.
- Ramachandra, T.V., Bharath S, Subashchandran, M.D., Rao, G.R., Vishnu, D.M., Joshi, N.V., 2017. Ecologically Sensitive Regions in the Kali River Basin, Karnataka: Delineation based on Ecological Principles and People’s Livelihood, ENVIS Technical Report 125, Sahyadri Conservation Series 68, Energy & Wetlands Research Group, CES, Indian Institute of Science, Bangalore 560012.
- Ramachandra, T.V., Bharath, S. and Gupta, N., 2018. Modelling landscape dynamics with LST in protected areas of Western Ghats, Karnataka. Journal of environmental management, 206, pp.1253-1262.
- Reddy, H.R.V., Gowda, G., Somashekar, S.R., Sushanth, V.R., Adiga M.S., Durgekar, R.N., 2015. Phytosociological analysis of mangrove vegetation in Netravathi-Gurupura and Mulki-Pavanje Estuarine complexes of Dakshina Kannada, Karnataka, International Journal of Science and Nature, 6(3):353-361.
- Reed, M.S., 2008. Stakeholder participation for environmental management: a literature review. Biological conservation, 141(10), pp.2417-2431.
- Reid, R.S., Nkedianye, D., Said, M.Y., Kaelo, D., Neselle, M., Makui, O., Onetu, L., Kiruswa, S., Kamuaro, N.O., Kristjanson, P. and Ogutu, J., 2016. Evolution of models to support community and policy action with science: Balancing pastoral livelihoods and wildlife conservation in savannas of East Africa. Proceedings of the National Academy of Sciences, 113(17), pp.4579-4584.
- Suma, G.P., 2013. Diversity of mangroves in Udupi district of Karnataka state, India. International Research Journal of Biological Sciences, 2(11), pp.11-17.
- Stirling, A. 2007. Resilience, robustness, diversity: Dynamic strategies for sustainability. Abstracts, 7th International Conference of the European Society for Ecological Economics, Leipzig, Germany, 5-8th June 2007.
- Termorshuizen, J.W. and Opdam, P., 2009. Landscape services as a bridge between landscape ecology and sustainable development. Landscape Ecology, 24(8), pp.1037-1052.
- Turner, W.R., Brandon, K., Brooks, T.M, Costanza, R., da Fonseca, R.G.A., and Portela, R. 2007. Global conservation of biodiversity and ecosystem services. BioScience 57: 868-873.
- Vinay, S., Bharath, S., Bharath, H.A., Ramachandra, T.V., 2013. Hydrologic model with landscape dynamics for drought monitoring. In proceeding of: Joint International Workshop of ISPRS WG VIII/1 and WG IV/4 on Geospatial Data for Disaster and Risk Reduction, Hyderabad, November (pp. 21-22).
- Walker, B., Meyers, J.A., 2004. Thresholds in ecological and social-ecological systems: A developing database. Journal of Ecology and society, 9(2):3.
|
Dr. T.V. Ramachandra
Centre for Sustainable Technologies, Centre for infrastructure, Sustainable Transportation and Urban Planning (CiSTUP), Energy & Wetlands Research Group, Centre for Ecological Sciences, Indian Institute of Science, Bangalore – 560 012, INDIA.
E-mail : tvr@iisc.ac.in
Tel: 91-080-22933099/23600985,
Fax: 91-080-23601428/23600085
Web: http://ces.iisc.ac.in/energy
Bharath Setturu Energy & Wetlands Research Group, Centre for Ecological Sciences, Indian Institute of Science, Bangalore – 560 012, INDIA.
E-mail: setturb@iisc.ac.in
Vinay S.Energy & Wetlands Research Group, Centre for Ecological Sciences, Indian Institute of Science, Bangalore – 560 012, INDIA.
E-mail: svinay@iisc.ac.in
Citation:Ramachandra T V, Bharath Setturu, Vinay S, 2018. Carrying Capacity of the Netravathi River basin based on the Ecological Sensitiveness, Sahyadri Conservation Series 74, ENVIS Technical Report 136, Environmental Information System, CES, Indian Institute of Science, Bangalore 560012
| Contact Address : |
| |
Dr. T.V. Ramachandra
Energy & Wetlands Research Group,
Centre for Ecological Sciences, TE 15, New Biology Building, Third Floor, E Wing, [Near D Gate], Indian Institute of Science, Bangalore – 560 012, INDIA.
Tel : 91-80-22933099 / 22933503-extn 107
Fax : 91-80-23601428 / 23600085 / 23600683 [CES-TVR]
E-mail : tvr@iisc.ac.in, energy.ces@iisc.ac.in,
Web : http://wgbis.ces.iisc.ac.in/energy |
|