Results and discussion |
The drainage pattern of the study area (Figure 2) indicates higher drainage density (3.82 km of stream per sq. km) towards the western and southern catchments with rugged hills and deep valleys, while the eastern flatter terrain has lower drainage density (1.54 km/sq. km). Analysis of rainfall data for 20 years (19812001) indicates that it varies from 4980 ± 1104 mm (west); 4092 ± 1167 mm (south) to 1883 ± 452 mm (east), and the variation is significant (ANOVA, F = 94.24, P = 0.0001). Streams range from perennial (on the western side), to intermittent (south and parts of west) to ephemeral (east).
Land-use analysis of the study area using remote-sensing data (Figure 3), supported by ground studies reveals that about 25% of the area is under moist deciduous forest and 16% under evergreen to semi-evergreen forest. Plantations (Acacia auriculiformis, Casuarina equisetifolia, Pinus spp., Eucalyptus spp. and areca nut orchards) cover 9.7% of the total landscape. About 21% of the land comes under the combination of grassland, scrub and cultivable waste. Agriculture (excluding areca nut orchards) covers 8.5%. The total water-spread area was 7.1% and the dry reservoir bed was 5.4% (both subject to seasonal changes). Barren lands, which include built-up area, roads and rocky areas, constitute 7.14% of the landscape. Vegetation analysis shows that natural vegetation is poor towards the eastern side, due to intense anthropogenic activities. This region has more of agriculture, monoculture plantations of exotic tree species, scrub and savanna, and built-up area. The forest is predominantly of moist deciduous type, with small isolated bits of semi-evergreen vegetation. In contrast, the western region with rugged hilly terrain and heavier rainfall (~5000 mm) has characteristic evergreen to semi-evergreen forests as the natural cover. These are interspersed with grassy blanks, scrub and savanna, areca nut gardens and paddy fields.
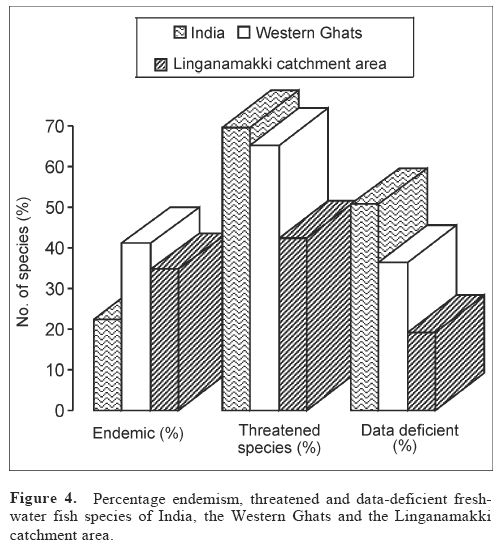
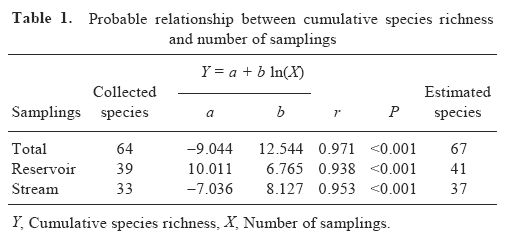
We have recorded 64 species of fishes belonging to 38 genera and 17 families from the upper catchment of Sharavathi River. The maximum number of species that is likely to occur in the upper catchment of Sharavathi River is 67 according to MichaelisMenten equation15, requiring a sampling effort of 334 (Table 1). Similarly, maximum number of species in the reservoir is 41, requiring sampling effort of 98 and in the streams it is 37, requiring a sampling effort of 236. Cyprinidae with 31 species was the dominant family, followed by Balitoridae and Bagridae with 8 and 6 species respectively. Among the genera, Puntius was more diverse with seven species, followed by Schistura with six species. Annexure I details the species recorded from the region with their ecological status. Of the 64 species, 18 are endemic to the Western Ghats and 28 are confined to peninsular India. Varied ecological status of the twenty-two species indicates the uniqueness of the region and the need for its urgent conservation. The study area accounts for 6.88% of Indian freshwater fish (930 species) and 22.2% of the Western Ghats species (289), while constituting only 0.006% of the geographical area of the latter. Figure 4 depicts the percentage of endemism, threatened and datadeficient fish species in India, the Western Ghats and upper catchment of the Sharavathi River.
The discovery of two new species of genus, Schistura namely S. nagodiensis and S. sharavathiensis, in the perennial streams of the western side with evergreen to semievergreen clad landscape34 highlights the ecological significance of the region. A critically endangered species, Tor mussullah, and the recently described Batasio sharavathiensis35, a rare species restricted only to the Sharavathi River basin, are also candidates for the Critically endangered status, and were recorded in the western part of the reservoir. S. nilgiriensis has been reported for the first time in Karnataka from this river basin36.
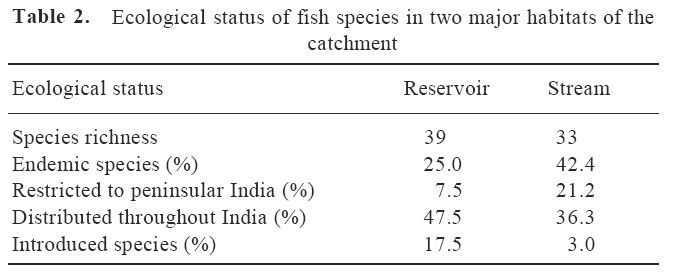
The reservoir had 39 species (Annexure I) of fish (ten endemic to the Western Ghats, three restricted to peninsular India, seven introduced and 18 non-endemics having distribution all over India). The streams studied had 33 species of which 12 were endemic to the Western Ghats, seven to peninsular India and 11 had all-India distribution (three with unknown status). Ecological status of reservoir and stream fish species is given in Table 2, indicating species richness is more in reservoir compared to stream habitats, due to generalist species (having wider distribution) and species introduced since 1969 for commercial production. On the contrary, endemics having narrow range of distribution were more associated with the western streams. This emphasizes the importance and high conservation values of stream habitats of the Western Ghats.
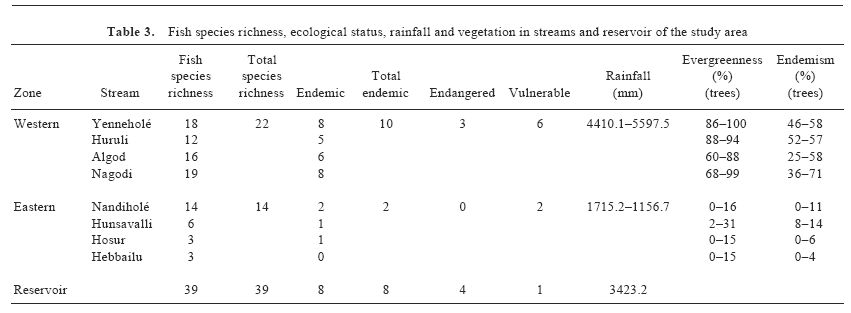
Fish richness, ecological status and vegetation variables: Table 3 details parameters such as fish species richness, endemism, ecological status, forest types and quality in the catchment areas as well as rainfall. There is significant positive correlation between tree evergreenness and tree endemism (r = 0.859, P = 0.003). Evergreen to semievergreen forests have more endemic tree species than deciduous forests. In fact, such forests should have been the natural climax vegetation all over the upper catchment of the Sharavathi River, because of the higher rainfall. A forest-working plan by Rao37 for the Belandur State Forest of Anandapuram (Ananthapur) Range, Shimoga District (in the eastern catchment of Sharavathi River) stated that this region, receiving rainfall of 11301700 mm, had 15% of the forest area under evergreen kans. Nevertheless, during the 19th century and even during the early 20th century, there were substantial patches of evergreen to semi-evergreen kan forests in the central Western Ghats. Investigations by Chandran and Gadgil38, indicate that the kans were sacred forests during the pre-colonial period, when the forest management was decentralized and was under the local community control. Agriculture, fuel-wood collection and cattle grazing through the last many centuries have altered the forests of the eastern catchment26.
Western streams : The western streams, running through rugged terrain, have more of their catchment area under evergreen to semi-evergreen forests. Notable among the evergreen trees (many of them endemics) were Actinodaphne hookeri, Aglaia spp., Beilschmedia fagifolia, Cinnamomum spp., Diospyros spp., Dipterocarpus indicus, Euonymus indicus, Garcinia spp., Holigarna spp., Hopea ponga, Knema attenuata, Litsea spp., Myristica malabarica, Nothopegia colebrookeana, Olea dioica, Palaquium ellipticum, Persea macrantha, Poeciloneuron indicum, Symplocos beddomei and Syzygium spp. These stream catchments have higher evergreenness and higher endemism among the trees.
The catchments of western streams in Yenneholé and Nagodi sub-basins with patches of evergreen forests are rich in endemic tree population (Table 3). Fish diversity and endemism are also highest in these streams. In addition to the evergreens, both these sub-basins have some relic patches of primaeval forests with characteristic endemic trees P. indicum, P. ellipticum and D. indicus. Though the catchment area of the Algod stream is covered more with secondary evergreen to semi-evergreen forests, it has 16 fish species of which six are endemic. Similarly, Huruli stream has 12 fish species of which five are endemic. Endemic fishes like Barilius bakeri, B. canarensis and Schistura spp. are exclusive to the western parts.
The commonly occurring deciduous tree species amidst the evergreen vegetation are Terminalia paniculata, Lagerstroemia microcarpa, Careya arborea, Dillenia pentagyna, Vitex altissima and Ervatamia heyneana. Older individuals represent most of these trees. Except the latter two, which are usually gap-finders, other deciduous species probably appeared in this high-rainfall zone because these forests have had a history of slashand- burn cultivation until the late 19th century39. Banning of shifting cultivation led to the return of the evergreen species. These evergreen species with closed canopy prevented the regeneration of the more light-loving (heliophilous) deciduous trees.
Eastern streams : Catchments of the eastern streams were dominated by deciduous forests. The eastern landscape is much more fragmented with several tree monoculture industrial plantations. Annual rainfall of 15002000 mm here is sufficient to support evergreen to semi-evergreen forests, as described in the historical documents of the Forest Department, dating back to late 19th century and early 20th century. Brandis and Grant40 reported the presence of 171 evergreen to semi-evergreen kan forests covering a total area of over 130 sq. km in the Sorab taluk, Shimoga District, immediate north of our study area, where the annual rainfall is around 1500 mm only. A forest-working plan of 1919 reported the presence of 11.6 sq. km of evergreen kans amidst the otherwise drier forests of the eastern catchment. These kans were reported to be the source of several perennial streams. The kan forests had several en-demic and evergreen tree species such as Vateria indica, Artocarpus hirsuta, Cinnamomum spp. and Litsea spp.37. Even today, enmeshed in the landscape of deciduous forests, agriculture and scrub, occasional small, relic semievergreen forest patches are observable.
Hunsavalli stream catchment in the east is dominated by deciduous forests, with low percentage of endemism (814). However, one of the patches sampled in this catchment, perhaps the remains of an ancient kan, at Gentinakoppa village had 84% evergreenness and 50% tree endemism. The stream had six fish species, of which one was endemic. In Hosur stream catchment, also dominated by deciduous forests, tree endemism varies from 0 to 6%. However, a semi-evergreen forest patch at Aduru had 79% evergreenness and 58% tree endemism. Hosur stream had only three fish species, out of which one was endemic to the Western Ghats. Hebbailu stream catchment had moist deciduous forests, which do not exceed 15% in evergreenness. However, a forest sample at Kallukoppa village had 70% evergreenness with 30% tree endemism, while Hebbailu had only three fish species and no endemic species. We presume from these facts that the eastern streams also could have had more number of endemic fish species in the olden days than the present (only two species). Due to the spread of agriculture and intensified forest removal in their catchments, the forests became drier and the streams turned seasonal26,28, with understandable adverse consequences on fish diversity and endemism.
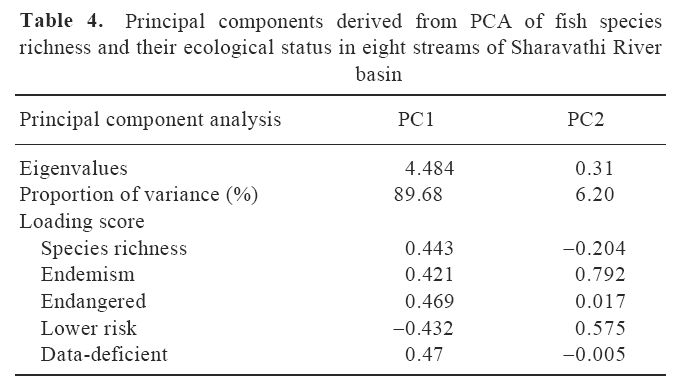
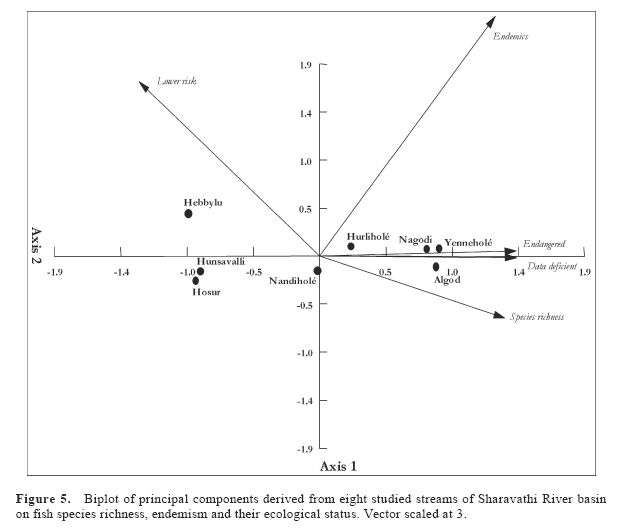
Pearsons correlation coefficient shows that fish species richness was positively related to the number of endemic (r = 0.752, P = 0.016), endangered (r = 0.935, P = 0.001) and data-deficient (r = 0.924, P = 0.001) species. Similarly, endangered fish species increased with an increase in endemic (r = 0.873, P = 0.002) and data-deficient (r = 0.984, P = 0.001) species. Lower risk category had negative influence on richness, endemism, endangered, vulnerable and data-deficient species (r = 0.802, P = 0.008; r = 0.732, P = 0.02; r = 0.889, P = 0.002; r = 0.657, P = 0.039 and r = 0.915, P = 0.001 respectively). Considering ecological status, vulnerability did not show significant relationship, except for lower risk category. Hence, it was removed from further analysis. Since fish parameters were correlated with each other, PCA provided reduced components out of them (Table 4). Principal component 1 (PC1) explained for 89.68% variance comprising species richness, endemism and ecological status, and PC2 for 6.2% contributed by endemism and lower risk category. Biplot of this analysis given in Figure 5, shows distinct clusters of streams from the eastern side versus western side, which conform the results indicating that the streams on the western side have higher species richness, dominated by endemic and endangered species41.
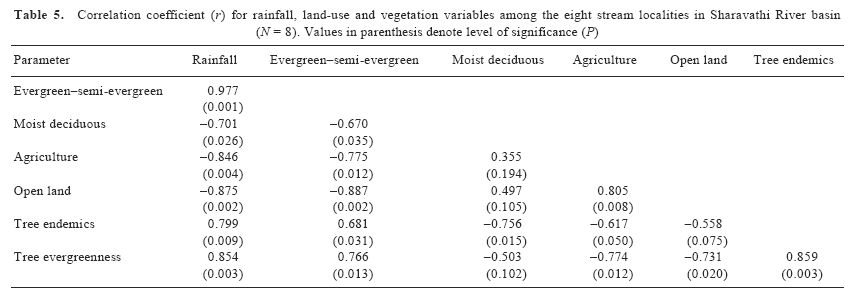
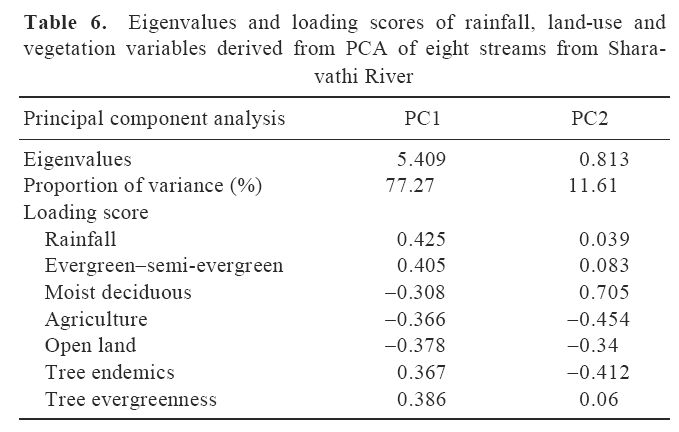
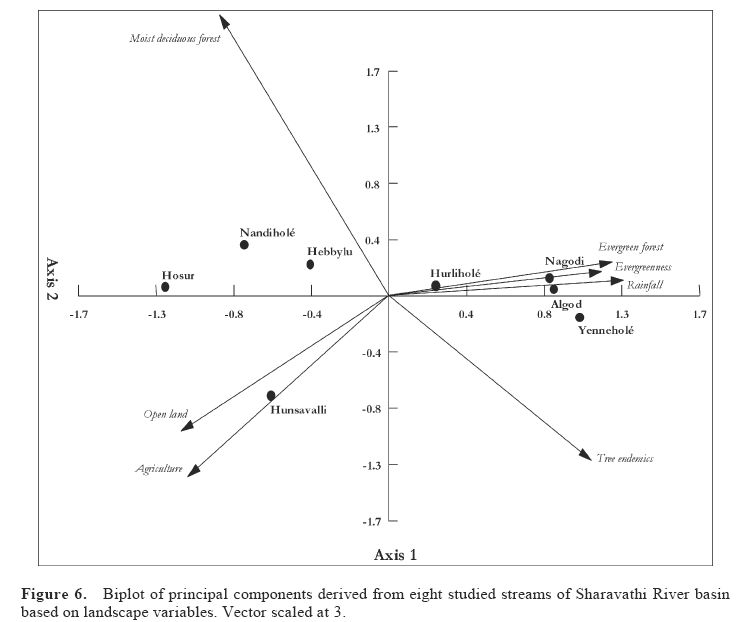
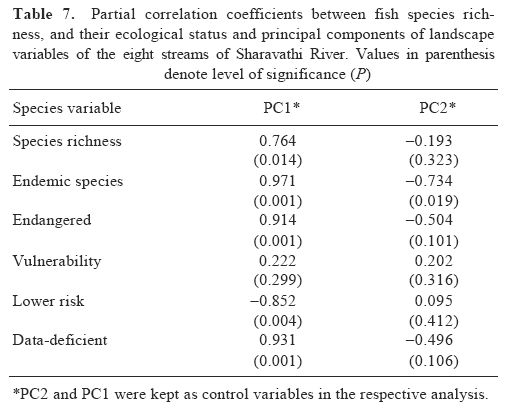
Table 5 lists correlation coefficients highlighting the influence of land-use and vegetation in eight selected stream catchments. Results of PCA are detailed in Table 6, wherein PC1 explains for 77.27% variance from all land scape variables, while PC2 accounts for 11.61% variance, mainly by moist deciduous forest, agriculture and tree endemism. Figure 6 depicts the biplot generated in PCA with score-loading and vectors, and highlights the influence of evergreen to semi-evergreen-type forests, rainfall, tree endemics, and evergreenness on streams on the western side compared to the influence of human-induced landuses (agriculture and open land) and remnants of moist deciduous-type forests on streams located on the eastern side. Partial correlation coefficient (rxyz) was calculated between PC1 and PC2 with fish species richness and their ecological status. Table 7 details the partial correlation coefficient values. It is evident that PC1 (derived from rainfall and landscape variables from dominant land-use with vegetation of evergreen to semi-evergreen-type forests, tree endemics, and evergreenness) has positive influence on fish species richness, endemism, endangered and datadeficient species and has negative influence on the lower risk category. In contrast, PC2 (derived by moist deciduoustype forests) has negative influence on endemic fish species. These analyses substantiate that the perennial streams with their catchments clad in evergreen to semi-evergreen forests and higher levels of plant endemism are the habitats for rich and endemic fish fauna. Linkages of perennial streams, higher rainfall and vegetation type with the regional biodiversity highlight the need for decision makers to adopt landscape approach in the management of natural resources to conserve the hotspots of biodiversity.