Materials and methods |
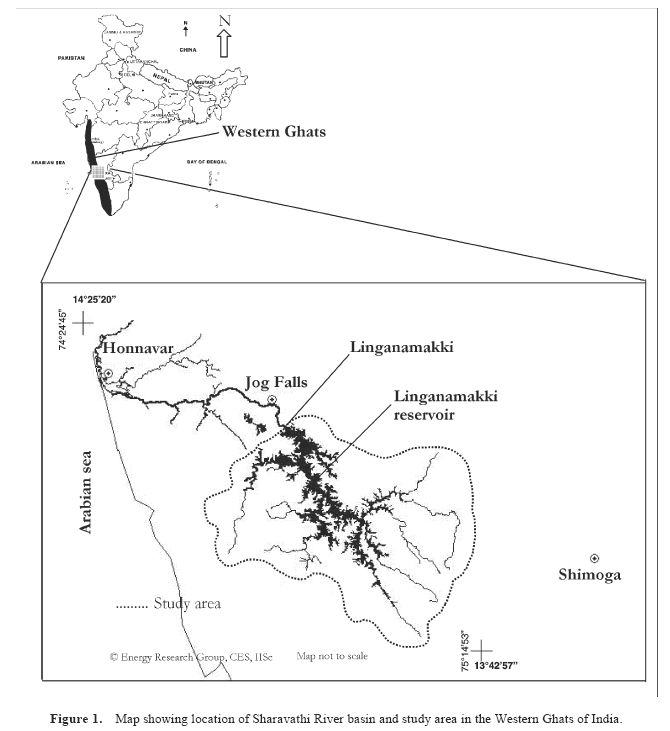
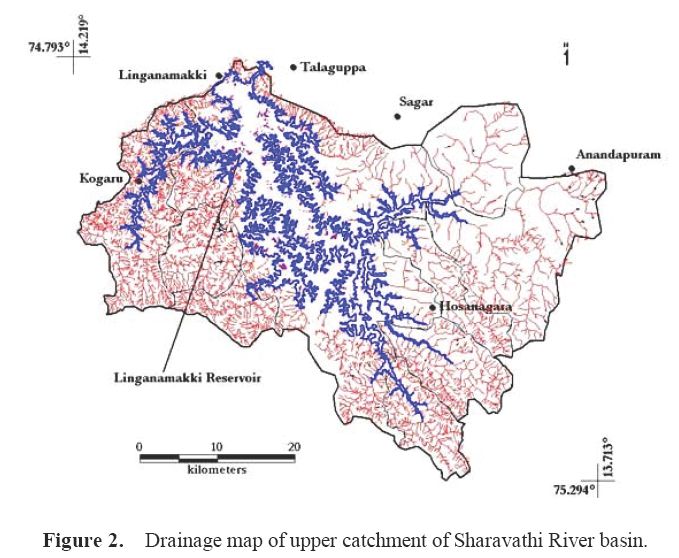
Sharavathi River in central Western Ghats, Karnataka, is a west-flowing river that originates in the hilltops at Ambuthirtha, Thirthahalli taluk, Shimoga District and flows northwest for about 132 km before joining the Arabian Sea near Honnavar town, Uttara Kannada District (Figure 1). The Jog, one of the magnificent waterfalls of India, is situated in the course of this river. We have chosen the upper catchment area (1991.43 sq. km) of Sharavathi River (situated at 74°67¢11²75°30¢63²E and 14°7¢27² 13°77¢08²N, at an average altitude of 512 m) for this study. The water-spread area of Linganamakki reservoir is about 326 sq. km (at full reservoir level), which is sometimes attained during the peak of the rainy season. Several streams (Figure 2) in the western and southern regions of the catchment receiving more rainfall are perennial. Some of the streams drain directly into the reservoir, while others coalesce to form larger streams or tributaries such as Yenneholé, Huruliholé, Nagodiholé, Sharavathi, Hilkunji, Mavinaholé, Haridravathi and Nandiholé. The western and southern streams run through rugged terrain clad in evergreen to semi-evergreen forests, and through narrow valleys lush with areca (betel nut) gardens and paddy fields. The eastern streams flow through gentler topography, presently with moist deciduous forests, agriculture and plantations of forest trees. Rainfall in the east (about 1800 mm), though lesser than the western and southern catchments, nevertheless, is sufficient to support evergreen to semi-evergreen forests, according to the old historical records, and existing patches of relic vegetation. Throughout the catchment, the stream waters are heavily used for cultivation of various crops such as areca nut, spices, paddy, sugarcane, banana and vegetables. This river became a hub of developmental activities ever since the construction of hydroelectric dams. In 1932, a small dam was built at Hirebhaskara (in Sagar taluk). In 1964, a major dam at Linganamakki (74°50¢54²E, 14°14¢24²N, 512 m asl), having a total water-spread area of 326 sq. km was constructed, which submerged the Hirebhaskara dam and the lands belonging to 32 villages. Later, in the 1990s, another dam was built at Gerusoppa, Uttara Kannada, in the downstream of Sharavathi River, affecting 705 ha of primary forests. Earlier studies assessing cumulative impacts in this region have substantiated the human-induced changes and their implications on regional ecology and biodiversity2628.
Implementation of river-valley projects and the consequent immigration of people into the region and resettlement of the dam evacuees (from 32 villages) elsewhere, mainly in the catchment itself, impacted the natural ecosystems26. In addition, this region witnessed intensified selection felling of industrial timbers in the catchmentarea forests, during the 1950s. Conversions of several patches, totalling 188.7 sq. km of natural forests into monocultures of teak (Tectona grandis) and various exotic tree species like Casuarina, Eucalyptus spp., Acacia auriculiformis and Pinus spp. (particularly during the post-independence era), were major ecological changes in the region. Opening up of more areas of forests due to creation of roads and power lines, expansion of agriculture, mining and quarrying would also have had an impact on the waterbodies26,28. Introduction of exotic fishes into the reservoir to boost commercial fish production is also expected to impact the local fish fauna. Apart from these, in the Linganamakki reservoir, several fish species were introduced to boost commercial fish production29.
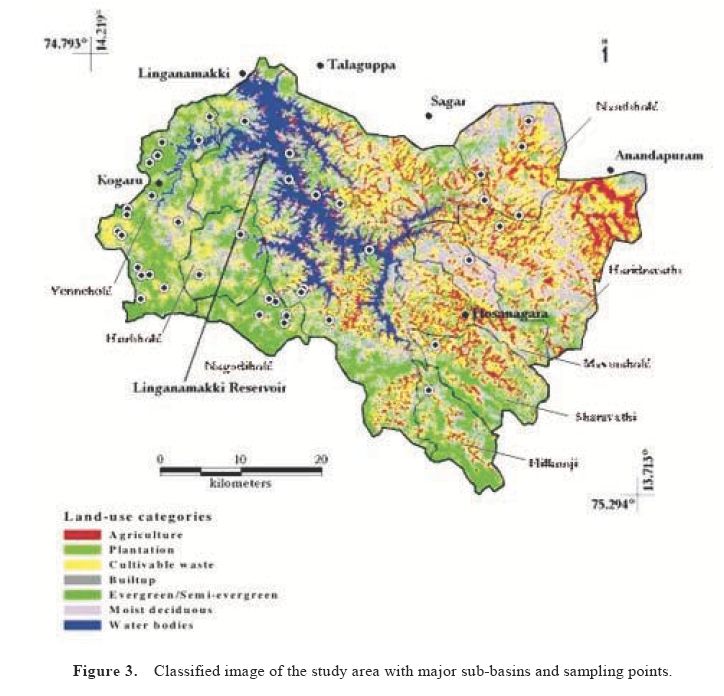
Land-use dynamics was analysed for the catchments of the streams studied for fish using temporal remote sensing data along with collateral data. Integration of remotesensing data with collateral data has been done using Geographic Information System (GIS). Survey of India toposheet of scale 1 : 50,000 (48 J, K, N and O), which covers the Sharavathi River basin were used for digitization of base layers such as regions boundary, vegetation types, forest types and drainage networks. Multispectral data of IRS 1C (Indian Remote Sensing Satellite 1C) with spatial resolution of 23.5 m corresponding to green, red and NIR bands in 0.50.6, 0.60.7, 0.70.9 mm were used for land-use analyses. Satellite imageries of Path 97Row 63, provide the entire image of the Sharavathi catchment region. The temporal data (of two seasons corresponding to the study period) were geometrically corrected taking the location (latitude and longitude) values of known points from the image as well as their corresponding ground values with the help of Survey of India toposheet and ground control points (GCPs) using Global Positioning Systems (GPS). Supervised classification technique based on Gaussian maximum likelihood algorithm was used for land-use analysis. The land-use categories considered were ever green to semi-evergreen forests, moist deciduous forests, plantations, agricultural land and open land.
Fish sampling was carried out from January 2002 to August 2004 in 41 localities (Figure 3) representing the eastern and western streams and the Linganamakki reservoir. Stratified random sampling method was adopted to locate the sampling sites considering the stream densities. Overall, 261 samplings were made with approximately 40 samplings per season (summer, winter and monsoon) in all the important aquatic microhabitats (riffles, pools, cascade, falls, embayment, run, backwater, etc.) using gill nets, cast nets, dragnets, and hooks and lines of varying dimensions. Standard keys3033 were followed for species identification.Unidentified fish specimens were preserved and subsequently identified at the Zoological Survey of India, Southern Regional Station, Chennai.
In order to understand the linkages between terrestrial vegetation and stream-fish distribution, eight stream localities were selected among the 41 sampling localities in which sampling was carried out using cast net, drag net and gill net to maximize fish diversity. Vegetation sampling was carried out in the catchment of these streams.
A combination of transects and quadrat method was used for tree sampling within the stream catchments. Five quadrats, each of 400 sq. m, were laid alternatively along the sides of the transect, keeping an inter-quadrat distance of 20 m. In each quadrat, trees (³30 cm girth at 130 cm above ground) were recorded species-wise. Thereby we could gather data on the actual number of trees in each quadrat, the species to which they belong, and their girth. The transect data were used to estimate the number of trees per ha in a given patch of vegetation. Trees were categorized as evergreen and deciduous (palms excluded). The percentage of evergreen trees in the sample has been expressed as evergreenness. The total endemic tree population in each sample was estimated and the same has been expressed as the percentage of endemism.
Analysis of variance (ANOVA) was carried out to test the significance of variance among rainfall zones. As data pertaining to fish species richness and ecological status measures (i.e. endemic, endangered, vulnerable, lower risk and data deficient status)15 and landscape variables were not normally distributed, they were transformed into loge and those values with zero into loge + 1. These data were first analysed for Pearsons correlation coefficient (r) to find the linear relationship between them. In order to reduce the number of landscape variables, Principal Component Analysis (PCA) of the transformed data was performed. Partial correlation coefficients were calculated between principal components with fish species richness and ecological status, to understand the influence of landscape variables on them.