Changing composition of USW and its impact
The composition of the wastes generated both at the residence levels as well as the city level has changed significantly over the last two decades. Tables 1 and 2 show the municipal solid waste generation and physical composition of Bangalore wastes collected from different types of waste generators. Municipal waste recorded, comprises of wastes generated from residences, markets, hotels and restaurants, commercial premises, slums, street sweepings and parks. Residences contribute 55% of total of wastes, which is highest among all sources (TIDE, 2000). Waste generated from hotels and eateries form about 20%, fruit and vegetable markets contribute about 15%, trade and commerce about 6% and from street sweeping and parks about 3%, . The slum areas contribute only 1% of total, since in Bangalore slum population and area is low in comparison to other city town. Table 2 shows the waste composition of Bangalore comprising: 72% fermentables, 11.6% paper and cardboard, 1.01% cloth, rubber, PVC and leather, 1.43% glass, 6.23% polythene, 0.23% metals and 6.53% of dust and sweeping.
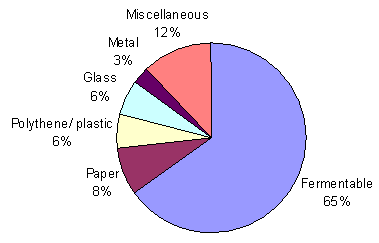
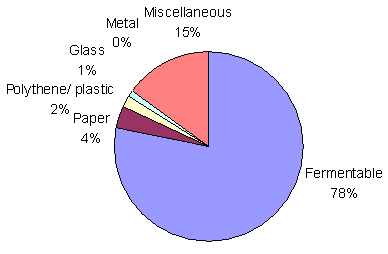
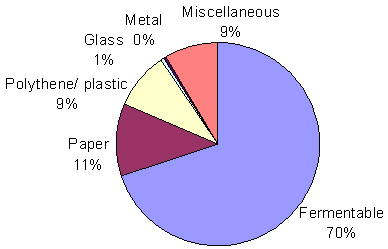
Bangalore’s waste is characterized by a high content of fermentable components (72%). These wet and fermentable waste, require daily removal from places of generation. In a decentralized system, wastes gathered from primary collection by handcarts may be subject to immediate treatment by aerobic composting or biomethanation within the locality or ward. This will avoid transportation costs of around Rs1000-1500/t and thus will be more sustainable and economic. In the past a significant component of the wastes placed in open street bins were rapidly sought by rag-pickers who removed the recyclables. The impact of this is presented in Figures 1a, 1b and 2, which show that the percentage of organic waste will quickly increase in MSW from primary collection point to the time it reaches the dump site due to multilevel recovery of recyclable wastes. This also changes the extent of decomposable C of the wastes and presents various forms of environmental implications (Chanakya and Sharatchandra, 2005). As the wastes gradually becomes enriched easily decomposable material, it also becomes easily amenable to anaerobic fermentation processes that convert the carbon to CO2 and CH4, the latter being a greenhouse gas of interest. From 1988 to 2000 there is reasonable change in waste composition: fermentable, paper and plastic has increased by 7%, 3% and 0.2%, respectively.
Table 1: MSW generation in Bangalore
| Source |
Quantity (t/d) |
Composition (% by weight) |
| Domestic |
780 |
55 |
| Markets |
210 |
15 |
| Hotels and eatery |
290 |
20 |
| Trade and commercial |
85 |
6 |
| Slums |
20 |
1 |
| Street sweeping and parks |
40 |
3 |
| Source: Chanakya and Sharatchandra, 2005 |
Table 2: Physical composition of MSW in Bangalore
| Waste type |
Composition (% by weight) |
| Domestic |
Markets |
Hotels and eatery |
Trade and commercial |
Slums |
Street sweepings and parks |
All sources |
| Fermentable |
71.5 |
90 |
76 |
15.6 |
29.9 |
90 |
72 |
| Paper and cardboard |
8.39 |
3 |
17 |
56.4 |
2.49 |
2 |
11.6 |
| cloth, rubber, PVC, leather |
1.39 |
|
0.33 |
3.95 |
0.54 |
0 |
1.01 |
| Glass |
2.29 |
|
0.23 |
0.65 |
8.43 |
0 |
1.43 |
| Polythene/plastics |
6.94 |
7 |
2 |
16.6 |
1.72 |
3 |
6.23 |
| Metals |
0.29 |
|
0.26 |
0.38 |
0.23 |
0 |
0.23 |
| Dust and sweeping |
8.06 |
|
4 |
8.17 |
56.7 |
5 |
6.53 |
| Source: TIDE, 2000 |

Figure 1a: Composition of USW immediately after being places in bins (Rajabapaiah, 1988)

Figure 1b: Composition of USW after ragpickers sort and recycled materials (Rajabapaiah, 1988)

Figure 2: Composition of USW found at the dumpsites (TIDE, 2000)
|

