 |
Wind Energy Potential in Karnataka, India
Ramachandra T.V.* and Shruthi B.V.+ |
 |
*Energy Research Group, Centre for Ecological Sciences, Indian Institute of Science, Bangalore 560012, India
+Centre for Sustainable Technologies (ASTRA), Indian Institute of Science
+Centre for Sustainable Technologies (ASTRA), Indian Institute of Science
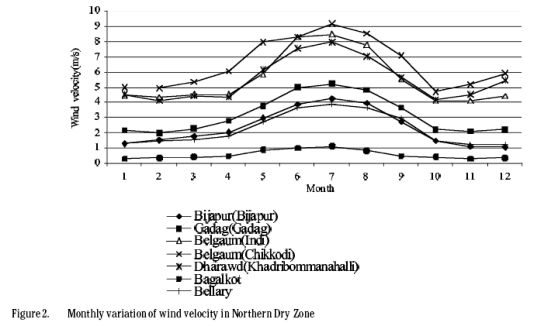
RESULTS AND DISCUSSION Wind potential analysis across agro-ciimatic zone confirms the role of geographic, topographic and meteorological characteristics of a location to wind speed variability. Table 2 lists locations in the respective agro-ciimatic zones with mean wind speed greater than 18kmper hour (i.e. >5 m/s) [4].Among these sites, wind energy generators totaling a capacity of 3.5 MWhave been functional since 1998-99at Chikodi. Figure 2 depicts monthly variations across Northern dry zone
|
||||||||||||||||||||||||||||||||||||||||||||||||||||||||||||||||||||||||||||||||||||||||||||||||||||