|
Results and Discussion
Figure 2 provides the landuse details for Delhi (1977, 1992, 1998 and 2010) and Mumbai (1973, 1992, 1998 and 2009) and Table 1 shows the accuracy assessment for all the images. Table2 gives temporal land use details for both cities. Figure 3 shows the Delhi and Mumbai land-use statistics from 1970’s to 2010’s. The percentage of water bodies have decreased in Delhi from 1977 to 2010 i.e., 1.7% to 0.58% and for Mumbai 1973 (4.25%) and 2009 (4.06%).
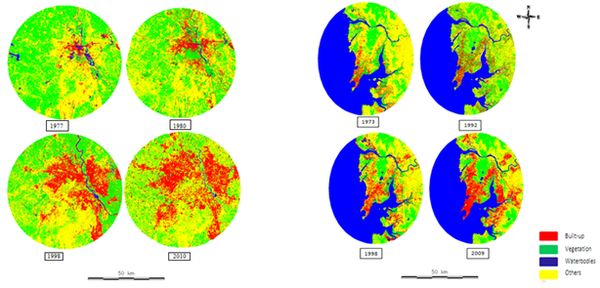
Figure 2: Land use of Delhi (1977, 1980, 1998 and 2010) and Mumbai (1973, 1992, 1998 and 2009).
Table 1: Accuracy assessment of classified images
| Cities |
1970s |
1980s |
1990s |
2000s |
| OA |
|
OA |
|
OA |
|
OA |
|
| Delhi |
89 |
0.9432 |
99 |
0.9957 |
97 |
0.9887 |
88 |
0.7163 |
| Mumbai |
73 |
0.9471 |
98 |
0.8115 |
99 |
0.8225 |
99 |
0.8193 |
Table2: Landuse statistics of Delhi and Mumbai
| Delhi (year) |
Built-up |
Vegetation |
Water bodies |
Others |
| Area (sq.km.) |
Area (%) |
Area (sq.km.) |
Area (%) |
Area (sq.km.) |
Area (%) |
Area (sq.km.) |
Area (%) |
| 1977 |
105.3 |
3.60 |
1120. |
38.3 |
49.7 |
1.70 |
1650 |
56.4 |
| 1980 |
283.3 |
9.71 |
1115. |
38.2 |
26.3 |
0.90 |
1492 |
51.1 |
| 1998 |
580.8 |
19.8 |
918.6 |
31.3 |
43.0 |
1.47 |
1383 |
47.2 |
| 2010 |
733.2 |
25.0 |
603.1 |
20.6 |
17.0 |
0.58 |
1572 |
53.7 |
| Mumbai (year) |
Built-up |
Vegetation |
Water bodies |
Others |
| Area (sq.km.) |
Area (%) |
Area (sq.km.) |
Area (%) |
Area (sq.km.) |
Area (%) |
Area (sq.km.) |
Area (%) |
| 1973 |
107 |
5.23 |
636 |
31.04 |
87.1 |
4.25 |
1220 |
59.49 |
| 1992 |
261 |
12.77 |
780 |
38.06 |
83.9 |
4.18 |
924 |
44.99 |
| 1998 |
327.7 |
15.98 |
724 |
35.3 |
98 |
4.8 |
899 |
43.87 |
| 2009 |
493 |
24.06 |
574 |
28.01 |
75.3 |
4.06 |
907 |
43.87 |
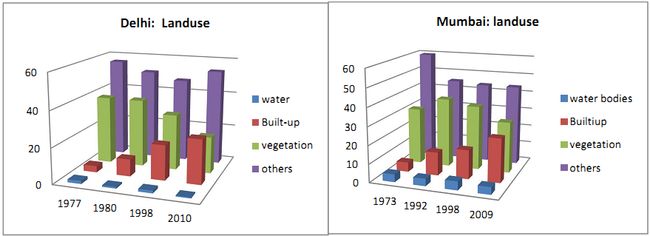
Figure 3. Delhi and Mumbai temporal landuses
The classified images of Delhi (2010) and Mumbai (2009) are draped on the DEM (SRTM) images to show the urbanization process with respect to terrain. Figure 4 clearly indicates that flat surfaces have major human activities than highly elevated surfaces. The NVIZ module GRASS gis is used to visualize the 3D view of the draped image. Figure 5 represents the extraction of water bodies of four decades for Delhi and Mumbai.

Figure 4: Land use of Delhi (2010) and Mumbai (2009) draped on Digital Elevation model (DEM)

Figure 5: Extraction of water bodies for Delhi and Mumbai
Watershed analysis helps in assessing the catchment conditions of water bodies which will be useful for conservation of water and natural resources. The DEM image is used to delineate the drainage network. In which elevation values are taken as the input to create the flow direction as well as the flow accumulation map across the landscape. The Yamuna basin covers almost the Delhi region and survives as the major source of water. The fig 6 shows the overlay of water bodies of Delhi (1977 and 2010) and Mumbai (1973 and 2009) on the drainage network extracted from DEM data represents the temporal variation of wetlands.
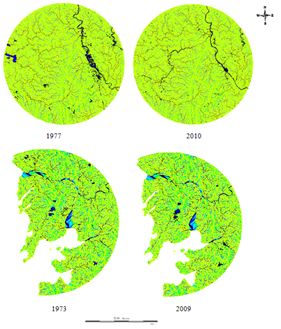
Figure 6: Water bodies with drainage networks of Delhi (1977 and 2010) and Mumbai (1973 and 2009)
Estimation of Land surface temperature depicted the Delhi’s temperature for urban category 21°C, vegetation 15°C, water bodies 10°C and others category 22°C. Similarly, Mumbai temperature map showed 30°C for urban category, 21.5°C for vegetation, 18.3°C for water bodies and 27°C for other category as shown in figure 7. Temporal analysis indicates that urbanization process resulting in decline in the water bodies has contributed to enhanced ambient temperatures.
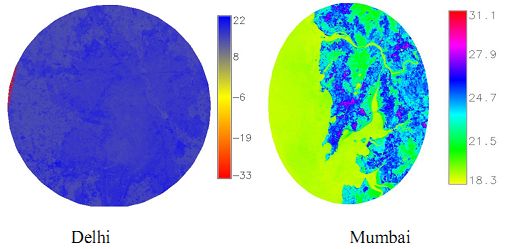
Figure 7: Land surface temperature for Delhi and Mumbai
|
