|
ABSTRACT
Solar energy incident on the earth’s surface primarily depends on parameters like geographic location, earth-sun movements, tilt of the earth’s rotational axis and atmospheric attenuation due to suspended particles. The intensity of solar energy/insolation quantifies the solar resource potential or availability of a region. A techno-economic analysis of the solar power technologies and a prospective utilization of wasteland in each state demonstrate their immense power generation as well as emission reduction potential.Karnataka and Kerala are the neighbouring states located in south India which receive the annual average solar insolation over 5.5 KWh/sq.m/day. Since both the states are power deficit states where the annual energy consumption is more than the energy generated. Kerala state is located in Malbar coast which is a part of western coast of the country, which has a good potential for solar energy harvesting. Karnataka has a mixed geographical area including Konkan coast and Western Ghats with a very good solar potential. State witnessed for major power crisis from last few years and hence power harvesting from renewable energy sources could be the solution for this problem. Since both the states have similar energy using culture and increasing power mismatch every year, scope for solar energy is prominent. Also states have very good potential and favoring energy policies for various solar energy harvesting methods such as roof top solar photovoltaic plants, grid connected plants in wasteland, decentralized wind-solar hybrid plants, off grid solar plants etc.
Keywords: Renewable sources, Energy, Solar Energy, Wastelands
INTRODUCTION
Sun is the largest known energy source. From thousands of years human civilization is harvesting energy from Sun. So the solar energy is has affected the energy consumption methods worldwide. Solar energy is received in the form of radiation or electromagnetic radiations. Broadly solar radiations are classified as Direct, diffused and global radiations. These radiations have the immense power which is sufficient for the human race on the earth’s surface. But harvesting and conversion of solar energy according to our application is a challenging aspect or sometimes it may be uneconomical also. But various studies have shown that solar energy utilization is economic, environmental friendly and profitable also. Conversion of solar energy into electrical energy is the better way to use the solar radiation effectively since electrical energy is one of the basic needs and easily convertible to other forms of energy (Ramachandra 2000; 2003; 2011).
Karnataka and Kerala (India) states are dependent mainly on conventional (nonrenewable) energy source such as coal, diesel, gas and hydro energy. Only 4% of the total installed plant capacity is based on renewable energy sources in Kerala (24% in Karnataka). Though both the states get very good solar insolation solar energy utilization is not remarkable. Since both states facing the electricity deficit problem, solar energy harvesting could lead to the solution. This paper discusses the electrical energy harvesting from solar energy in the available wastelands in the states.
Current Electrical Energy Consumption Scenario in Karnataka and Kerala:
Karnataka is the 9th most populated state in the country with a population density of 320/km2. It is also one of the most electrical energy consuming states with an annual consumption of 36975.2 Million KWh (2010-11). Per capita consumption is around 604 KWh (Ramachandra 2012). Though state has total installed plant capacity of 13490.63 MW, state is an electrical energy deficit state. Table 1 gives the sector wise electrical energy consumption in Karnataka.
Table 1: Present electrical energy demand in Karnataka in MU
| Year |
2010-11 |
| Domestic |
8280.84 |
| Commercial |
5018.51 |
| Agriculture /Irrigation |
12435.2 |
| Industry |
8442.11 |
| Others |
2798.54 |
| Total |
36975.2 |
(Source: Annual Report 2011-12 onthe WorkingofState Power Utilities&Electricity Departments by Planning Commission, Govt. of India.)
Figure 1 gives the sector wise electrical energy consumption in 2010-11. Agricultural and Irrigation pump sets tops the consumption with 34% (12435.34 Million KWh), followed by industrial sector with 23% (8442.11 Million KWh), domestic with 22% (8280.84 Million KWh) respectively. Commercial sector consumes 14% (5018.51 Million KWh).
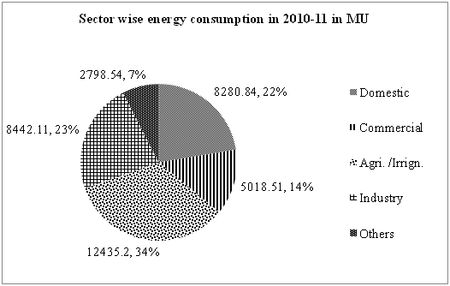
Figure 1: Sector wise share of electric energy consumption (2010-11)
Kerala is one of the small states (Area rank: 21st) of the country having population of 3,33,87,677 (Population rank: 12th). State population density is 860/km2 and the per capita electrical energy consumption is 426 KWh. Present electrical energy consumption in the state is 14226.1 MU.Table 2 gives the sector wise electrical energy consumption in Kerala.
Table 2: Present electrical energy demand in Kerala in MU
| Year |
2010-11 |
| Domestic |
6713.07 |
| Commercial |
1800 |
| Agriculture /Irrigation |
257 |
| Industry |
4565 |
| Others |
891 |
| Total |
14226.1 |
(Source: Annual Report 2011-12 on The Working of State Power Utilities & Electricity Departments by Planning Commission, Govt. of India.)
Figure 2 gives the sector wise electrical energy consumption in 2010-11. Electricity consumption for households has the highest share (47 %), followed by consumption in industrial sector (32%) and commercial purpose (6%). Consumption by agricultural and irrigation pumps has the least share (2%).
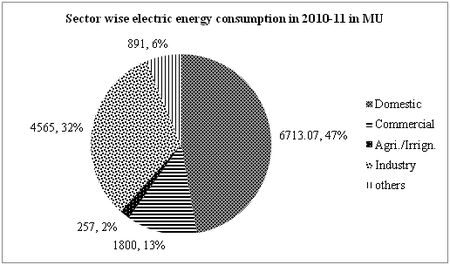
Figure 2: Sector wise share of electrical energy consumption (2010-11)
SHARE OF ENERGY SOURCES AND INSTALLED PLANT CAPACITY IN KARNATAKA AND KERALA:
Figure 3 gives the share of energy from various sources. This shows that coal powered thermal power generation constitutes a major share (45%), followed by hydropower (27%) and renewable sources of energy (Renewable Energy: RE) sources (24%). Diesel and nuclear energy sources supply a small share of 4% (2% by each source).
Figure 4 shows the share of energy resources in total installed plant capacity. Hydro electric plants top the share with 49% followed by coal based plants (23%), gas fueled thermal plants (14%) and diesel power plants (7%). Renewable energy (RE) and nuclear sources constitutes 4% and 3% respectively.
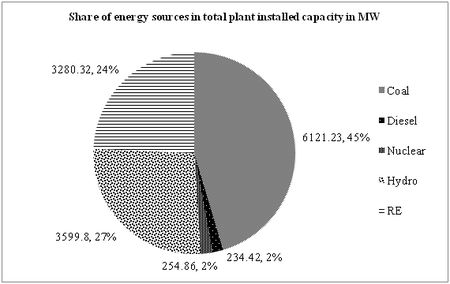
Figure 3: Share of various energy sources in total installed plant capacity
(Source: http://www.cea.nic.in/reports/monthly/inst_capacity/jul12.pdf)
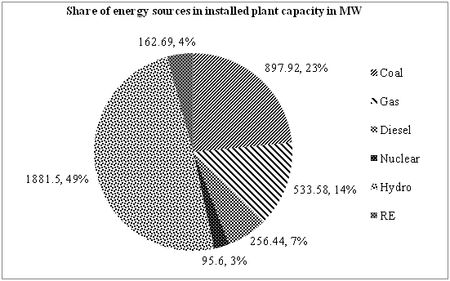
Figure 4: Share of energy resources in total installed plant capacity in MW
(Source: http://www.cea.nic.in/reports/monthly/inst_capacity/jul12.pdf)
Figure 3 and 4 illustrates that the utilization of renewable energy resources is lesser compared to conventional energy resources. Kerala uses only 4% and Karnataka uses 24% of renewable energy sources though both the states have enough potential. Coal and uranium (nuclear) based power plants produce large amount of polluting byproducts. Switching the dependency from these plants to the renewable energy (solar energy) based plants could control the environmental pollution.
SOLAR ENERGY UTILIZATION:
Solar energy is used as both Grid interactive system and as off grid solar system in both the states. Karnataka has 6MWp grid interactive system and 29.41 KWp capacity standalone solar power plants. Kerala has 25KWp grid interactive system and 44.7KWp capacity standalone solar power plants. Utilization of solar energy systems are given in Table 3.
Table 3: Solar energy utilization as on 31.03.2011
| Karnataka |
- As grid interactive system: 6MWp
|
|
- As Standalone solar systems - Solar Photovoltaic (SPV): 29.41KWp
|
Street lighting 2694 in no.s
SPV pumps 551 no.s
House lighting 36134 in no.s
Solar lantern 7334 in no.s
Solar cookers 253 in no.s
Power plants 255.41KWp |
| Kerala |
- As grid interactive system: 25KWp
|
|
- As Standalone solar systems - Solar Photovoltaic (SPV): 44.7KWp
|
Street lighting 1090 in no.s
SPV pumps 810 no.s
House lighting 32326 in no.s
Solar lantern 41181 in no.s |
(Source: India Energy Book 2011. Energy Statistics 2012 (19th Issue), Central Statistics office Ministry of statistics and Programme Implementation Government of India New Delhi)
SCOPE FOR SOLAR ENERGY IN KARNATAKA AND KERALA:
Karnataka and Kerala get an annual average solar insolation of 5.55 KWh/m2/day and 5.59 KWh/m2/day respectively (Ramachandra, 2003: 2011). These states have very good solar potential and favorable Government policies towards solar energy utilization. Figure 4 and 5 give the districts wise average insolation in Karnataka and Kerala annually.
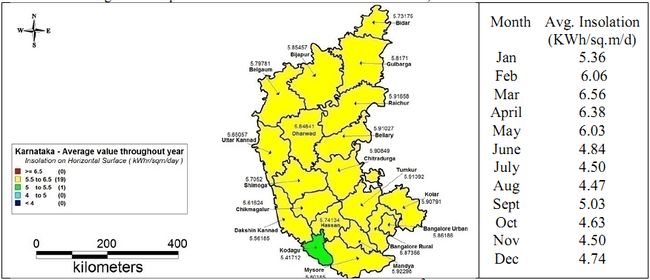
Figure 4: Average annual solar insolation (KWh/m2/day) in Karnataka
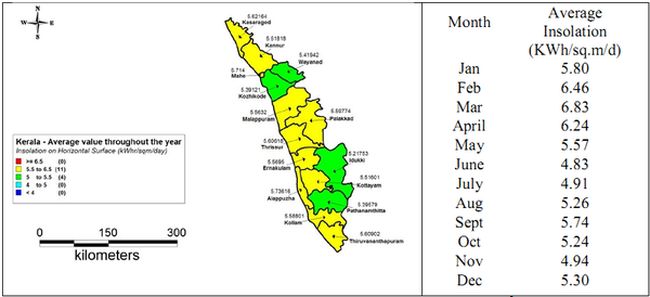
Figure 5: Average annual solar insolation in Kerala in KWh/m2/day
(Source: Surface meteorology and Solar Energy Data Set. (http://eosweb.larc.nasa.gov/sse/RETScreen/))
WASTE LAND AND BARREN LAND AVAILABLE:
Table 4 gives the available wasteland and barren land in both the states. Percentage of wasteland in Total Geographical Area (TGA) is almost same in both the states i.e. 6.79% (13030.62 km2) in Karnataka and 6.29% (2445.63 km2) in Kerala. Karnataka has total barren lands of 1035.97 km2 (0.54% of TGA). Total unproductive barren land in Kerala is about 323.27 km2 (0.83% of TGA). These waste lands (barren lands) can be used to generate electrical energy from solar energy (using solar PV system).
Table 4: Available wasteland and barren land in km2
| State |
TGA in km2 |
WL (NRSC) in km 2 |
% of WL in TGA |
Barren Land* in km2 |
% of Barren land in TGA |
% of Barren land in WL |
| Karnataka |
191791 |
13030.62 |
6.79 |
1035.97 |
0.54 |
7.95 |
| Kerala |
38863 |
2445.63 |
6.29 |
323.27 |
0.83 |
13.22 |
(Source: Wastelands Atlas of India 2011)
SOLAR ENERGY GENERATION USING WASTELAND:
Using solar photovoltaic (SPV) cells solar radiation can be converted into direct current (DC) electrical power using photo-electric effect.
Karnataka has a total wasteland area of 13030.62 km2. Electric energy could be developed in that area is 5785.59 MU/day. Annual electrical energy generated in that area is about 21,11,742 MU. By considering the 2% of wastelands (260.61 km2) annual electricity generated is about 42,233 MU. This shows that the electricity generated would be at least 1.14 times higher than the present demand (36975 MU).
Figure 6 shows the month wise electric energy that could be generated using wastelands of 260.61 sq.km (2% of wasteland area or 25.1% of the barren lands) and the montly average demand. It also gives the wastelands required (1.2%, 156.36 km2) to generate sufficient electrical energy which could meet the present demand (36975 MU).
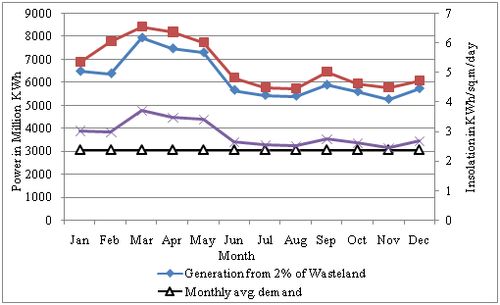
Figure 6: Electric power generation from wasteland with monthly average demand and average insolation
Kerala has a total wasteland area of 2445.63 km2. Electric energy could be developed in that area is 1093.68 MU/day. Annual electrical energy generated in that area is about 3,99,195 MU. By considering the 4% of wastelands (73.36 km2) annual electricity generated is about 15,967 MU. This shows that the electricity generated would be at least 1.12 times higher than the present demand (14226.1 MU).
Figure 7 shows the month wise electric energy that could be generated using wastelands of 56.25 km2 (2.3% of wasteland area or 17.4% of the barren lands) and the monthly average demand. The estimate shows that the electricity generated would be sufficient to supply the present demand (14226.1 MU).
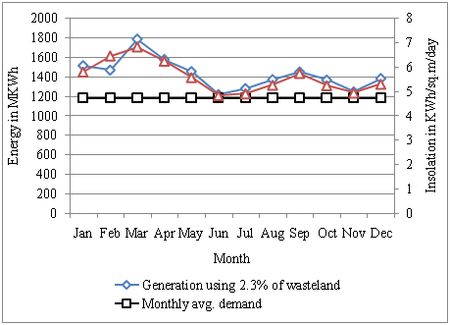
Figure 7: Electric power generation from wasteland with monthly average demand and average insolation
CONCLUSION
Harvesting of solar energy in waste land (barren land) could meet the present as well as future demand in both the states. Since solar energy is cleaner and renewable source pollution and energy deficiency problems can be eliminated. Solar energy systems can be decentralized and roof mounted which enables the remote area electrification and yhus reduces the load on a central power grid. Solar energy grids may also supply the conventional grid and can become a frofitable venture in down the line.
ACKNOWLEDGEMENT
We are grateful to the Ministry of Environment and Forests, Government of India and Indian Institute of Science for the Financial and infrastructure support. We thank GauthamKrishnadas and Rishabh Jain for the assistance in estimating the solar potential for all states in India.
REFERENCES
-
Ramachandra, T.V., 2000. Energy Alternatives: Renewable energy and energy conservation technologies, Karnataka Environment Research Foundation, Bangalore.
-
Ramachandra, T.V. 2003. Ecologically Sound Integrated Regional Energy Planning, Nova Science Publishers, Huntington, NY 11743-6907.
-
Ramachandra T V, Rishabh Jain, GauthamKrishnadas, 2011. Hotspots of solar potential in India, Renewable and Sustainable Energy Reviews 15 (2011) 3178–3186, doi:10.1016/j.rser.2011.04.007.
-
Ramachandra T V, 2012. Renewable Energy: Prospects and Challenges, DEEKSHA: Biannual Journal of Social Work, 10(1):5-26
-
Ramachandra T V, 2011. Renewable energy transition: Perspective and Challenges, In: Energy India 2020- A Shape of Things to come in Indian Energy Sector, Saket Projects Ltd., Ahmedabad, Pp:175-183
|
