|
RESULTS AND DISCUSSION
GROWTH AND LIPID CONTENT OF NITZSCHIA SP. IN WCg MEDIA CONTAINING DIFFERENT NITROGEN SOURCES
Nitzschia sp. obtained maximum cell growth in media containing sodium nitrate as the nitrogen source as shown in Table 01. It was observed that nitrogen source had a significant effect on the growth rate of Nitzschia sp. The maximum growth rate was high in media containing sodium nitrate as nitrogen source (0.14 ± 0.02) compared to media containing urea (0.067 ± 0.001).
Table 01: Cell abundance in Nitzschia sp. across nitrogen sources
| Hours |
Sodium nitrate
(104 cells/ml) |
Urea (104 cells/ml) |
| 0 |
2.60 |
2.60 |
| 24 |
3.07 |
3.01 |
| 48 |
3.19 |
3.05 |
| 72 |
3.38 |
3.12 |
| 96 |
3.87 |
3.33 |
| 120 |
5.30 |
3.71 |
| 144 |
5.31 |
3.89 |
| 168 |
4.91 |
3.53 |
The difference in cell density of Nitzschia sp. with relation to nitrogen source is shown in Table 01. As shown in Figure 01 urea can only support poor growth rate of (0.041 ± 0.0018) of Nitzschia sp. under the given experimental conditions. On the other hand, sodium nitrate proved to be a better nitrogen source than urea as high cell density (5.30 x 10⁴ cells ml-1) in media containing sodium nitrate was observed. The maximum cell density (5.31x10⁴ cells ml-1; Figure 01) occurred 144th hour after inoculation in both the tested sources and thereafter it showed a gradual decline (4.91x10⁴ cells ml-1) in cell density.
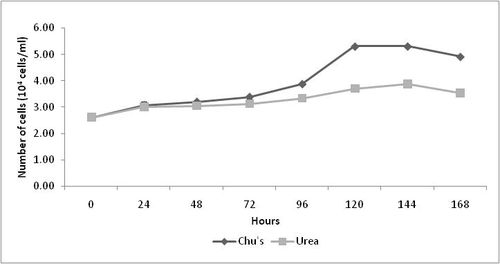
Figure 01: Maximum cell density and specific growth rate of Nitzschia sp. in media containing sodium nitrate and urea
LIPID ANALYSIS:
The total lipid content of Nitzschia sp. cultivated in media consisting of sodium nitrate was observed to be higher than that of urea except on the 96th hour (0.58 g L-1 in sodium nitrate and 0.45 g L-1 in urea) of culture (Table 2). The difference in lipid content of Nitzschia sp. grown in both urea and sodium nitrate are shown in Table 2 and Figure 2. The lipid content was high (1.29 gL-1 for sodium nitrate and 1.09 gL-1 for urea) in the stationary phase of culture in both the cases. The change in lipid content was high in media containing sodium nitrate than urea with a minimum difference. de la Pena (2007) found that the lipid content ranged from 26.4 to 81.5 % DW in Amphora sp. due to change in media composition. These values are several orders of magnitude higher than those reported (0.404 gL-1 – 1.29 gL-1) in the present study. This is a good indication that lipid content may be enhanced by nutrient stress rather than change in nutrient source.
Table 02: Total lipid content of Nitzschia sp. cultivated in media consisting of sodium nitrate or urea
| Hours |
Sodium nitrate (gL-1) |
Urea (gL-1) |
| 0.00 |
0.39 |
0.39 |
| 24.00 |
0.40 |
0.34 |
| 48.00 |
0.44 |
0.32 |
| 72.00 |
0.58 |
0.45 |
| 96.00 |
0.61 |
0.69 |
| 120.00 |
1.01 |
0.97 |
| 144.00 |
1.29 |
1.05 |
| 168.00 |
1.13 |
0.76 |
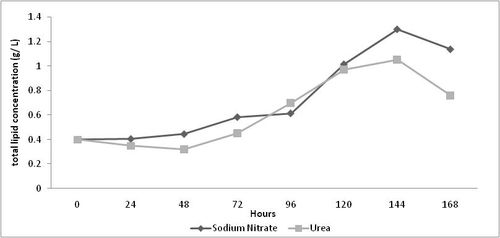
Figure 02. Change in total lipid content of Nitzschia sp. grown in media consisting of sodium nitrate or urea
The results showed that sodium nitrate was the most favourable nitrogen source for the cell growth and lipid production of Nitzschia sp. Sodium nitrate was selected to represent nitrate because it is less costly than potassium nitrate, forms the component of almost all media compositions and it would be an advantage in industrial purpose (Li et al, 2008). In a direct comparison of nitrogen sources, sodium nitrate was found to be superior to urea. This observation is in agreement with the work of Li et al., (2008) they observed that sodium nitrate was the best nitrogen source for Neochloris oleoabundance for both cell growth and lipid accumulation.
RAMAN MICROSCPECTROSCOPY
Figure 04 represents the change in the lipid component in the nitrogen source Urea. As seen in the figure, 3000 cm-1 shows the peak which is very distinctive from the rest of the peaks. The lipid bands from ~1000 cm-1 - ~500 cm-1 show a marked variation. Table 04 shows the raman band assignments that were followed.
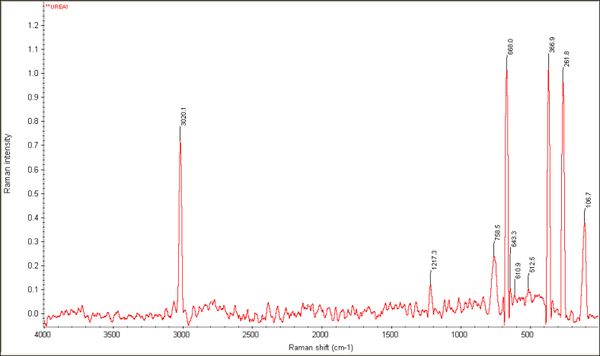
Figure 04: Raman spectral acquisition of lipid sample
Table 04: RAMAN band assignments
| Wave number values |
Assignments |
| ~1670 |
C=O of chla, amide 1 of protein |
| ~1605 |
CC chla |
| ~1525 |
C=C beta carotene |
| ~1495 |
C-C, CH3 chla |
| ~1327 |
-CN, -CH chla |
| ~1187 |
-CH, -N-C chla, -CH beta carotene |
| ~1157 |
-CC, CH beta carotene |
| ~915 |
-N-C-C chla, -C-C-C chla |
| ~744 |
-H-C-O chla, -C-C-C- chla |
|
