|
RESULTS AND DISCUSSION
1. The Effect of Salinity on the Growth Rate of Microalgae
The three microalgae viz., Chlorococcumsp., Microcystis sp. and Chaetocerossp., were isolated and cultured in BBM media, BBM media and f/2 media respectively for a period of 7 days. Varying salinity levels were given to check for the difference in cell growth in each of the treatments.
Chlorococcum sp.: As seen in figure 1, in case of 0.2 ppt, the cell growth doubled (12404 x 102 cells/ml) on 4th day and a hence after a sudden decrease in the cell growth was recorded. For the control i.e., for 1 ppt, the cell growth was found to be maximum on the 2nd day (9828 x 102 cells/ml), a slight decrease was seen on 3rd day. The cell count also decreased from 5th day like the first treatment. For 2 ppt, the cells showed an increase on 6th day (12638 x102 cells/ml).
Microcystis sp.: As seen in Figure 1, in case of 0.2 ppt, the cell growth is seen to be highest on 3rd day i.e., 1824 x102 cells/ml and the lowest was seen on 7th day with 200 x 102 cells/ml. For control i.e., 1 ppt, maximum cell growth of 1172 x 102 cells/ml and minimum of 56 x 102 cells/ml was recorded on 2nd and 7th day respectively. A similar trend was found in the treatment with 2 ppt, maximum was found on 2nd day (1875.5 x 102 cells/ml) and minimum being 264 x 102 cells/ml on 7th day.
Chaetoceros sp.: 3rd day of 35 ppt (control) treatment, the cell growth was found to be maximum with 2490 x 102 cells/ml while minimum being on the 6th day i.e., 444 x 102 cells/ml. The growth rate was found to be maximum on the 5th day for the treatment with 175 ppt while 6th day being the lowest. 350 ppt showed different response to the cell growth of Chaetoceros sp. with least being on 2nd day and highest on the 3rd day (Figure 1).
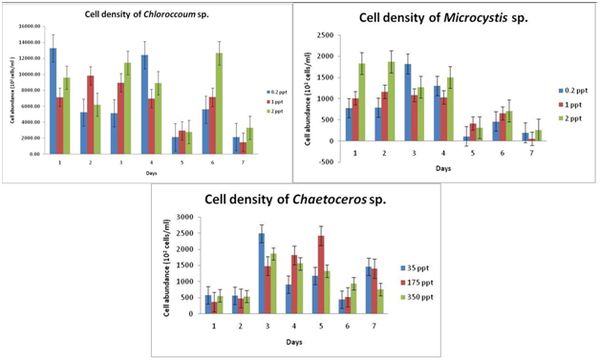
Figure 1: Cell density of Chloroccumsp., Microcystis sp. and Chaetocerossp. with response to different salinity concentrations
2. Effect of Different Salinity Levels on Total Lipid Concentration:
Chlorococcum sp.: As seen in figure 2, in case of 0.2 ppt, total lipid is higher (6.6 mg/l) on 6th day with low lipid content recorded on the 1st day. For the control i.e., for 1 ppt, the total lipid content was found to be maximum on the 5th day (10.24 mg/ml) with lowest total lipid content recorded on the 2nd day. For 2 ppt, the cells showed an increase on 6th day (6.7 mg/ml).
Microcystis sp.: As seen in Figure 2, in case of 0.2 ppt, the lipid content is seen to be highest on 5th day i.e., 8.4 mg/ml and the lowest was seen on 2nd day with 3.6 mg/ml. For control i.e., 1 ppt, maximum lipid content of 6.2 mg/ml and minimum of 2.45 mg/ml was recorded on 5th and 7th day respectively. A similar trend was found in the treatment with 2 ppt, maximum was found on 3rd day (9.5 mg/ml) and minimum being 2.15 mg/ml on 7th day.
Chaetoceros sp.: 5th day of 35 ppt (control) treatment the lipid content was found to be maximum with 8.06 mg/ml while minimum being on the 7th day i.e., 3.12 mg/ml. The lipid content was found to be maximum on the 5th day of treatment with 175 ppt while 7th day being the lowest. 350 ppt showed different responses to the lipid content of Chaetocerossp. with least being on 7th day and highest on the 5th day (Figure 2).
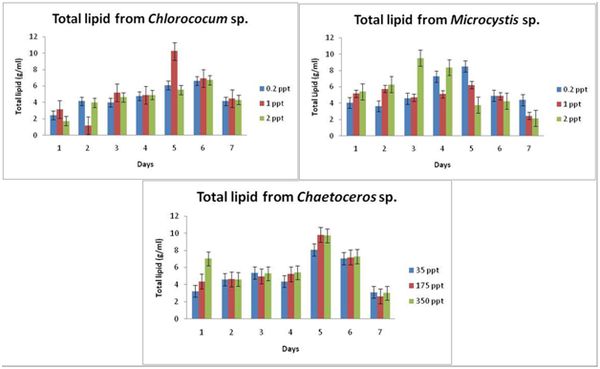
Figure 2: Total lipid of Chloroccumsp., Microcystis sp. and Chaetocerossp. with response to different salinity concentrations
Although many species of micro-algae are tolerant to great variations in salinity, their chemical composition can be affected (Brown et al., 1989; Roessler, 1990). The difference in the growth response within the treatments suggests the existence of population genetic variation in the ability to cope with extremely low salinity and corroborates genetic and physiological heterogeneity. According to Cooksey and Chansang (1976), and Fabregaset al., (1984) salinitystress triggers the production of lipids. Renaud et al. (1994) reported a 24.2 % total lipid content for a marine Naviculaspecies. Three freshwater Naviculaspecies attained an average lipid content of 24 to 51 % of dry weight (DW) (Griffiths and Harrison, 2009), for nutrient replete and deficient conditions. Algae differ in their adaptability to salinity and based on their tolerance extent, they are grouped as halophilic (salt requiring for optimum growth) and halotolerant (having response mechanism that permits their existence in saline medium).
In either case, the algae produce some metabolites to adapt to salt injury and also to balance as per the surroundings osmotica (Richmond, 1986). Depending on the species under study, there may be an increase in ash content and total lipid content (Ben-Amotz et al., 1985). A similar salinity tolerance has been reported previously for Isochrysissp. (Ben-Amotz et al., 1985; Fabregas et al., 1985; Jeffrey et al., 1990) and a range of other species (Jeffrey et al., 1990). An increase in fatty acid with increasing salinity has been reported previously for Naviculaoculata (Hodgson, 1991). Many reports have suggested that lipids might be involved in the protection against salt stress (Huflejt et al. 1990, Khamutov et al. 1990, Ritter and Yopp 1993). When photosynthetic organisms are exposed to salt stress, the fatty acids of membrane lipids aredesaturated. Hence in the given study, the increase in the salinity is perceived as an unfavorable condition resulting in a rise in the total lipid content.
|
