|
RESULTS
Figure 3 illustrates that about 64.57% households served have door-to-door waste collection system where as 35.43% uses the community bin. In Bangalore city, door-to-door collectionsystem is most common method of collection of waste which is implemented in 2003, as it is suitable for collection of segregated waste from residential area. Figure 4 depicts the time of waste collection from households. Waste is being collected from the households in the morning time (63.5%) compared to afternoon (0.36%) and evening (1.07%). Frequency of door-to-door waste collection is given in Figure 5. The frequency of collection of wastes varies from place to place, depending on the locality. In majority of the area such as in raja rajeshwari ward, malleshwaram, rajajinagar, jayanagar etc. the waste is collected daily (47%) followed by weekly 4 times(12%), once (3%), thrice (2%) and twice (1%). 35% of the households dispose the waste in the locality bins. Number of persons involved in door-to-door waste collection is represented in Figure 6. In most of the wards 2 persons were involved in collecting the waste (41%) followed by one person (21%) and 35% 35% households have the facility of community bins. Most parts of the city, municipality (90%) in engaged in waste collection (from household) to final dumping sites or transfer stations while Private contractor and NGO’s (Swabhimana, Swachha Bangalore, ShuchiMitras) represents 8% and 2% respectively (Figure 7). The distance of community bin from the houses in the surveyed area are given in Figure8. The dustbin is within 100 meterin 29% of the surveyed area, while in 13.22% area bin is in the range of 100-500 meter and in the rest the region is served with the door-to-door collection system. Figure 9 reveals the size of bin in surveyed area. Majority of the wards the bin size is 1 m3 (24%) followed by less than 1 m3 bins(12%) and in remaining wards door-to-door collection of waste (54%). The storage bins are of two types; stationary bin and hauled bin. Depending on the local culture, tradition and attitudes towards waste, bins are allocated to the community.
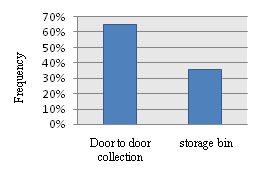
Figure 3: Share of door to door collection
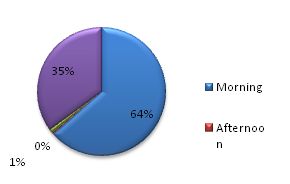
Figure 4: Time of waste collection
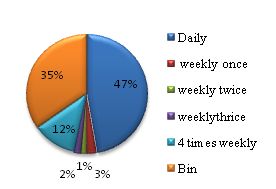
Figure 5: Frequency of waste collection from door-to-door
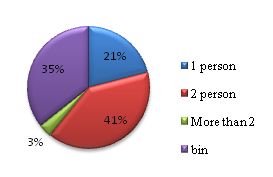
Figure 6: Persons involved in door-to-door collection system
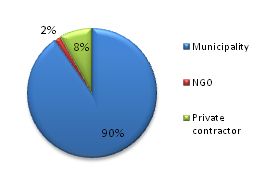
Figure 7: Waste collection
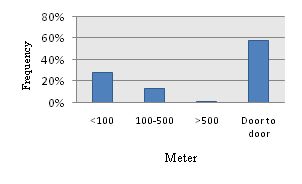
Figure 8: Distance of the community bin from house
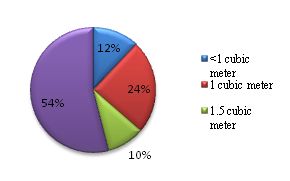
Figure 9: Size of the bin
The segregation of waste carried out at the household level is represented in Figure 10. It reveals that majority of households (78.34%) of the city do not segregate the waste before dumping into dustbin because of lack of awareness and general attitude of public towards segregation of solid waste, only 20% of the total population segregate into organic and inorganic waste or dry and wet waste. Street bin is cleared of litter by the municipality in the locality shown in Figure 11. Bins are cleared weekly in majority of wards (45%), while binsare cleared in 42% wards daily and 13% wards once in 2/3 days. Figures 12 and 13 illustrate the transportation of waste and distance travelled for disposal of waste. About 85% of the city population do not know where the waste is transported, only 15% population were aware about the transportation of waste. Of the total, only in 9% of the wards the waste is transported in the range of 10-100 km. This highlights of poor environment literacy among the residents of Bangalore.
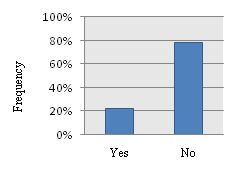
Figure 10: Segregation of waste
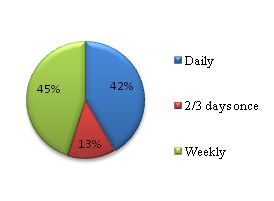
Figure 11: Bin clearance in the locality
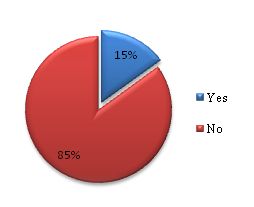
Figure 12: Transportation of waste
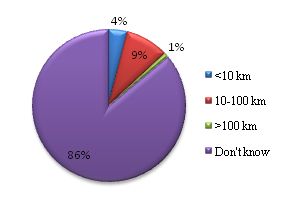
Figure 13: Distance of the waste transportation
Figure 14 illustrates that of 71% of the region in the surveyed area has no landfill sites, while landfill exists only in 28% at outskirts of the Bangalore.Figure 15 illustrates of zonewise per capita household waste generated. Per capita household waste generated is maximum in South zone accounting to 156.0 gm/per/day followed by Northwest (130.9 gm/per/day), East (127.9 gm/per/day), South west (123.2gm/per/day), South east (116.7gm/per/day), North (113.5 gm/per/day), West (110.3gm/per/day) and North east (87.9 gm/per/day). The variation can be attributed to different lifestyle and food habits of the residents between the zones. The organic fraction is the largest component accounting to 82% as shown in Figure 16. This is followed by paper waste (13%), metal content (2%) and glass waste (1%). Others include dust, batteries, ashes etc. accounts to 2 %.
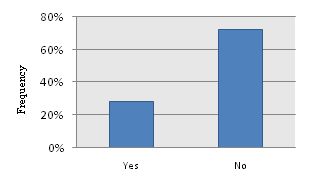
Figure 14: Landfill site in the region
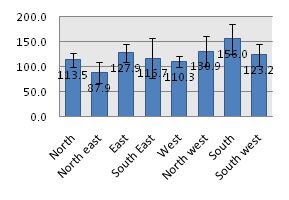
Figure 15: Per capita waste (gram/day)
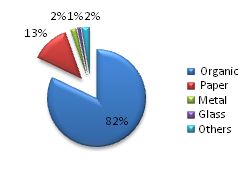
Figure 16: Composition of household waste
Survey shows that total organic waste generated in Bangalore is 192.37 Gg/year. Total (carbon dioxide and methane) emission from municipal solid waste is about 503.64 Gg/year. Figure 17 highlights GHG emissions from all the wards of Bangalore. 76 wards have total emission less than 2 Gg/year, while 11 wards have emission more than 4 Gg/year and 55% of total wards have total emission between 2-4 Gg/year.
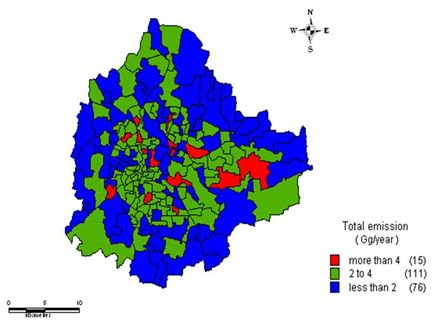
Figure 17: CO2 equivalent emission from Bangalore
|
