|
Results and Discussion
Data compiled from 1967 households reveal that 50% satisfied with the overall environment of the Bangalore. Figure 2 illustrates the spread of 1967 samples across various wards of Bangalore. 226 households are very satisfied, while 1086 are satisfied with over all environment and about 162 households are very unsatisfied.
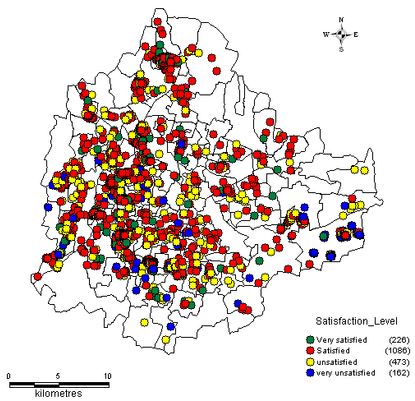
Figure 2: Satisfaction with overall environment
Figure 3 shows the residential status of sampled houses.1399 households are local urban residents. Northwest and Southwest regions are dominated by rural residents and about 11% are non-local residents followed by 10 foreigners.
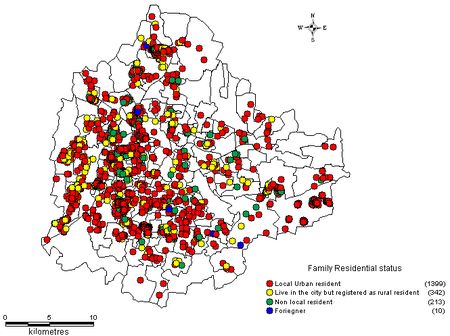
Figure 3: Family Residential Status
Figure 4 depicts the distribution of type of houses and about 801 are single story row houses. It shows about 42% are low-rise apartments. Detached house or town houses are more in South East Area. High rise buildings are concentrated in the center of the city.
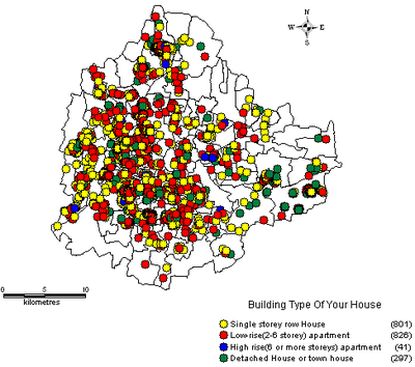
Figure 4: Building Type Of your House
Figure 5 shows that 1549 households uses LPG for cooking and about 12% uses both LPG and electricity for cooking and 33 households use only electricity for cooking. LPG is used almost in every house either with electricity or with fuel wood.
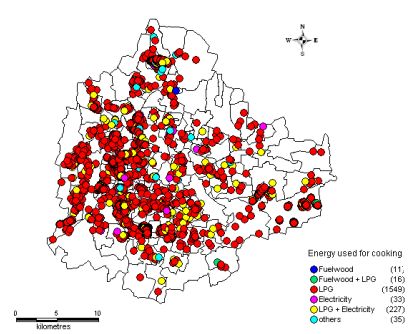
Figure 5: Energy used for cooking
Figure 6 show that 782 households use electric heater for water heating (bathing purpose) and about 24% use solar water heater. Solar energy devices are being opted in Bangalore due to the government policy of provision of incentives for solar water heater users in the monthly electricity bill. Solar devices do not emit GHG’s. Survey results reveal that 584 households have installed solar appliances due to the government’s encouraging policy (Figure7). About 441 houses indicated of their plan to install solar appliances (Figure 8).
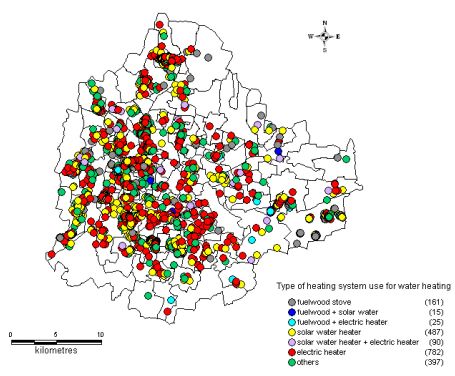
Figure 6: Heating system for water heating
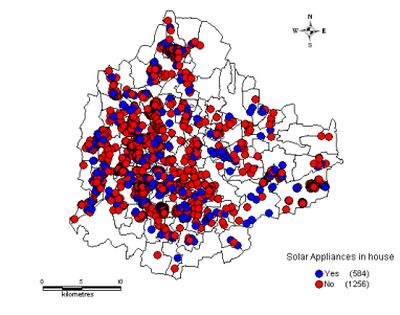
Figure 7: Solar appliances in house
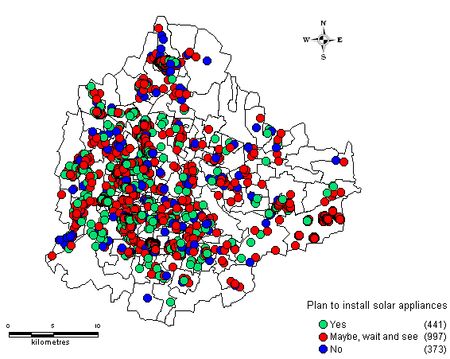
Figure 8: Plan to install solar appliances
Figure 9 shows ward-wise CO2 emission due to electricity consumption and the total emission is about 1940.629 Gg/year which is very high compare to other cities. Most wards emit between 5 to 10 Gg/year. Wards having emission more than 15 Gg is mainly located at the center of the city.
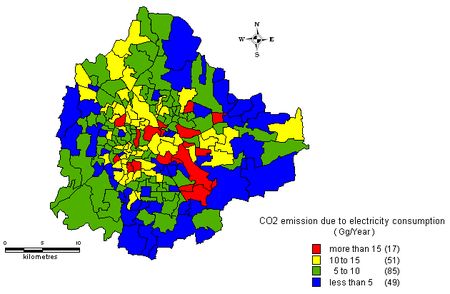
Figure 9: CO2 emission due to electricity consumption
|
