|
Results and Discussion
Various categories of USW dumpsites and their features are presented in Table 1 wherein the dominant form of waste is also listed such as plastic, organic, construction, indeterminate (fresh wastes mixed up making segregation difficult), old (old dumps indicating decomposition of most of the fermentables), other (non-USW wastes often from industry, upholstery, etc.) and recycling rejects (rejects from the recycling processes where other types are rejected and piled including fermentable wastes). These categories are based on the percentage of waste volume at dumpsites. A total of 270 dumpsites were recorded by the study team. Fig 1 shows the spatial distribution of unauthorized dumps at outside the city. These dumps are distributed in all four directions from the city centre. Number of sites is more in North East (NE) and South East (SE) in comparison to South West (SW) and North West (NW) zones. The height of individual dumpsites varied from 10cm to 8m (4 inches to 20ft). Few of the dumps had suffered continuous disposal of waste over the past few years showing clearly distinguishable spots of very old and very fresh dumps of USW. Locations suffering continuously dumped over 2-3 years could be identified in Google Earth maps as well. Identification of newer dumps using Google Earth was however difficult without updated photos and maps. It was also difficult to identify ephemeral dumps which were one off dumping events and occurred over different sites. Wastes have also been dumped on steep hill slopes and quarries and such locations are not identifiable through satellite imagery of Google Earth photos. Such dumps could not be included for comparative studies although their presence and magnitude were manually recorded. The details of the overall dumps are presented in Table 2 where in the number of locations of unauthorized dumping in all four zones of the city surveyed during September to November, 2010 is presented. From the composition of these sites the extent and quantity of various wastes are estimated using earlier determined densities to convert volume measurements to weight. From such estimates we determine that a total of 174,000 m3 of wastes caused by unauthorized dumping around the city. This could be translated to 83557 tons by weight.
Table 2: Zone wise unauthorized waste disposal sites based on first survey
| Waste categories |
Zone wise occurrence of waste disposal sites and waste volume |
Total volume
(m3) |
Density
(ton/m3) |
Total quantity
(tons) |
| NE |
SE |
SW |
NW |
| No. |
Volume (m3) |
No. |
Volume (m3) |
No. |
Volume (m3) |
No. |
Volume (m3) |
Mixed Fresh USW
(Indeterminate) |
9 |
108.3 |
16 |
2512.1 |
8 |
1066.2 |
4 |
401.1 |
4087.7 |
0.41 |
1656 |
| Wet Organic |
20 |
451.3 |
26 |
34.9 |
2 |
1.1 |
6 |
121.4 |
608.7 |
0.41 |
247 |
| Debris |
28 |
2305.0 |
16 |
1361.1 |
19 |
5203.8 |
13 |
620.1 |
9490.0 |
1.0 |
9490 |
| Plastic |
16 |
94.5 |
49 |
90.4 |
7 |
105.7 |
10 |
169.7 |
460.3 |
0.1 |
41 |
| Old |
1 |
200.1 |
1 |
10.6 |
0 |
0.0 |
2 |
51 |
261.6 |
0.6 |
157 |
| Other |
5 |
112.7 |
5 |
159.8 |
3 |
420.3 |
2 |
57.3 |
750.2 |
0.45 |
338 |
| Recycling |
3 |
159126 |
2 |
48.1 |
0 |
0.0 |
0 |
0.00 |
159174.4 |
0.45 |
71628 |
| Total |
82 |
162398 |
114 |
4217 |
38 |
6797 |
36 |
1420 |
174832 |
Avg: 0.49 |
83557 |
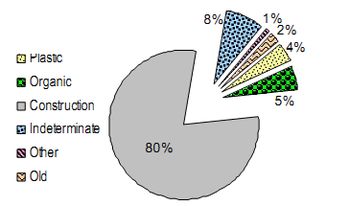
Fig 2: Percentage composition of unauthorized waste excluding recycling units
Wastes are dumped at unauthorized dumping places as well as at recycling units where fermentables or non recyclable wastes lie without any treatment. These non recyclable rejects put out by recycling units are generally called as recycler rejects. At these locations (recycling /recovery units), measurement of area dumped for untreated waste was difficult, so only visual estimation is used to estimate the waste volume. It is clear that recycling units contribute a large fraction (91%) of total waste dumped in these areas. This large percentage of recycler /recovery unit rejects needs to be avoided by adopting safer and cleaner management among these recycling units with planned waste segregation as well as setting up a treatment facility for organic waste nearby. Our estimates show that If such recycler rejects are not allowed to be haphazardly dumped the extent of other dumps would only account for 11923t of haphazardly dumped waste on the periphery of the city.
Among the various locations of illegal dumping on the outskirts of the city, the largest type or contribution came from plastic wastes (82 in number). Construction waste contributes 61% of total waste by volume as well by weight. It is imperative that alternative uses for them needs to be devised considering that the costs of sand today are immense and difficult to find. An understanding of the sizes for these dumps could be had by making an estimate of the average quantity of individual wastes in each category of the dumps studied. Results suggest that the average size of these dumps were as follows - construction waste (124.9t/dump), indeterminate (44.8t/dump) and old waste (39.3 t/dump). For organic and plastic waste average waste dumped are 4.6 t/dump and 0.5t/dump, respectively suggesting these arise from dumps by a single or two truck loads of USW. It is estimated that Bangalore USW has nearly 72% of fermentable organic wastes (Chanakya et al., 2009) and therefore unless observed within a few days after dumping, most of the USW dumps would be bereft of fermentable organic matter. However, not all dumps indicated that the dumped USW were of domestic origin where ultimately dumped waste is left only with non-decomposable constituents like plastic, cloth, glass etc. along with well packed and inaccessible decomposable inputs.
Our survey has estimated a total of 175000m3 of dumped USW (83557t by weight). This level of dumping is equal to about 20-23d equivalent of daily discharge of Bangalore’s wastes or in terms of percent diverted to dumps it ranges between 5.5-6% Among the 270 locations studied and identified, 25 locations were verified simultaneously with field measurements as well as suing Google Earth pictures (GE). These 25 locations all the three type of area estimation was available. Area as measured using length and breadth is presented in Fig 3 where the average deviation for different measurement methods is analyzed. This study needs to be repeated a few times to determine its repeatability and use at other locations. A detailed examination of dumps along with distance for road networks would predict reasons for choice of these locations and possibly evolve methods to dis-incentivize such occurrences.
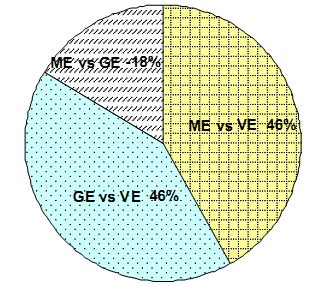
Fig 3: Average percentage deviations in computed area
(ME: Manual estimation; VE: Visual estimation; GE: Google Earth estimation. VE<ME<GE)
|
