|
Results and Discussion
(1) The rural energy consumption model. To study the dynamics of the energy utilisation patterns in any industrial plant, the SEC (Specific Energy Consumption) and EI (Energy Intensity) would help in predicting minimum energy required to operate an industry efficiently.
(2) Statistical analysis of energy coefficients
Energy consumption and production. The relationship between the variables Energy Consumption (En) and Production (Pr) is determined by the least squares method. The best fit is of the form:
En = A. (Pr)c
where "A" is the constant and the coefficient "c" is commonly known as the Energy Elasticity.
Table 8. Regression analysis: Energy & Production.
| Equation |
r |
% error of Y est |
A |
B |
| Linear |
0.7286 |
9.26 |
19.47 |
0.0135 |
| Parabola |
0.7312 |
9.10 |
20.70 |
0.0108 |
|
|
|
C = 0. 175 X 10-6 |
| Hyperbola |
0.2090 |
30.20 |
0.1123 |
0.0001 |
| Exponential |
0.4790 |
12.24 |
14.88 |
0.0019 |
| Power law |
0.7544 |
8.02 |
2.369 |
0.3983 |
| Y = dependent variable: En, X = independent variable: Pr |
The data collected from both secondary (for 136 industries) and primary sources (energy auditing in six industries) were compiled. The regression analysis was done for this set of data. The probable relationship based on the least % error of best fit is:
En = 2.36 (Pr)0.3983
The generalised form of the relationship is written as:
En = A. (Pr)c -------------------(1 )
where C = Energy coefficient
A = constant
Equation (1) could be written as:
C = dEn/En / dPr/Pr----------------(2)
That is, the Energy Coefficient expressed in terms of the proportionate change in En to the proportionate change in Pro The lower the value of "C", the lower is the change in En for the corresponding change in product. Differentiating Equation En = A (Pr)c with respect to change in production, we get the dynamic consumption rate that is:
d En / d Pr = A x C (Pr)c-1 --------------------------------- (3)
The value of the Energy coefficient "c" being less than one, which means dEn/dPr declines sharply with increase in production in a industry. This might imply better utilisation of the installed production capacity of boilers and driers.
Specific Energy Consumption and Production. Specific Energy Consumption is the ratio of Energy Consumption (in Rs) to the Production (in Rs). This ratio would help to predict the minimum
Table 9. Regression analysis: SEC & Production.
Equation |
r |
% error of Y est |
A |
B |
| Linear |
0.3947 |
12.34 |
0.2923 |
-0.000108 |
| Parabola |
0.4959 |
11.10 |
0.3340 |
-0.000322 |
|
|
|
c = 0.596 X 10⁻⁷ |
| Hyperbola |
0.4602 |
11.89 |
10.34 |
-0.0205 |
| Exponential |
0.6135 |
8.46 |
0.188 |
-0.000855 |
| Power law |
0.7673 |
4.61 |
2.369 |
-0.620 |
| X = independent variable: Pr |
|
|
| Y = dependent variable: SEC |
|
|
energy required to operate an industrial plant efficiently. The relationship between Specific Energy Consumption (SEC) and Production (Pr) for the cashew processing sector is tried by the least square method. A best fit with least % error of Y est is chosen, and is:
The relationship from least square method is:
SEC = 2.35 (Pr)-0.62
The results of the analysis is listed in Table 9. The general form of relationship:
SEC = A' (Pr)-C' ----------------(4)
The negative exponent c' shows a decline in the value of SEC with increase in Production. This again may be inferred, as the energy efficiency improves with better efficiency utilisation of the installed production capacity.
In order to look at the role of installed Per cent Production Capacity Utilisation (PPCU) on the energy utilisation, Specific Energy Consumption and hence on the energy efficiency of the operation, further analysis is carried out between the variables En and PPCU, SEC & PPCU.
From Equation (3) and Equation (4) we noticed that the Energy Efficiency Improves with the increase in Production. Normally with increased production capacity utilisation, production of an industry increases. Regression analyses were carried out to explore the relationship between EI and PPCU, and SEC and PPCU. By the least square method, based on less percentage error of Y est, the best fit relationships are:
EI = 56.34 (PPCU)-0.56 ----------------(5)
SEC = 2.15 (PPCU)-0.76 ----------------(6)
These two relationships confirm the earlier conclusions, that to improve the energy efficiency of an industry, it is very essential to match the production of a industry with installed production capacity.
Table 10. Distribution of Industries in different PPCU range.
| PPCU |
Number of Industries |
SEC |
| 0-5% |
1 |
0.655 |
| 5-10 % |
2 |
0.342 |
| 10-20% |
2 |
0.264 |
| 20-30% |
6 |
0.190 |
| 30-40% |
12 |
0.120 |
| 40-50% |
37 |
0.100 |
| 50-60% |
39 |
0.095 |
| 60-70% |
21 |
0.093 |
| 70-80% |
10 |
0.092 |
| 80-90% |
8 |
0.060 |
| > 90 - < 100% |
4 |
0.042 |
|
142 |
|
The next logical question, which arises from these analyses, is how much energy can be saved by optimal utilisation of the installed production capacity. Table 10 lists the SEC and PPCU in the Cashew processing sector. Out of 142 industries, it is seen that in 99 industries the percent installed capacity utilisation is less than 60%. Examining the two industries with PPCU of 50 and 80, the SEC for respective values would be as shown in Equation (6) as:
SEC = 2.15 (50)-0.76 = 0.109
SEC = 2.15 (80)-0.76 = 0.076
That means there is 30.27% variation in SEC, which means 30.27% of the energy can be saved by proper utilisation of installed production capacity. Figure 1 gives the plot of SEC and number of firms with Percent Production Capacity Utilisation. A declining trend of SEC with increased PPCU is evident from this Figure. The frequency of the number of firms in each PPCU range is a bell-shaped curve, which clearly shows about 69.72% of the total samples are in PPCU range less than 60%. This gives considerable scope for saving fuelwood with better utilisation of installed production capacity.
Energy Auditing: Detailed energy audits were carried out in six cashew processing industries located in the Kumta taluk of Uttara Kannada (North Kanara) district on the coastal belt of Karnataka, by spending one to two days and measuring actual fuelwood consumption, raw materials etc. The details of energy consumption, raw materials and man-power are listed in Table 11.
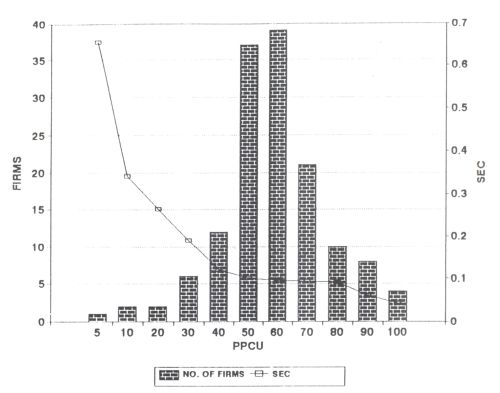
Figure 1. Specific Energy Consumption (SEC) and Percent Production Capacity Utilisation (PPCU)
| Table 11. Energy auditing in the cashew processing firms. |
| |
|
|
|
|
Employees |
|
|
| Fuelwood/year for (Heat) |
Electricity mainly for Lighting |
Fuelwood |
Raw nut |
Output kernels production |
Male |
Female |
Wages |
Production |
| Units tonnes |
KWh |
Rs. |
kg |
kg |
No. |
No. |
Rs. |
Rs. |
| 7.2 |
180 |
5400 |
5914.28 |
1320 |
2 |
8 |
96000 |
198000 |
| 70 |
240 |
49000 |
31200 |
8400 |
4 |
10 |
152116 |
275000 |
| 120 |
400 |
90000 |
81200 |
24010 |
2 |
25 |
195000 |
3601500 |
| 156 |
25 |
120000 |
61200 |
18000 |
2 |
27 |
210600 |
2700000 |
| 165 |
600 |
123750 |
121200 |
34200 |
2 |
50 |
267000 |
5130000 |
| 692.5 |
3000* |
519375 |
577200 |
53900 |
4 |
130 |
619700 |
21546000 |
| * This industry uses electric drier for drying kernels sometimes. |
|
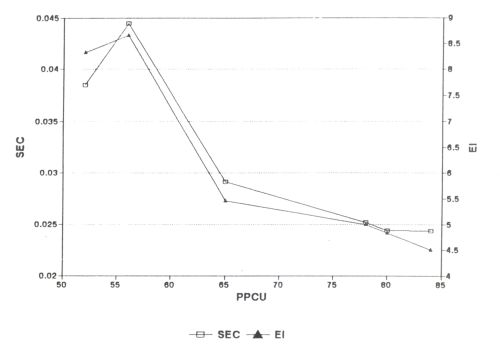
Figure 2. Specific Energy Consumption (SEC) and Energy Intensity (EI) variation for different Percent Production Capacity Utilisation (PPCU).
The energy analyses were carried out to explore the variation in SEC, EI and PPCU in these industrial units and the results are listed in Table 12.
From Table 11 it is evident that these industries are labour intensive and mainly employ women. Since the wages paid are based on the amount of work done (that is quantity of nuts dehusked / peeling of kernels, etc.), these labourers seem to be one of the most efficient. The employment opportunity in these industries has created a new kind of social awareness among the women.
Since cashew is a cash crop, the SEC computed shows very small values. The discussion based on SEC seems to be insignificant. Hence EI (Energy Intensity) is computed which reveals distinctly the disparities in the level of fuelwood consumption in the other sector. It is noticed that the variation ranges from a minimum of 4.49 kg fuelwood per kg of cashew kernel processed to the maximum of 8.66 kg. The PPCU computed reveals that the high level of fuelwood consumption is related to the lower installed production capacity utilisation. Figure 2 is the pictorial representation of SEC/EI with the PPCU of firms where the detailed survey was carried out.
As listed in Table 12, it is evident that an industry with PPCU 52% consumes 8.32 kg of fuelwood while an industry with a PPCU of 84% consumes 4.49 kg of fuelwood. This means there is a 46% variation in the quantity of fuelwood consumed for processing cashew. This is mainly due to the non-utilisation of installed production capacity. Roasting of raw nuts and drying of the kernel are the two energy intensive operations in these industries.
| Table 12 Computation of SEC/EI and PCU. |
| SEC Rs./Rs. |
EI kg./kg. |
PPCU % |
| 0.02435 |
4.824 |
80 |
| 0.02438 |
4.499 |
84 |
| 0.02521 |
4.997 |
78 |
| 0.02909 |
5.454 |
65 |
| 0.04446 |
8.666 |
56 |
| 0.03843 |
8.324 |
52 |
The drier is used mainly to remove the moisture (in the order of 10%) in the kernel. High thermal efficiency could be achieved by the combustion of fuelwood in an enclosed chamber over a suitable grate with a proper opening for primary and secondary air to generate the highest combustion temperature and thus maximise the heat transferred to the trays. Proper insulation of the drier doors and a chimney of suitable height and diameter to create a draught and disperse smoke are the other essential components in cutting down the fuelwood consumption. In two out of six firms, the combustion was done in an open chamber and the drier doors were poorly insulated. Apart from these, the drier is not loaded fully in these firms.
- The fuelwood cost is relatively small in the processing of cash crops such as cashew compared to the value of the end product. This is one of the reasons for not taking up energy conservation measures in these industries.
- Easy access and availability of fuelwood both on a commercial and non-commercial basis are the main reasons for the rural industries to use fuelwood. However, the fast depletion of forests has caused a fuelwood scarcity which affects the domestic consumer severely while these industries continue to get fuelwood at higher or increased cost. Nevertheless, the cost of fuelwood in the total production cost is very small in this sector. The inefficient usage of fuelwood, in the order of 46 to 50%, could be conserved by proper maintenance of equipment, better utilisation of installed production capacity and use of renewable sources of energy such as solar energy for steaming raw nuts.
|