RESULTS & DISCUSSION |
7.1 General Considerations: Figures1 and 2 depict the energy consumption per capita and energy consumption per GDP for all the countries. Each continent was considered separately for further analysis and comparison. When a country is said to be more energy efficient than another, it means that it uses less energy to erform the same task compared to the other. At each step in energy production and utilization, loss can occur. Therefore, in order to point out where the losses are found, further analysis was carried out. Initially, energy consumption was compared with a country's gross domestic product. Later, per-capita energy consumption for many countries was plotted against GDP per capita. In order to make a quantitati ve estimate of the response of energy consumption per capita to GDP per capita, regression analysis was carried out for the set of the database. Both linear and nonlinear regression analyses were effected based on the lowest percentage of error and best correlation coefficient, and the best-fit relationship for this set of data was found to be a power law of the form,
EC =A*GDPpcB
where
EC = energy consumption per capita in kilograms of oil equivalent and
GDPpc= grossdomesticproductper capitain U.S.dollars.
EC = 0.9184*GDPpc0.8939
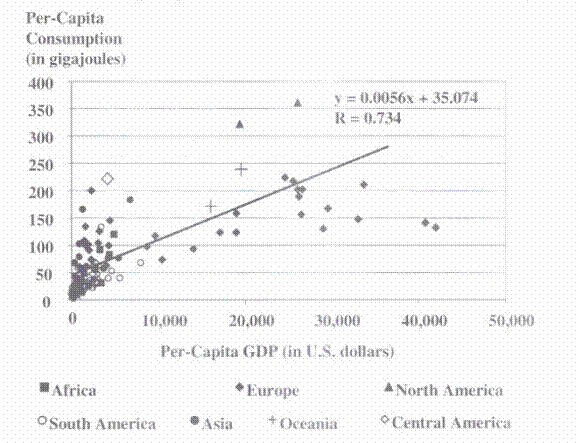
FIGURE 1 : THE PER-CAPITA ENERGY CONSUMPTION VERSUS THE PER-CAPITA GROSS DOMESTIC PRODUCT (GDP) FOR ALL THE COUNTRIES CONSIDERED, 1995a
aR =correlation efficient.
The energy consumption per capita increases as the per-capita GDP increases, until it reaches a threshold. This is illustrated in figure 1 where countries on the left side have higher energy consumption per capita than those on the right side. This indicates higher energy consumption for a lower GDP per capita.The countries seem to spread in figure 1 from the origin (no energy consumed, no GDP) in almost all the directions like a cone. There does not seem to be any limit on the amount of energy consumed per unit of GDP, and it appears that a minimum amount of energy is needed to produce a certain amount of GDP. That leads to an area on the bottom of the figure where no countries are found. For values of GDP below U.S. $2,000, the relationship etween the GDP per capita and the minimum energy consumption seems to be linear. After this value, saturation occurs for an energy consumption of about 125 gigajoules (GJ).
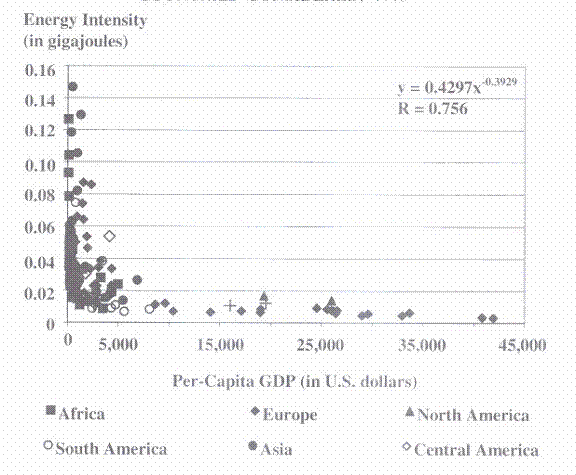
FIGURE 2 : THE ENERGY CONSUMPTION PER GROSS DOMESTIC PRODUCT (GDP)-ENERGY INTENSITY-VERSUS THE PER-CAPITA GDP FOR ALL THE COUNTRIES CONSIDERED, 1995a
aR =correlation efficient.
Three distinct groups emerge from figure 1. The developed countries are spread
on the right of that figure. They have high energy consumption per capita, between
100 and 350 GJ, and high GDP per capita, between U.S. $10,000 and $43,000
(consisting of Western European countries and North American countries, Australia,
and New Zealand). Second, on the lower left corner the developing (African, some
Asian, and Central and South American) countries are found. They have very low
energy consumption per capita, up to 75 GJ and low GDP per capita, up to U.S.
$6,000. Third, all the countries between the first and the second group form the
third group. It is composed of nations that have a GDP per capita between U.S.
$6,000 and $10,000 and countries that have a GDP per capita of less than U.S.
$6,000 but energy consumption per capita higher than 75 GJ (composed of North
African, East European, and Middle East countries, plus some countries of Asia
and South and Central America).
Variability is observed in per-capita energy consumption for similar GDP per
capita, for both developed and developing countries. It can be explained partially
by the fact that not all the energy consumed is taken into account in the GDP.
Transport and home heating or cooling, for instance, need energy to be performed.
Therefore, the energy consumption of a country does not depend only on the outcome
but also on the climate and the way people live.
It is possible to evaluate the efficiency of energy consumption in a country. In
a region (state), apart from the industry, agriculture, and service sectors, which
participate in the GDP and consume energy, people of the country use energy for
cooking, heating, and for different tasks in their day-to-day life. A country very
efficient in all the domains will have very low energy consumption per GDP. That
does not mean that the energy consumption per capita is low. On the contrary, high
efficiency is generally associated with high technology and a high standard of living,
leading to lower energy consumption per capita. Countries with high energy
consumption per GDP and low energy consumption per capita are poor and inefficient.
Most of the energy is used by industry and the GDP is low, indicating low
efficiencies. Industrial composition and end-use efficiencies have to be taken into
account in order to make a good comparison. Sectors like cement or paper, for
example, are high-energy industries. Nevertheless, high energy consumption per
GDP is generally associated with inefficient countries, especially ifthe energy consumption
per capita is low.
Figure 2 clearly shows that countries with a high GDP per capita also have low energy consumption per GDP. On the other hand, having low energy consumption per GDP does not imply a high GDP per capita. In order to have more disposable energy, two paths can be followed. The first is to increase the energy production. Supposing that the GDP will increase if the energy production expands; the country will then have an energy-intensive path. The second possibility is to increase the efficiency or to minimize the loss. That also leads to a situation where more energy is available. Regarding figure 2, the second possibility is certainly the best. If a country wants to increase its GDP per capita, it will have to reach high efficiencies. Improving efficiency can save vast amounts of energy. This is illustrated with two examples.
7.2 Energy Efficient Lighting: It is estimated that 15 percent of the electric power production was used for lighting consumption. Improving the energy efficiency of lighting had a tremendous impact on a country's energy consumption.16 The analysis shows a national savings potential of 40 percent by shifting to lamps with performance characteristics typical of current western practice (without changing the market share of various lamp types), and a 60-percent savings by adopting the best commercially available lamps.
7.3 Rain Effect in Building Energy Estimation: Rain has been found to affect the
thermal performance of any building by cooling the surface during rain and by
evaporation of the absorbed moisture from porous materials after rain. Studies
have shown that the heat gain by the porous building wall can be reduced by up to
50 percent on rainy days, in favorable countries or regions.17
In order to make the analysis more precise, each continent is studied separately.
Figures 1 and 2 are plotted with countries of each continent.
7.4 Asia
The Asian countries are grouped based on GDP per capita as shown in table 1. Among this group, Japan is the best performing, with a higher GDP per capita
(U.S. $40,846) and very low energy consumption per capita (150.4 GJ). Kuwait,
the United Arab Emirates, and Israel have relatively high and similar GDP per
capita but their respective energy consumption per capita is very different and much
higher than that of Japan. Countries of the former Soviet Union are found to have
very high energy consumption per capita and very high energy consumption per
GDP when compared with the Group 3 Asian states (table 1).
Energy data are used to compute two interesting values. First, the energy consumption
per GDP for industry can be calculated since the share of energy
consumption ofthe industrial sector and the share of industry in the GDP composition
are known. It gives an idea of the efficiency of the industrial sector of the
country. Second, the energy consumption in households per capita also can be
calculated with the energy share of the households. The average number of persons
per household varies from one country to the other. This indicates the standard
of living in a country.
The results for a sample of Asian countries are presented in table 2. The energy consumption per capita yields an idea of the average standard of living. The value for Azerbaijan is quite surprising, especially when compared with Turkmenistan. Since the two values given are very high, it is possible to imagine that the energy production is very inefficient. As expected, the low value ofIndia, Cambodia, and Sri Lanka indicates a poor average living standard. The higher density of population probably can explain the fact that India is lower than Cambodia and Sri Lanka Japan has the highest value, followed by Israel.
The energy consumption per unit of GDP (for the industrial sector) shows that Azerbaijan has a higher value compared to Japan, which has energy-efficient industries. India has the second least-efficient industries among the nations in table 2. The poor efficiencies of Turkmenistan, Azerbaijan, and United Arab Emirates (U.A.E.) explain their high energy consumption per-capita values, as found in figure 3.
Asia-Group 1: Kuwait, the U.A.E., and Israel, with similar climate and resources, have a very similar GDP per capita, but their energy consumption per capita is very different (figure 4). The six group-l countries have a high density of population and a low percentage of rural population. Kuwait and the U.A.E. have an energy consumption per
TABLE 1: SELECTED ASIAN COUNTRIES IN GROUPS BASED ON
PER-CAPITA GROSS DOMESTIC PRODUCT (GDP), 1995 |
|||
Group |
Countries |
Per-capitaGDP(in US $) |
Per-capita Energy consumption(in giga joules) |
Asia 1 |
South Korea , Israel , Kuwait , United Arab Emirates , Singapore and Japan |
10,000 |
100550 |
Asia 2 |
India , China , Cambodia and Vietnam |
<2000 |
<50 |
Asia 3 |
Iran and the former U.S.S.R. states such as Turkmenistan and Uzbekistan |
2,000-10,000 |
>50 |
TABLE 2: PER-CAPITA HOUSEHOLD ENERGY CONSUMPTION AND
INDUSTRIAL ENERGY CONSUMPTION PER UNIT OF GROSS
DOMESTIC PRODUCT (GDP) FOR A SAMPLE OF COUNTRIES IN ASIA, 1995 |
||
Country |
Per capita Household Energy consumption [in gigajoules] |
Energy consumption/unit of GDP for Industry [in gigajoules per US $] |
India |
1.8 |
0.095 |
Cambodia |
4.6 |
0.021 |
Sri Lanka |
5.4 |
0.011 |
Azerbaijan |
17.1 |
0.454 |
Turkmenistan |
4.1 |
0.060 |
UAE |
6.0 |
0.029 |
Israel |
22.8 |
0.011 |
Singapore |
8.1 |
0.011 |
Japan |
23.8 |
0.005 |
GDP much higher than other states of this group. At the same time, their energy consumption per capita is also higher. The GDP composition shows that for these two countries, the share of industry is similar to the share of services, i.e., industry at 55 percent and services at 45 percent in Kuwait with industry at 55 percent and services at 45 percent in Kuwait with industry at 55 percent and services at 42 percent for the U.A.E. In the other countries considered, the share of services is higher than the share of industry (e.g., Japan 60 percent, South Korea 51 percent, Israel 81 percent, and Singapore 72 percent). The services sector needs less energy
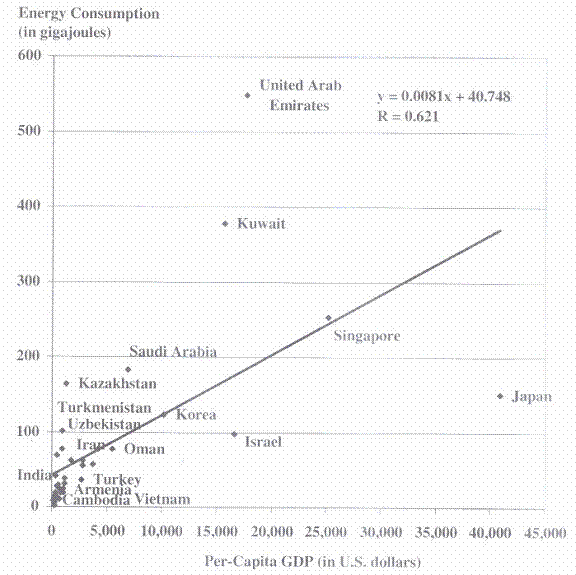
FIGURE 3 : PLOT OF THE PER-CAPITAENERGYCONSUMPTIONVERSUSPER-CAPITAGROSS DOMESTICPRODUCT(GDP) FOR SELECTEDASIAN COUNTRIES, 1995a
aR =correlation efficient.
for a similar GDP than industry. The type of fuel used does not seem to have a
strong influence. Japan and South Korea use different fuels, with liquid fuels dominant
(around 50 percent). Kuwait, Israel, and Singapore use mainly liquid fuels
and the United Arab Emirates uses mainly gas.
Japan is certainly the most efficient of these countries. Usage of different kinds
of fuels permits the country to employ the most appropriate one for a task, that is,
resource-task matching. Singapore uses only liquid fuels and its energy consumption
per capita is higher than that of Japan.
Asia-Groups 2 and 3: The same two indicators have been plotted with the countries that have a per-capita GDP of less than U.S. $10,000 (figures 5 and 6). It is then possible to see the countries falling between the developing and the developed countries: Saudi Arabia, Lebanon, Oman, Malaysia, Turkey, and Thailand.
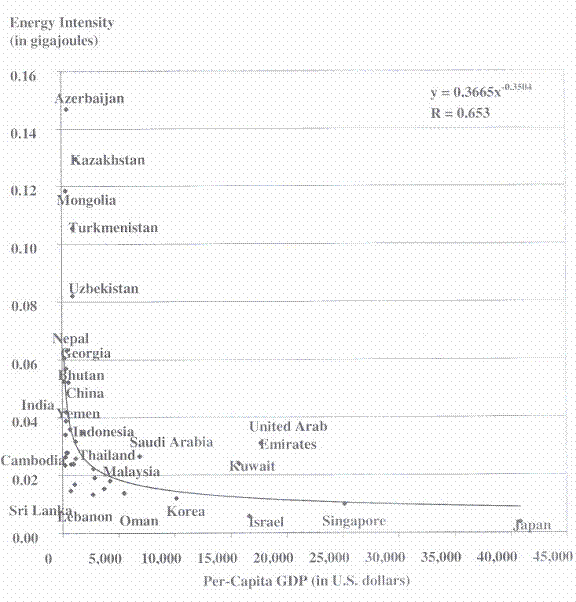
FIGURE 4: PLOT OF THE ENERGY INTENSITY VERSUS THE PER-CAPITA GROSS
DOMESTIC PRODUCT (GDP) FOR SELECTED ASIAN COUNTRIES, 1995a
aR =correlation efficient.
With some former Soviet Union countries (Azerbaijan, Kazakhstan, Turkmenistan, and Uzbekistan) and Iran, they form the Asia 3 group. Other countries on figures 5 and 6 comprise the Asia 2 group. Low-income countries of the Asia 2 group are Sri Lanka, Laos, Cambodia. and Vietnam, with very low energy consumption per capita and very low energy consumption per GDP. They use mainly traditional fuels (figure 7), and agriculture
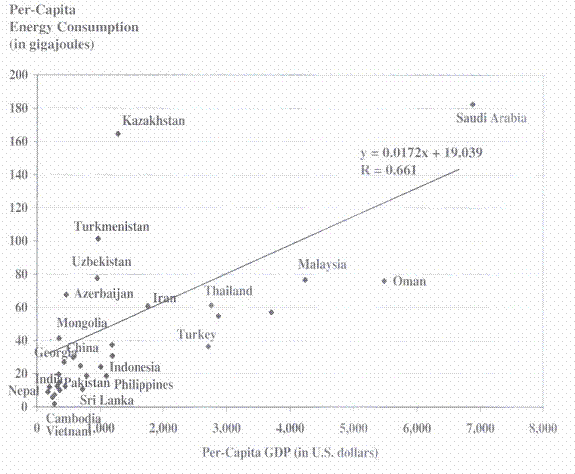
FIGURE 5: PLOT OF THE PER-CAPITA ENERGY CONSUMPTION VERSUS THE PER-CAPITA GROSS DOMESTIC PRODUCT (GDP) FOR GROUPS 2 AND 3 OF SELECTED ASIAN COUNTRIES, 1995a
aR =correlation efficient.
plays an important role in their economies. These countries are poor but not necessarily inefficient. Their industry is not well developed, but the fact that their energy consumption per capita is low is "encouraging." Some other nations, e.g., India, China, Georgia, or Nepal, have similar GDP per capita and energy consumption per capita, but higher energy consumption per GDP. In China and India, the main consumption of energy is by the industrial sector (66.2 and 53.7 percent. respectively); in return, the share in the GDP is 49 and 30 percent, respectively. In comparison, Japanese industry uses 42.7 percent of the energy consumed and its contribution to the GDP is 38 percent. Chinese and Indian industries are not that efficient. In Nepal, the energy consumption is more or less equally divided between industry (29.9 percent), transport (30.5 percent), and services (20.3 percent).
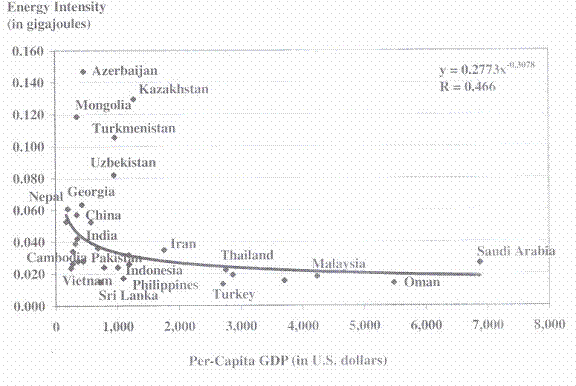
FIGURE 6: PLOT OF THE ENERGY INTENSITY VERSUS THE PER-CAPITA GROSS
DOMESTIC PRODUCT (GDP) FOR GROUPS 2 AND 3 ASIAN COUNTRIES, 1995a
aR =correlation efficient.
Agriculture is the main contributor to GDP, indicating poor industry and services efficiency. Kazakhstan, Turkmenistan, Uzbekistan, and Azerbaijan are nations that have very high energy consumption per capita and very high energy consumption per GDP. Among these countries, Azerbaijan in particular has high energy use per GDP and low per-capita energy consumption; its industry consumes 55.6 percent of the nation's total energy but contributes only 18 percent to the GDP, which indicates very low efficiency (table 2). Kazakhstan and Uzbekistan have similar situations. Their industries use 58.3 and <1-6.1percent of the energy, respectively, and their respective shares in the GDP are 32.6 and 27 percent. Turkmenistan offers statistics that appear very different since its industry seems very efficient, consuming 28.5 percent of the energy and accounting for 50 percent of the GDP; transportation is a large energy consumer.
7.5 Traditional Fuel Consumption: In developing countries, traditional fuel plays a major role. Most of the people use fuel wood, agricultural residue, animal waste, and the like for cooking and heating.
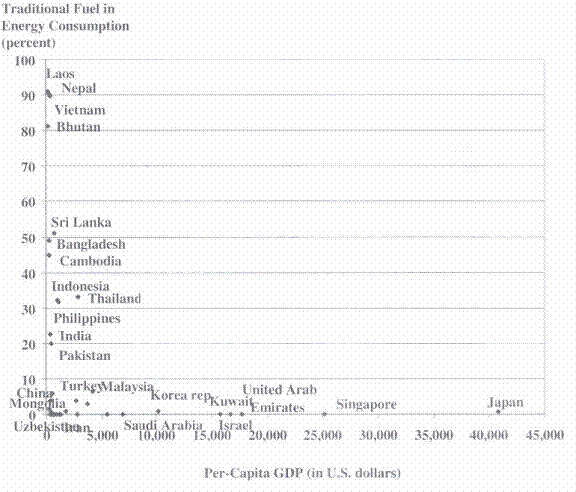
FIGURE 7: PLOT OF THE PERCENTAGE OF TRADITIONAL FUEL IN ENERGY CONSUMPTION VERSUS THE PER-CAPITA GROSS DOMESTIC PRODUCT (GDP) FOR ASIAN COUNTRIES, 1995
Estimates of fuel wood consumption vary
from 30 to 80 percent of the total energy consumption for most of the Asian countries.
In all the member countries of the Regional Wood Energy Development
Program in Asia (RWEDP), fuel wood consumption still is growing.18 The role of
these fuels is important in the energy consumption pattern. Biomass will remain
the major source of energy for the rural populations, coupled with niche renewables,
provided they are affordable and reliable. With 72 percent of the Indian population
still in rural areas, there is tremendous demand on bioresources such as fuel wood
and agricultural residues to meet the daily fuel requirements. Dependence on
bioresources to meet the daily requirement of fuel, fodder, etc. in rural areas is
more than 85 percent, while in urban areas the demand is about 35 percent.19 Transition
to other fuel types is a slow process due to economic affordability and other
constraints; replacement is not easy and is not obligatory. A study of the share of
traditional fuel is essential when dealing with energy policies.
Figure 7 shows the percentage of traditional fuel consumption versus the GDP per capita. Traditional fuel consumption is difficult to evaluate; therefore, much care has to be taken while using these values. For example, there is a huge difference in the values given for a few countries by the World Resources reports and the RWEDP20
It is noted that the countries with high GDPs have very low traditional fuel
consumption. This is easy to understand since traditional fuel is used mostly for
cooking. Countries like Japan and Singapore have other fuels that substitute for
the traditional fuels. For example, gas is more efficient and convenient than fuel
wood. Electricity, which also is widely used for cooking, is more convenient and
saves time but is not more efficient than the improved stove designed for traditional
fuel. Moreover, in developed nations, electricity and gas are available in
almost 100 percent of the households. That is not the case in developing countries;
switching over to either gas or electricity may not be a viable option for low-income
nations. For instance, in Bangladesh a fraction of the population (25 percent of
urban and 10 percent of rural) has access to electricity. In the rural area, fuel wood
is probably more convenient and the initial cost for kerosine and liquefied petroleum
gas (LPG) is too high for most of the fuel wood users. More efficient stoves
are probably the best solutions, even if this depends on the country and situation.
Using less fuel for cooking and heating, especially in the rural area, would have a
positive impact on the energy consumption per capita of the low-income Asian
countries. This also would lead toward sustainable use of renewable resources.
A study of potential biomass fuel conservation in selected Asian countries highlights that improving the efficiency of biomass energy utilization can save large amounts of biomass; domestic cooking is the single largest component. responsible for about 90 percent of the total biomass energy consumption.21 Increasing the efficiency also means decreasing the amount of fuel needed for cooking and heating. This will save time and energy for the rural population-less time will be required to collect the wood with a decrease in the deforestation rate and the amount of greenhouse gas injected into the atmosphere. In order to achieve success in the efficient use of energy, a large-scale campaign is needed. Information, help, and better education also aid in a wider understanding of renewable energy techniques and energy conservation.
Figure 7 indicates that a few countries have a very high percentage of traditional
fuel consumption. The Asia I group (Laos, Bhutan, Nepal, and Vietnam)
has a percentage of traditional fuels consumption ranging between 80 to 95 percent
compared to their neighbors (Sri Lanka, Bangladesh, Cambodia, India, or Pakistan)
that show a lower share of traditional fuel consumption. It is valuable to
attempt to explain the large gap between 50 percent and 80 percent in the share of
traditional fuels.
Traditional fuel is used for cooking in almost every household in the rural
areas of the developing countries. To explain the gap, the first value to be
checked is the share of rural population in these countries. No relationship
between the share of rural population and the percentage of traditional fuel could
be derived. Laos, Cambodia, India, and Thailand, respectively, have 77 percent,
77 percent, 72 percent, and 78 percent of population living in rural areas.
The traditional fuel consumption per capita is plotted in order to see if there is
any relationship between the percentage of traditional fuel and the consumption
per capita. Most likely, the relatively lower percentage of traditional fuel consumption
is due to an increased quantity of commercial energy (because of
industries). However, it is noticed that in these countries consumption of traditional
fuel has remained the same during the last three decades (1965-1995)
while consumption of commercial sources of energy is steadily increasing (figure
8). The nations that have a high percentage of traditional fuels have low
energy consumption per capita. The amount of traditional fuel used per capita
is similar in the states of south Asia.
All the countries that have high energy consumption per GDP have a very low
percentage of traditional fuel, as is the case of Azerbaijan, Turkmenistan, Uzbekistan,
Kazakhstan, Mongolia, China, and Georgia.
7.6 Europe
In the present study, the United States and Canada are included in the European
countries because it was found to be more accurate to compare the United States
with the European nations than Central and South American countries. Two groups
can be categorized from figure 9. First are the countries having a per-capita GDP
higher than U.S. $15,000 (Europe group I). Second, nations having a GDP per
capita lower than U.S. $15,000 form Europe group 2. However, a few states have
a GDP per capita near U.S. $15,000 and it is difficult to classify them.
The poor efficiency of the Eastern European countries can be seen in figures 9 and 10. They have low energy consumption per capita and high energy consumption
per GDP, indicating low efficiency. A few low-income nations of Western
Europe are found in the Europe 2 group (Greece, Portugal, and Spain). However,
they have higher GDPs and similar per-capita energy consumption to the Eastern
European countries. The United Kingdom, Ireland, and Italy are found to be a bit
behind the other western countries. Norway, Denmark, and Switzerland have the
highest GDP per capita. Half of the Western European states have a higher GDP
per capita and lower per-capita energy consumption than the Russian Federation.
This indicates the difference in the efficiency of the economy between the west and
the east. In addition, Canada and the United States have higher energy consumption
per capita compared to the European countries.
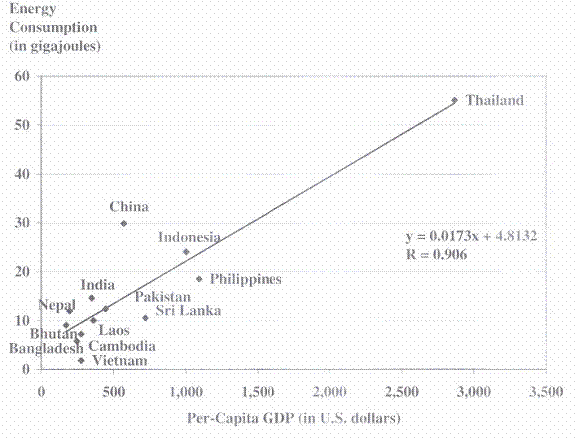
FIGURE 8: PLOT OF THE PER-CAPITA ENERGY CONSUMPTION FOR THE ASIAN
COUNTRIES HAVING A HIGH PERCENTAGE OF TRADITIONAL FUEL. 1995a
aR =correlation efficient.
The two groups also can be well distinguished in figure 10. The high energy consumption per GDP and low energy consumption per capita of the countries of Eastern Europe indicate a low efficiency in their economy although since 1992 they have tried to catch up with the west. Figure 9 for Europe has a different pattern than that of Asia. Most of the countries are found either at the lower right corner or the upper left corner, whereas for Asia most of the nations were found in the lower left corner. It is observed that for a few countries (Romania, Moldova, Macedonia, Bulgaria, Albania, and the Belarus Republic), the main portion of the GDP comes from services. This is the case with the Western European countries as well. In more industrialized western economies, the share of industry's energy consumption is similar to the share of the GDP coming from the industry.22 In a few countries, industry's share of energy consumption dominates: Bulgaria (58.8 percent), the Czech Republic (48.1 percent), Finland (45.9 percent), Romania (57 percent), Slovakia (52.7 percent), and Ukraine (48 percent). In other nations. the share of the different sectors is very similar.
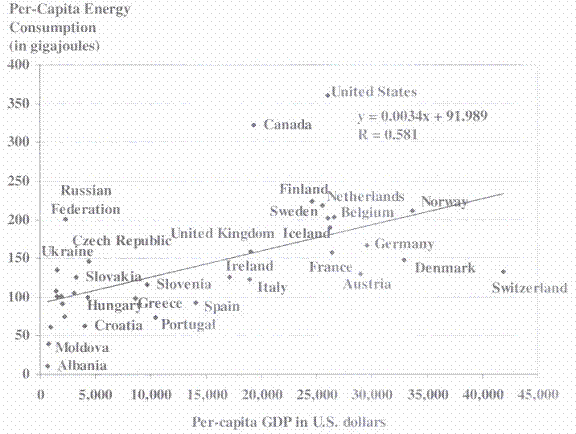
FIGURE 9: PLOT OF THE PER-CAPITA ENERGY CONSUMPTION VERSUS THE PER-CAPITA GROSS DOMESTIC PRODUCT (GDP) FOR EUROPEAN COUNTRIES, 1995a
aR =correlation efficient.
Most of the European countries use a variety of fuels, although some are more widely consumed than others. For example, there is a dominance for primary electricity in Switzerland, Sweden, and Norway. These countries have good hydroelectric resources. Romania, the Russian Federation, and the Netherlands use more gas than other countries. Poland consumes substantial solid fuel (e.g., coal), whereas Portugal, Italy, and Greece use predominantly liquid fuels. The same calculation of energy consumption in one household per capita and the energy consumption per unit of GDP for industry has been made for selected European countries; the results are presented in table 3. The per-capita energy consumption indicates the standard of living in a country; at least, the values given above and the difference between the countries correspond to the subjective idea of the living standards in these nations. Nonetheless, it seems improbable that the standard of living of the Russian Federation is almost as high as that in France or in the United Kingdom. However, the energy consumption in households also depends on the climate and can be more or less efficient. The United States has a higher variation in the household energy consumption per capita, indicating a low efficiency. This difference is because of the fact that use of gasoline for the car is included in the household while public transportation is not.
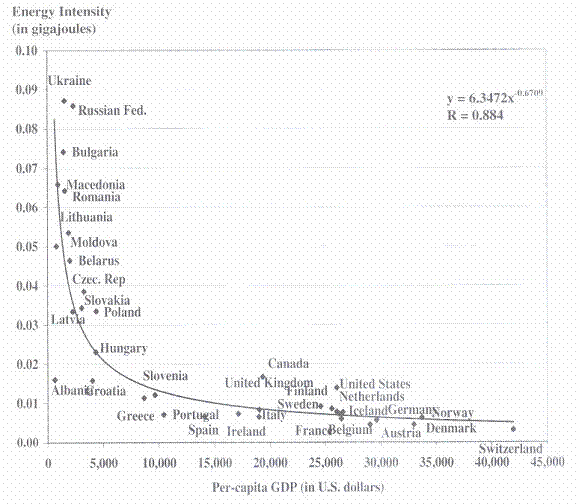
FIGURE 10: PLOT OF THE ENERGY INTENSITY VERSUS PER-CAPITA GROSS DOMESTIC
PRODUCT (GDP) FOR THE EUROPEAN COUNTRIES, 1995a
aR =correlation efficient.
The difference between the Western and Eastern European countries can be seen with the values of the energy consumption per unit of GDP for industry. The Russian Federation and Poland have more inefficient industry than France or the United Kingdom; Poland has a greater number of inefficient industries than Russia.
7.7 Africa
Africa is recognized as a low-income continent, composed mainly of developing
countries. In the last few years, many conflicts and changes in governments have occurred.
TABLE 3:
PER-CAPITA HOUSEHOLD ENERGY CONSUMPTION AND INDUSTRIAL ENERGY
CONSUMPTION PER UNIT OF GROSS DOMESTIC PRODUCT (GDP)
FOR A SAMPLE OF EUROPEAN COUNTRIES, 1995 |
||
Country |
Per-Capita Household Energy
Consumption
(in gigajoules) |
Industrial Energy onsumption per
Unit of GDP
(in igajoules per U.S. dollar) |
Norway |
46.9 |
0.011 |
Russia |
34.8 |
0.141 |
USA |
70.2 |
0.023 |
Greece |
21.1 |
0.017 |
France |
37.5 |
0.008 |
UK |
39.4 |
0.010 |
Poland |
20.0 |
0.081 |
TABLE 4:
SELECTEDAFRICANCOUNTRIESIN GROUPS BASEDON PER-CAPITA
GROSS DOMESTICPRODUCT(GDP), 1995 |
|||
Group |
Countries |
Per-Capita GDP(in U.S. dollars) |
Per-Capita Energy Consumption(in glgajoules) |
Africa 1 |
Libya, Gabon, South Africa, Mauritius, Tunisia and Algeria |
>1,000 |
25 120 |
Africa 2 |
All the other countries |
< 1,000 |
<25 |
Most of the African nations are unstable and resources are concentrated
in some countries. Table 4 shows the group based on GDP per capita in U.S.
dollars for African countries.
Figures 11 and 12 are similar to that of Asia; hence, these countries have been
divided into two groups. However, the difference between the highest GDP per
capita (Libya) and the majority is very different.
It is possible to distinguish the two groups in figure 12. Four countries in the
Africa 2 group (Mozambique, Tanzania, Ethiopia, and Malawi) have high energy
consumption per GDP. Since their energy consumption per capita does not seem
greater than for the majority in this group, they might have poor efficiencies. Nevertheless,
most of the countries are found in the lower left corner, having low GDP
per capita and low energy consumption per GDP.
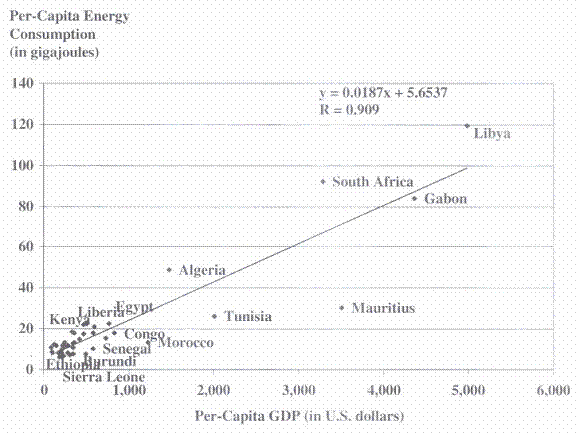
FIGURE 11: PLOT OF THE PER-CAPITA ENERGY CONSUMPTION VERSUS PER-CAPITA GROSS DOMESTIC PRODUCT (GDP) FOR AFRICAN COUNTRIES, 1995a
aR =correlation efficient.
The same calculation of energy consumption by household per capita and the energy consumption per unit of GDP for industry have been made for selected African countries; the results are presented in table 5. The value of energy consumption in household per capita is low for Angola and Ghana (Africa 2 group), indicating a low living standard. Algeria, Libya, and South Africa (Africa 1 group) have higher values. Cameroon has a very high and Morocco a very low value of energy consumption in household per capita compared to their place in figure 11. The energy consumption per unit of GDP for the industry does not have any relationship with the Africa 1 or Africa 2 groups. Angola has a very low value (like Libya), and Cameroon and SouthAfrica have a very high value even if they do not belong to the same group.
Africa-Group 1: The countries with a higher GDPpercapita than U.S. $1,000 are spread on the right side of figure 11. They have very different energy consumption per capita, ranging from 25 to 30 GJ for Algeria and Mauritius to 120GJ for Libya. Mauritius and Tunisia have similar energy consumption per capita, but Mauritius has a much higher GDP per capita.
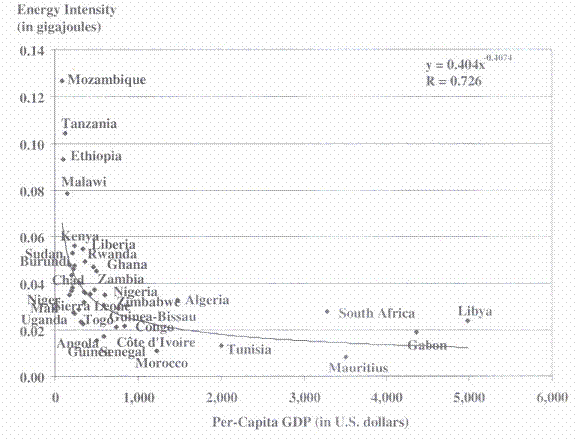
FIGURE 12: PLOT OF THE ENERGY INTENSITY VERSUS PER-CAPITA GROSS DOMESTIC PRODUCT (GDP) FOR AFRICAN COUNTRIES, 1995a
aR =correlation efficient.
TABLE 5: PER-CAPITA HOUSEHOLD ENERGY CONSUMPTION AND INDUSTRIAL ENERGY
CONSUMPTION PER GROSS DOMESTIC PRODUCT (GDP) FOR A
SAMPLE OF COUNTRIES IN AFRICA, 1995 |
||
Country |
Per-Capita Household Energy Consumption (in gigajoules) |
Industrial Energy Consumption Per Unit of GDP (in gigajoules per U.S. dollar) |
Algeria |
11.4 |
0.031 |
Angola |
1.3 |
0.016 |
Cameroon |
12.7 |
0.048 |
Ghana |
3.4 |
0.189 |
Libya |
6.8 |
0.021 |
Morocco |
3.3 |
0.012 |
South Africa |
14.9 |
0.039 |
At the same time, South Africa has a similar GDP per capita as Mauritius but much higher energy consumption per capita. The Africa 1 group can be separated in to two subgroups: four countries have higher energy consumption per capita than the others (Libya, South Africa, Gabon, and Algeria). This also is seen in figure 12. These four nations lie above the trend line, while Tunisia, Morocco, and Algeria are found below it. Two explanations can be given. First, the four countries noted have an economy based more on industry than the other three; the share of energy in GDP composition is 51 percent for Algeria, 67 percent for Gabon, 55 percent for Libya, and 39 percent for South Africa.23 For the other three, the value for the same is 29 percent for Mauritius, 33 percent for Morocco, and 28 percent for Tunisia. Moreover, table 3 gives a higher value for the energy consumption per GDP for industry for Libya, Algeria, and South Africa than for Morocco. Lower efficiency and the predominance of industry could explain the higher energy consumption per GDP of these four countries.
A significant difference is seen in the share of GDP composition between the countries of the African 1 and 2 groups. In most of the Africa 2 countries, agriculture's share in the GDP is much higher than for those in Africa 1. Somalia, for example, relies on agriculture for 59 percent of its GDP. That seems to indicate a lower industrialization level than for the countries of the Africa 1 group, which could explain both the lower energy consumption and lower GDP per capita. The fuel type consumption patterns also are very different. Except for Zimbabwe, Congo, and Mauritania, all the nations of the Africa 2 group use more than 50 percent of traditional fuel while in most of the Africa 1 group it accounts for a small portion.
Africa-Group 2: Figures 13 and 14 represent only the countries of the Africa 2 group; this permits a more precise study of them. The difference in energy intensities for the four countries-Mozambique, Ethiopia, Tanzania, and Malawi-can be noted in figure 14, indicating very low energy efficiencies. Lack of data does not permit computation of values like energy consumption per GDP for a specific sector that would be essential to find an explanation. In fact, the available information on these four countries and, for instance, Burundi and Central African Republic is very similar. The share of agriculture in the GDP composition is between 40 and 55 percent and these countries use mainly traditional fuel (accounting for over 90 percent of total fuel usage). All the countries of the Africa 2 group have similar characteristics and, in figure 11, form a small cluster. However, it is possible to distinguish two subgroups. Figure 13 shows that some nations detach themselves from the low-income category, which is the case with Egypt, Cameroon, Zambia, Mauritania, Zimbabwe, Cote d'Ivoire, and the Congo. These countries are spread to the right in figure 13 and have lower energy consumption per capita (as can be seen in figure 14). As noted earlier, the Africa 2 group exhibits very similar characteristics. Agriculture's share in the composition of the GDP is between 30 and 55 percent for the majorityof these countries (e.g., Lesotho, Eritrea, Angola, and Botswana), with a high percentage having values around 40 percent.
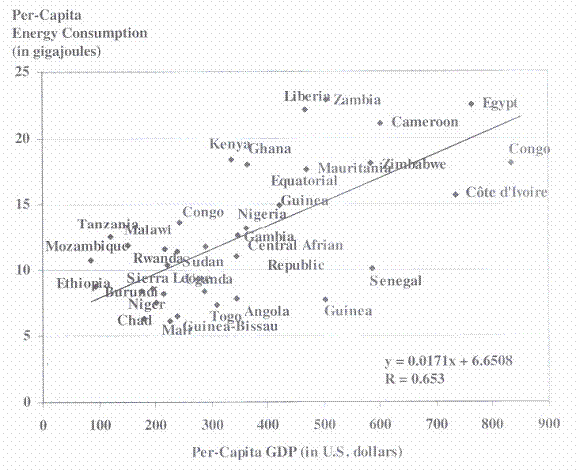
FIGURE 13: PLOT OF THE PER-CAPITA ENERGY CONSUMPTION VERSUS PER-CAPITA GROSS DOMESTICPRODUCT(GDP) FOR GROUP2 AFRICANCOUNTRIES,1995a
aR =correlation efficient.
This value is very high compared to the other continents, showing the low level of industrial development or the high percentage of traditional fuel used by the industries in Africa. As can be seen in figure 15, the percentage of traditional fuel used by many African countries is very high. Most of the states found in the second group (except Mauritania, Zimbabwe, Congo, and Senegal) show the share of traditional fuel use above 60 percent. Moreover, the majority of these states has a value higher than 80 percent. Improving the efficiency of traditional fuel devices would help to improve the situation.
7.8 South and Central America
Two groups could be distinguished in South and Central America although the
value of GDP per capita is more equally spread than for Asia or Africa. Nevertheless,six countries form a cluster with the remainder falling into a second group (table
6).
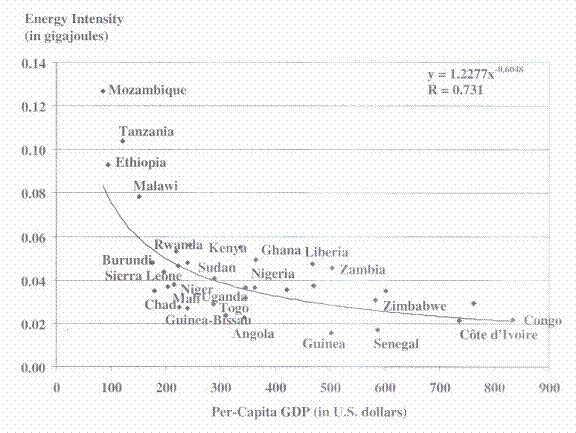
FIGURE 14: PLOT OF THE INTENSITY VERSUS PER-CAPITA GROSS DOMESTIC PRODUCT (GDP) FOR GROUP 2 AFRICAN COUNTRIES, 1995a
aR =correlation efficient.
six countries form a cluster with the remainder falling into a second group (table 6). Figure 16 is plotted for all the South and Central American countries; figure 17 is re-plotted without Trinidad and Tobago, Venezuela, Suriname, Jamaica, and Mexico.24 Values of the GDP per capita are well spread between U.S. $0 to $8,000 in South and Central America. The relationship found in figure 17 is then used to forecast the energy consumption per GDP in figure 18. This linear relationship tends to show that the South and Central American countries, despite differing stages of development, follow much the same path. While each has a different value of energy consumption and GDP, they all more or less have the same energy consumption per capita if they have the same per-capita GDP. The high value of energy consumption per capita in Trinidad and Tobago is because of the large share of energy consumed by the industrial sector. It uses 85 percent of the energy and its share in the GDP composition is 44 percent, indicating low efficiencies in this sector.
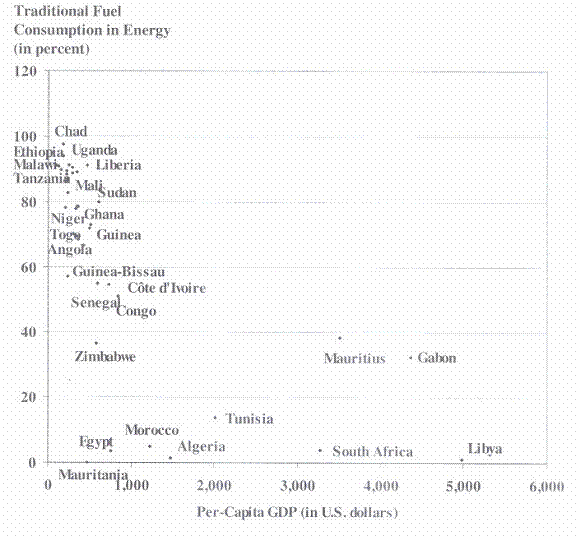
FIGURE 15: PLOT OF THE PERCENTAGE OF TRADITIONAL FUEL CONSUMPTION FOR AFRICAN COUNTRIES, 1995
TABLE 6: SOUTHAND CENTRALAMERICAN(SCA) COUNTRIESIN GROUPSBASED
ON GROSS DOMESTICPRODUCT(GDP) PER CAPITA, 1995 |
|||
Group |
Countries |
Per-Capita GDP
(in U.S. dollars) |
Per-Capita Energy onsumption (in gigajoules) |
SCA 1 |
Trinidad , Tobago , Argentina , Uruguay , Chile , Brazil and Venezuela |
3,500-8,000 |
40-250 |
SCA 2 |
All the other countries |
400-3,000 |
10-70 |
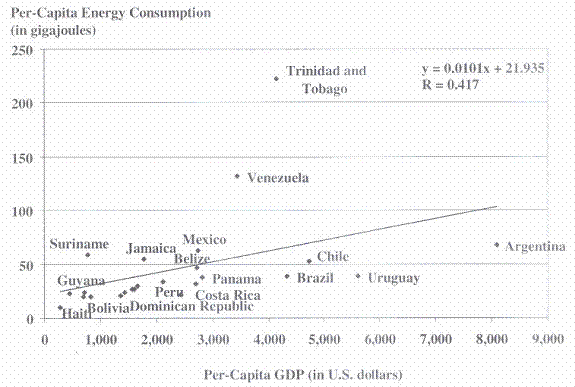
FIGURE 16: PLOT OF THE PER-CAPITA ENERGY CONSUMPTION VERSUS PER-CAPITA GROSS DOMESTIC PRODUCT (GDP) FOR SOUTH AND CENTRAL AMERICAN COUNTRIES, 1995a
aR =correlation efficient.
Venezuela and Mexico have relatively high energy-consuming industries. The share of traditional fuel in total energy consumption in South and Central America is between 30 and 70 percent, with the exception of Mexico, Jamaica, Argentina, Panama, Trinidad and Tobago, Suriname, and Venezuela. The agricultural share in the GDP tends to decrease when the GDP increases. For instance, this value is 42 percent for Haiti, 22 percent for Belize, 6 percent for Chile and 7 percent for Argentina. This may not always hold, for example, in the case of Belize, because other factors have to be taken into account. The same calculation of energy consumption in one household per capita and the energy consumption per unit of GDP for industry have been made for South and Central America; the results are presented in table 7. The indicators show fewer differences among the countries of South and Central America than for the other continents (tables 2, 3, and 5). The energy consumption in household per capita goes from 5.9 GJ for Brazil to 13.8 GJ for Argentina. The same observation can be applied to the energy consumption per unit of GDP for the industrial sector.
FIGURE 17: PLOT OF THE PER-CAPITA ENERGY CONSUMPTION VERSUS PER-CAPITA GROSS DOMESTIC PRODUCT (GDP) FOR THE SOUTH AND CENTRAL AMERICAN COUNTRIES EXCLUDING TRINIDAD AND TOBAGO, VENEZUELA, AND SURINAME, 1995a
aR =correlation efficient.
Figures 16 and 18 show that few countries do not follow the same linear relationship. Mexico and Venezuela, where energy consumption is quite high, have high values for both indicators, which indicates high energy consumption and possible poor efficiencies.25
7.9 Oceania
Table 8 shows the groups in Oceania countries based on GDP per capita. Five
countries have been selected and compared: Australia, New Zealand, Fiji, Papua
New Guinea, and the Solomon Islands.
Figure 19 shows a linear relationship between energy consumption per capita
and per-capita GDP. For Oceania, the value is eight times lower than for South and
Central America, that is, the energy consumption per GDP throughout Oceania issimilar, which can be seen in figure 20. Except for Papua New Guinea, all the
other values are close.
Two main differences are seen between the countries of the two groups of
Oceania. Fiji, the Solomon Islands, and Papua New Guinea (group 2) have apercentage of traditional fuel between 55 and 65 percent, while for Australia and
New Zealand (group 1) it is less than 3 percent.
FIGURE 18: PLOT OF THE ENERGY INTENSITIES VERSUS PER-CAPITA GROSS DOMESTIC PRODUCT (GDP) FOR SOUTH AND CENTRAL AMERICAN COUNTRIES, 1995a
aR =correlation efficient.
TABLE 7: PER-CAPITA HOUSEHOLD ENERGY CONSUMPTION AND NDUSTRIAL ENERGY
CONSUMPTION PER GROSS DOMESTIC PRODUCT (GDP) FOR A SAMPLE OF
COUNTRIES IN SOUTH AND CENTRAL AMERICA, 1995 |
||
Country |
Per-Capita Household Energy
Consumption
(in gigajoules) |
Industrial Energy Consumption
Per Unit of GDP (in gigajoules per U.S. dollar) |
Argentina |
13.8 |
0.010 |
Ecuador |
7.0 |
0.013 |
Brazil |
5.9 |
0.013 |
Colombia |
7.5 |
0.028 |
Bolivia |
6.0 |
0.035 |
Mexico |
10.2 |
0.048 |
Venezuela |
12.0 |
0.037 |
Peru |
7.9 |
0.009 |
TABLE 8: OCEANIA C GROUP BASED ON GROSS DOMESTIC PRODUCT (GDP) PER
CAPITA, 1995 |
|||
Group |
Countries |
Per-Capita GDP ( in U.S. dollars) |
Per-Capita Energy Consumption (in gigajoules) |
Oceania 1 |
Australia and New Zealand |
15,000-20,000 |
175 250 |
Oceania 2 |
Papua New Guinea , Fiji and Solomon Islands |
< 3,000 |
<30 |
FIGURE 19: PLOT OF THE PER-CAPITA ENERGY CONSUMPTION VERSUS PER-CAPITA GROSS DOMESTIC PRODUCT (GDP) FOR THE COUNTRIES OF OCEANIA, 1995a
aR =correlation efficient.
FIGURE 20: PLOT OF THE ENERGY INTENSITfES VERSUS PER-CAPITA GROSS DOMESTIC
PRODUCT (GDP) FOR THE COUNTRIES OF OCEANIA, 1995a
aR =correlation efficient.
The agricultural share in the GDP composition is between 20 percent and 30 percent for Fiji and Papua New Guinea and below 9 percent for Australia and New Zealand. Since the energy consumption per GDP is similar, it suggests that the industry and service sectors are not as well developed in the Oceania 2 group as in the Oceania 1 group, leading to lower energy consumption per capita, lower outcome from these sectors, but similar energy consumption per GDP.
7.10 Temporal Analysis
The analysis performed above gives an idea of the energy consumption and
GDP for each country, but it is also important to understand the variation-whether
these values are decreasing or increasing over time. Therefore, the values of the
two indicators for the last 20 years are plotted for a sample of countries chosen to
offer a good representation of the different groups noted earlier.
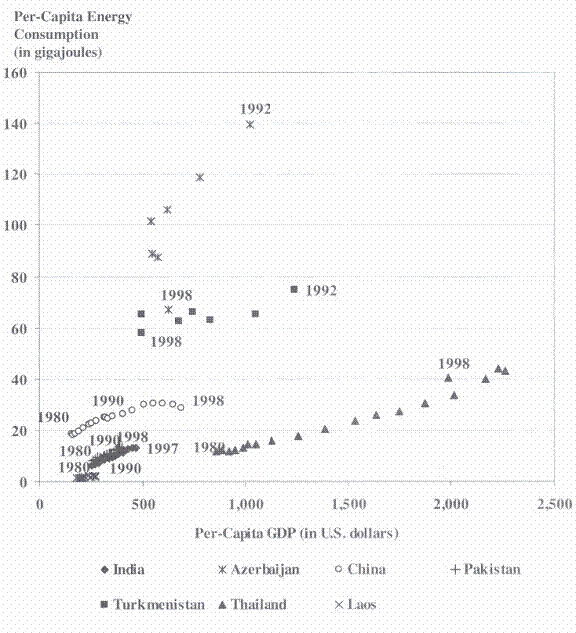
FIGURE 21:TEMPORAL ANALYSIS OF THE PER-CAPITA ENERGY CONSUMPTION FOR A SAMPLE OF ASIAN COUNTRIES, 1995
Asia:
Countries like Azerbaijan and Turkmenistan, which became independent only in the early 1990s, have data since then for temporal analysis. The energy consumption used in figures 21 and 22 is primary energy, excluding the traditional fuels. An increase in the energy consumption is expected in Thailand, China, India, and Pakistan. The analysis shows a rise in both energy consumption per capita and per-capita GDP. China has the most impressive growth and Laos the smallest. India and Pakistan have the same development. For Turkmenistan and Azerbaijan, the recent independence seems not to have had a great influence on growth. BothAzerbaijan's energy consumption per capita and the GDP per capita have declined. It is interesting to notice that in the early 2000s Azerbaijan's GDP is increasing but the energy consumption is still falling.
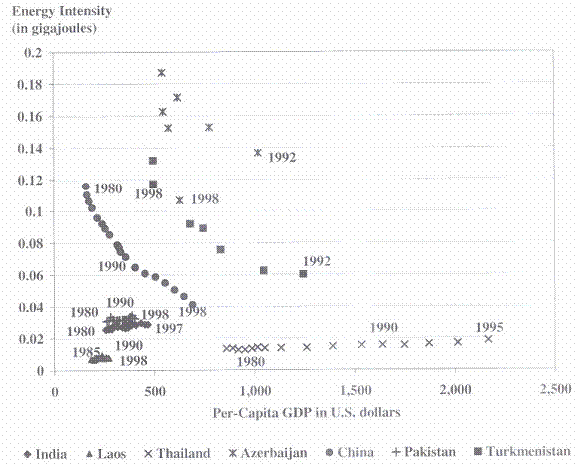
FIGURE 22:TEMPORAL ANALYSIS OF THE ENERGY CONSUMPTION PER UNIT OF GROSS DOMESTIC PRODUCT (GDP)-ENERGY INTENSITY-FOR A SAMPLE OF ASIAN COUNTRIES, 1995
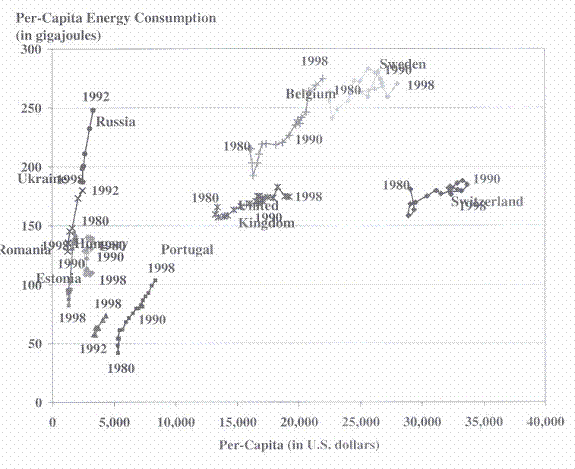
Figure 21 shows that Thailand, India, Pakistan, and Laos increased their GDP per capita with stable per-capita energy consumption. Among them, Thailand has better growth for the past 10 years (1985- 1995); China shows a major improvement in efficiency where energy consumption per GDP decreased significantly. Figure 22 shows the energy consumption per GDP for a sample of Asian countries. Europe: Temporal analysis of the energy consumption per capita for selected sample European countries is shown in figure 23. It is decreasing in the eastern nations of Europe, prominently for Russia, Ukraine, and Romania. For Hungary, the drop seems to have stopped. Analysis shows the difficulties that countries ofthe former Soviet Union encountered with independence and the economic liberalization. The energy intensity of sample European countries is shown in figure 24
 .
.FIGURE 23: TEMPORAL ANALYSIS OF THE PER-CAPITA ENERGY CONSUMPTION FOR A SAMPLE OF EUROPEAN COUNTRIES, 1995
The slopes of the development of the Europe 2 group are quite steep compared to the Europe 1 group. It is difficult to say if the slopes of the Europe 2 group countries will decrease when they reach higher energy consumption levels. If so, that would be a positive direction. It is possible to observe that countries having a low GDP per capita have a tendency to increase energy production rather than energy efficiency. The reason for the high slope is due to a:decrease in efficiencies that could be explained, for example, by a lack of maintenance in the main power plants. Switzerland encountered a reverse with a decrease in the GDP per capita in the early 1990s. Africa: The plot of the energy consumption per capita versus the GDP per capita for the past 20 years has been divided in two figures (25 and 26) because the temporal analysis was not possible otherwise. Except for Zimbabwe, the countries presented in figure 25 are from the Africa I group; figure 26 presents the same plot for nations of the Africa 2 group.
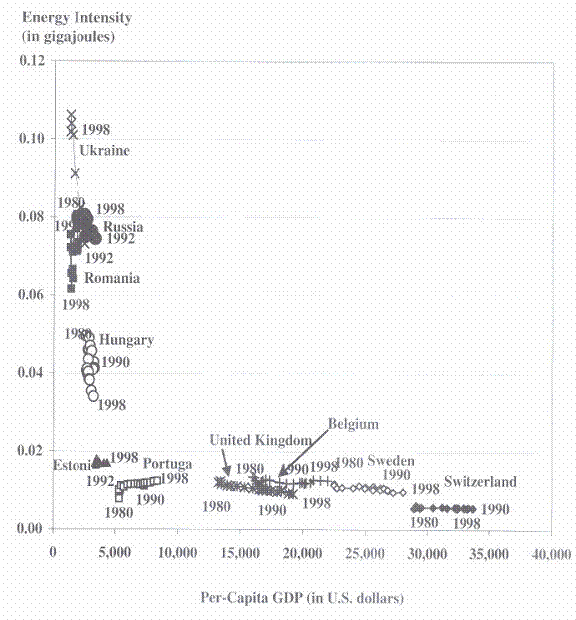
FIGURE 24: TEMPORAL ANALYSIS OF THE ENERGY CONSUMPTION PER UNIT OF GROSS DOMESTIC PRODUCT (GDP)-ENERGY INTENSITY-FOR A SAMPLE OF EUROPEAN COUNTRIES, 1995
Figures 25 and 26 show a different variation of that for Europe and Asia. If the North African countries of Morocco and Algeria have seen an increase in GDP during the past 20 years, it is not at all the case for the others. Figure 25 indicates that South Africa has been experiencing a decline in its GDP per capita for the past 20 years; Zimbabwe appears unchanged with but a very small increase.
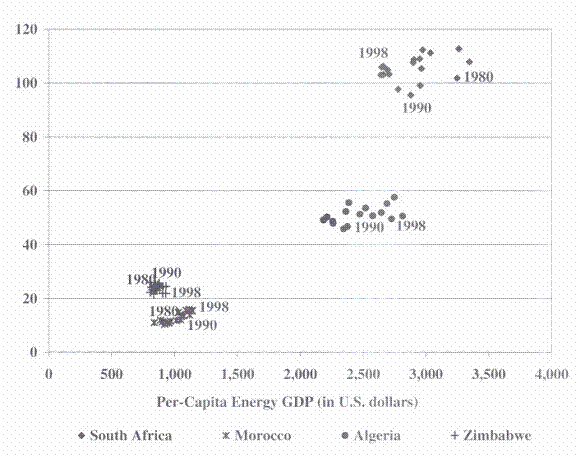
FIGURE 25:PLOT OF THE EVOLUTION OF THE PER-CAPITA ENERGY CONSUMPTION OVER TWO DECADES FOR A SAMPLE OF AFRICAN GROUP 1 COUNTRIES, 1995 (in gigajoules)
In the Africa 2 group, the development of the countries differs. Mali has improved, even if the values for the past seven years (1988-1995) are not available. During 1980 and 1991, its GDP per capita increased without an increase in its energy consumption (seen in figure 26). Sierra Leone, for instance, saw its GDP decreasing for the past 20 years and its energy consumption per capita more or less constant. Tanzania and Ethiopia had only slight changes; nonetheless, after two decades their situations appear unchanged. Figure 27 shows energy intensities for the past 20 years for a sample of African countries. In Asia and Europe, the temporal analysis of the countries showed perhaps two or three different behaviors, generally depending on the group to which a nation belonged. This does not appear to apply in Africa. Additional analysis probably could explain these trends; some factors to consider would be political changes, wars, and the consequent political and economic instability.
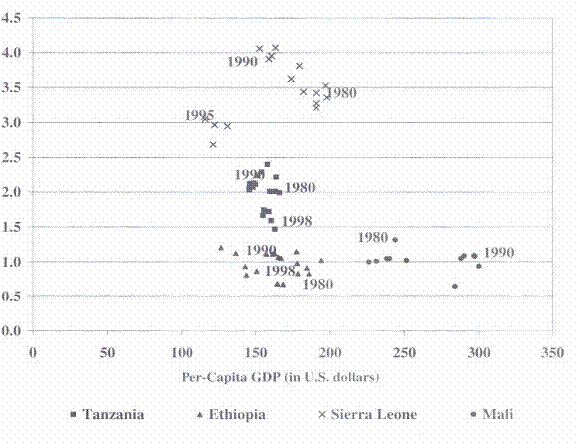
FIGURE 26: PLOT OF THE EVOLUTION OF THE PER-CAPITA ENERGY CONSUMPTION OVER TWO DECADES FOR FOUR POOR COUNTRIES OF AFRICA GROUP 2, 1995 (in gigajou1es)
South and Central America: A plot of the evolution of the energy consumption per capita for the past 20 years for a sample of South and Central American countries is shown in figure 28. The temporal analysis shows that an increase or decrease in the GDP occurs at the same time in most of the countries, except for Haiti, which is the lowest income in the region. From 1980 to 1990, the GDP per capita and the energy consumption per capita decreased for all the countries presented in figure 28; after 1990, it started to increase again for all these countries. As noted earlier, the evolution of the countries follow a similar path, with different intensities. In figure 29, it is also possible to see that a decrease or an increase in GDP occurs at the same time for the countries.
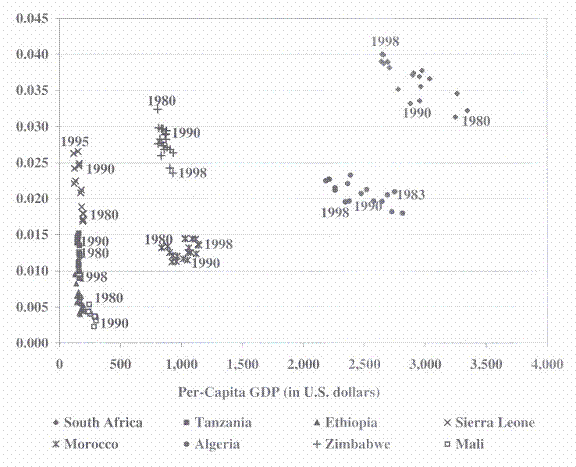
FIGURE 27: PLOT OF THE ENERGY CONSUMPTION PER UNIT OF GROSS DOMESTIC PRODUCT (GDP)-ENERGY INTENSITY-OVER TWO DECADES FOR A SAMPLE OF AFRICAN COUNTRIES, 1995
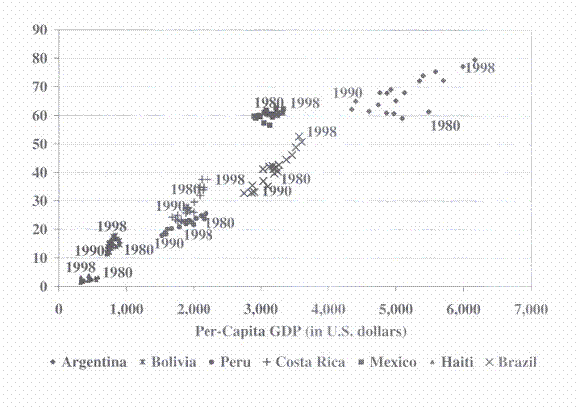
FIGURE 28:PLOT OF THE EVOLUTION OF THE PER-CAPITA ENERGY CONSUMPTION OVER TWO DECADES FOR A SAMPLE OF SOUTH AND CENTRAL AMERICAN COUNTRIES, 1995 (in gigajoules)
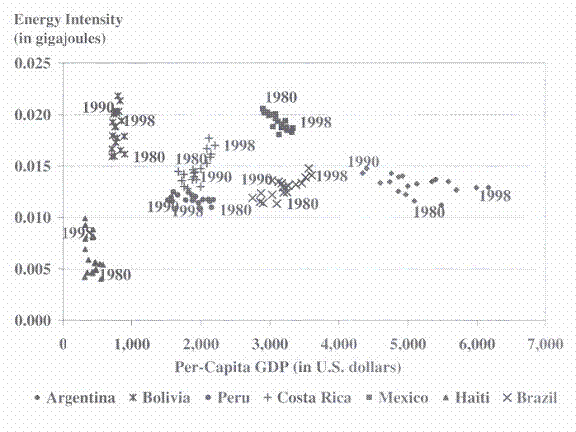
FIGURE 29: PLOT OF THE EVOLUTION OF THE ENERGY CONSUMPTION PER UNIT OF GROSS DOMESTIC PRODUCT (GDP) OVER TWO DECADES FOR A SAMPLE OF SOUTH AND CENTRAL AMERICAN COUNTRIES, 1995