 |
Urban Landscape analysis through Spatial Metrics |
 |
1Energy and Wetlands Research Group, Centre for Ecological Sciences [CES], 2Department of Management Studies, 3Centre for Sustainable Technologies (astra),
4Centre for infrastructure, Sustainable Transportation and Urban Planning [CiSTUP],
Indian Institute of Science, Bangalore – 560012, India.
*Corresponding author: cestvr@ces.iisc.ac.in
|
Methods
Maximum Likelihood classifier (MLC) was used to classify temporal RS data into 4 LC classes – builtup (urban, concrete roofs, roads, flyovers, pavements), vegetation (parks, gardens), water bodies (lakes, ponds, wetlands) and open area (play grounds, walk ways, etc.) using the signatures generated with the training data obtained from field visits and Google Earth image. MLC is a parametric classifier that can train quickly with a capability to handle huge datasets. In fact, this also aids as ‘benchmark’ for evaluating the performance of novel classification algorithms. This method constitutes a historically dominant approach to RS-based automated LC derivation (Gao, J., 2004) and has become popular and widespread in RS because of its robustness (Hester et al., 2008). In the absence of historical data, training pixels were collected from the false colour composite of the respective bands (for the year 1973, 1992 and 2000). Since the focus of this study was to analyse the temporal urban growth pattern, so LC categories were grouped into ‘urban’ and ‘non-urban’ classes. Further, the classified images were segmented based on 8 cardinal directions. 10 spatial metrices (table 1) were computed using r.li program in GRASS (http://wgbis.ces.iisc.ac.in/foss) and Fragstats (McGarigal, 1995). The overall procedure is as depicted in figure 2.
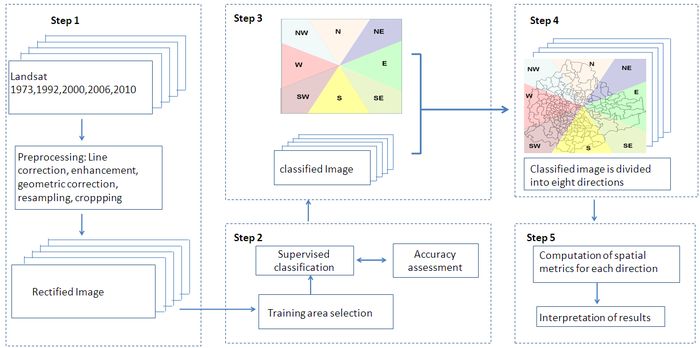
Figure 2: Schematic representation of the methods used in this study.
Table 1: Description of metrics used in this study
| Sl No. |
Indicators |
Formula |
Description |
| 1. |
Builtup (total land area) |
- |
Total builtup land (in ha). |
| 2. |
Largest patch |
- |
Largest urban patch in area. |
| 3. |
mean patch size |
 |
Calculates mean patch size index on a raster map, using a 4 neighbour algorithm. |
| 4 |
Number of Urban Patches |
 |
Fragmentation Index, NP equals the number of patches in the landscape. |
| 5. |
Normalized Landscape Shape Index |
 |
Where si and pi are the area and perimeter of patch i, and N is the total number of patches. |
| 6. |
Patch edge density |
 |
- k: patch type
- m: number of patch type
- n: number of edge segment of patch type k
- eik :total length of edge in landscape involving patch type k
- Area: total landscape area
|
| 7. |
Area weighted mean patch fractal dimension
(AWMPFD) |
 |
Where si and pi are the area and perimeter of patch i, and N is the total number of patches. |
| 8 |
Compactness Index (CI) |
 |
si and pi are the area and perimeter of patch i, Pi is the perimeter of a circle with the area si and N is the total number of patches. |
| 9 |
Clumpiness |

 |
- gii =number of like adjacencies (joins) between pixels of patch type (class) I based on the double-count method.
- gik =number of adjacencies (joins) between pixels of patch types (classes) i and k based on the double-count method.
- min-ei =minimum perimeter (in number of cell surfaces) of patch type (class)i for a maximally clumped class.
- Pi =proportion of the landscape occupied by patch type (class) i.
|
| 10 |
Ratio of open space (ROS) |
 |
Where s is the summarization area of all “holes” inside the extracted urban area, s is summarization area of all patches. |
The spatial metrics employed here are a series of qualitative indices representing physical characteristics of the landscape mosaic. Builtup (total land area) is the total builtup area (in hectares) and largest patch indicates the largest urban patch in terms of area considered in this study. Mean patch size is the average area of all patches in the landscape (in ha) (Buyantuyev, 2009). Number of patches of a particular patch type is a simple measure of the extent of subdivision or fragmentation of the patch type. A simple shape index measures the complexity of patch’s boundary by calculating a normalised ratio of its perimeter to its area. Edge density equals the sum of the lengths(m) of all edge segments involving the corresponding patch type, divided by the total landscape area (m2), multiplied by 10,000 (to convert to hectares). Edge density is zero when there is no class edge in the landscape. AWMPFD metric measures the irregularity of patch shape and describes the raggedness of urban boundary. This fractal dimension approaches “one” for shapes with simple perimeters and approaches “two” when the shapes are more complex. The compactness index (CI) measures not only the individual patch shape but also the fragmentation of the overall urban landscape (Huang et al., 2007). The more irregular the patch shape and patch number, the bigger the CI value. Clumpiness index is calculated from the adjacency matrix, which shows the frequency with which different pairs of patch types (including like adjacencies between the same patch type) appear side by side on the map. Ratio of open space measures the open space compared against total urban area. Open space is crucial both as an amenity for residents and sustainability of cities.
|
|
Citation : Anindita Dasgupta, Uttam Kumar, and Ramachandra T. V., (2010), Urban landscape analysis through Spatial Metrics, Proceedings of International Conference on Infrastructure, Sustainable Transportation and Urban Planning, (CISTUP@CiSTUP), Indian Institute of Science, Bangalore, India, 18-20 October, 2009.
|