![]()
Dr. Ramachandra T.V.
Centre for Application of Science and Technology to Rural Areas (ASTRA), Indian Institute of Scienc

|
Centre for Application of Science and Technology to Rural Areas (ASTRA), Indian Institute of Scienc |
|
| Abstract Introduction Objectives Study Area Methodology Results and Discussion Conclusion Acknowledgement References Home PDF |
|
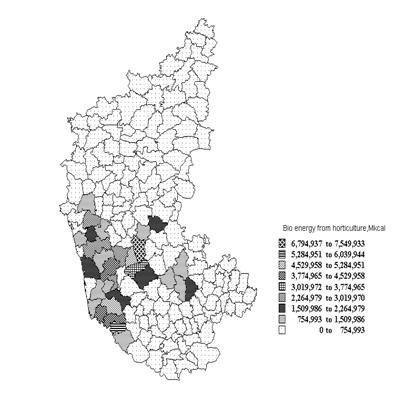
RESULTS AND DISCUSSION Bioresource Availability: Resource wise analysis of the study area reveals that bioresource from horticulture constitutes the major share of 43.6%, forest 39.8%, agriculture 13.3%, livestock 3.01%, and plantation.15%. Table 1 gives the percent bioresource contributing to the total bioenergy. Table 1: Total bioenergy in Mkcal and % contribution of each bioresource
Bioenergy from Agriculture residue: Agriculture is the major source of biomass raw material either as agricultural by-products or as specially grown crops for energy use. The use of crop residue is wide spread in most parts of India. Agriculture is predominant in northern dry zone, which contributes the highest amount of agro residues and the bioenergy amounts to 10.59 x 10⁶ Mkcal. Talukwise computation of bioenergy availability as illustrated in Figure 2 indicates that Athani taluk (in ACZ3) in Belgaum district has highest energy (1.51 x 10⁶ Mkcal) compared to Bantwal taluk (ACZ10) in Dakshina Kannada district that has the least potential (1147.72 Mkcal). Figure 2: Taluk wise distribution of bio energy from agricultural residue Computation of percentage share of bioenergy to the total energy of the region reveals that taluks such as Athani (ACZ3), Mandya (ACZ6), Hosanagara (ACZ9), Jagalur (ACZ4), Belgaum (ACZ8) etc., have bioenergy > 80%. Compared to this, taluks such as Bangalore-North (ACZ5), Kadur (ACZ4), Tharuvekere (ACZ6), Bantwal (ACZ10), etc. have least contribution (<8%). Bioenergy from Forests: Forests are predominant in hilly and coastal zones contributing to the highest amount of bioenergy available. Talukwise computation of bioenergy availability from forests as shown in Figure 3, indicates that, Kollegal (ACZ6) taluk in Chamrajnagar district has highest energy (5678778 Mkcal) compared to six taluks in the State where there are no forests and have least potential. Computation of percentage share of bioenergy from forests reveals that taluks such as Honnavar (ACZ10), Kollegala (ACZ6), Virajpet (ACZ9) etc. have bioenergy from forest residues >80%. Compared to this, Raichur (ACZ2), Maddur (ACZ6), Kundagola (ACZ 8), Indi (ACZ3), etc have least contribution (<1%) due to the absence of forests. Figure 3: Taluk wise distribution of bio energy from forest Bioenergy from Horticulture: Horticulture is predominant in coastal zone. The highest amount of bioenergy available from horticulture residues in this zone amounts to 25282919 Mkcal. Talukwise computation of bioenergy availability from horticulture as illustrated in Figure 4 which indicates that Channagiri (ACZ7) taluk in Shimoga district yields maximum energy (7549933 Mkcal) and 5 taluks in Bidar (ACZ1) district yield no energy. Computation of percentage share of bioenergy reveals that taluks such as Belthangadi (ACZ10), Channagiri (ACZ7), Koppa (AGC9), Tharuvekere (ACZ6), Tumkur (ACZ5) etc. derive maximum (>80%) energy, when compared to taluks such as Navalagunda (ACZ3), Challekere (ACZ4), Aurad (ACZ1), Devadurg (ACZ2) where there is minimum or no energy derived from horticulture residue, as in these taluks coconut, areca and cashew plants are not grown. Figure 4: Taluk wise distribution of bio energy from horticulture residue Bioenergy from Plantation: Plantation is predominant in hilly zone. The highest amount of bioenergy available from plantation in this zone amounts to 1141.29 Mkcal. Talukwise computation of bioenergy availability is illustrated in Figure 5, which indicates that Sagar (ACZ9) taluk in Shimoga district (41607.5 Mkcal) yields maximum energy from plantation when compared to 75 taluks in the State with zero potential. Figure 5: Taluk wise distribution of bio energy from plantation Bioenergy from Livestock: Livestock is predominant in northern dry zone. The highest amount of bioenergy available from livestock in this zone amounts to 1361001Mkcal. Talukwise computation of bioenergy availability illustrated in Figure 6 indicates that Raibag (ACZ3) taluk in Belgaum district (99588.87 Mkcal) has highest energy compared to Gudibanda (ACZ5) taluk in Kolar district (6438.28 Mkcal), which has the least potential. Computation of percentage share of bioenergy from animal residue shows that taluks such as Raibag (ACZ3), Bylhongal (ACZ8) etc. derive maximum bioenergy (>10%), compared to taluks such as Honnavar (ACZ10), Siddapura (ACZ9), Malur (ACZ6), Gudibanda (ACZ5) etc. that have least contribution (<1%). By considering taluk wise livestock population, lower dung yield figures, and annual biogas production the total dung available from cattle and buffalo is 11.83 million tonnes/year and 29.58 million tonnes/year respectively. Assuming the biogas (m3) produced per Kg of the cattle/buffalo dung to be 0.036m3/day and taking the lower dung yield for each of the two, about 1114012196 m3 of biogas can be produced annually. Using higher dung yields and higher biogas yields, the total amount of gas produced worked out to be 2245.6 x 106 m3. Figure 6: Taluk wise distribution of bio energy from livestock Computation of the total bioresource available for energy show that Channagiri has highest bioresource and source wise analysis show that horticultural residues (83.97%) and forests (13.65%) contribute a major percentage followed by agricultural residues (1.67%), animal residues (0.65%) and plantation (0.04%). Bioresource availability is lowest in Anekal and the source wise analysis shows that horticulture residue (37.74%), livestock (28.54%) and agricultural residue (21.16%) contribute mainly for the energy production followed by forest residue (8.80%) and plantation (3.74%). Bioresource Demand and Status: The ratio of availability to demand indicates the bioresource status of various taluks in the state. Ratio greater than one indicates the presence of surplus bioresource, while a value less than one characterises a bioresource deficient zone. Table 2 gives Taluk wise for Karnataka state the values of biomass availability, demand and status. Figure 7 illustrates bioresource surplus and deficit zones in the state. The computation of bioenergy availability, demand and status talukwise shows that Siddapura (ACZ9) taluk in Uttara Kannada district has the highest bioenergy status of 2.004. Anekal (ACZ5) taluk in Bangalore Urban district has the least status of 0.004. Table 2: Taluk wise status of bioenergy in Mkcal.
Note: There are 175 taulks in Karnataka and this Table provides the bioenergy status of representative taluks where field sampling was carried out Figure 7: Taluk wise distribution of bioresource surplus and deficient zones |
 |
| E-mail | Sahyadri | ENVIS | Energy | GRASS | CES | IISc | E-mail |