 |
Spatial Decision Support System for Assessing Micro, Mini and Small Hydel Potential |
 |
| 1 T.V. Ramachandra, Rajeev Kumar Jha, S. Vamsee Krishna and B.V. Shruthi Centre for Ecological Sciences, 1 Centre for Sustainable Technology, Indian Institute of Science, Bangalore 560012, India |
|
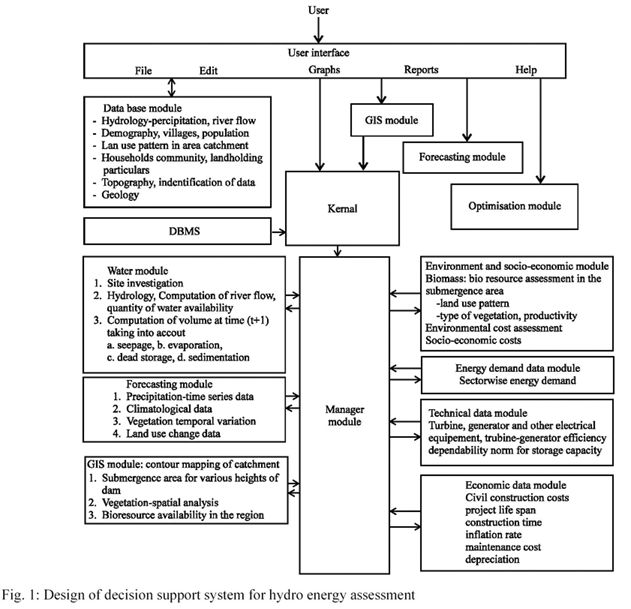
Materials and Methods The DSS of Hydro energy assessment shown in Fig. 1, is a Graphic User Interface (GUI), developed using Microsoft Visual Basic 6.0 as front end with MS Access database as backend. This GUI Environment helps in entry, edit or update of database along with the options to compute power and energy at selected locations. Measurement of catchment area: Catchment boundaries are located with the help of GIS using the contour lines on
a topographical map. Boundaries are drawn following the ridge tops, which appear on toposheet as downhill pointing V-shaped crenulations. The boundary should be perpendicular to the contour lines it intersects. The tops of mountains are often marked, as dots on a map and the location of roads, which follow ridges, are other clues. The catchment area thus marked/traced is measured directly from the marked maps using a planimeter. Land use analyses in the catchment area : Land use is the use of land by humans, usually with emphasis on the functional role of land such as land under forests, agriculture, plantation, pastures, etc. Land use pattern in the catchment has direct implications on hydrological yield. Also, construction of hydropower plants across any river or stream will have a direct impact on the land use pattern. Land use analyses are done using remote sensing and GIS. Stream discharge: Estimation of stream discharge could be done either by direct or by indirect methods. Direct estimation of flows at site: Stream discharge is the rate at which a volume of water passes through a crosssectional area per unit time. It is usually expressed in units of cubic meters per second (m3 S-1). The velocity-area method using a current meter is used for estimating discharge. The cup type current meter is used in a section of a stream, in which water flows smoothly and the velocity is reasonably uniform in the cross-section. This measurement is normally carried out for three consecutive days every month for 18 months in order to take into account day-to-day fluctuations and also seasonal variations. Indirect estimation of flows at site: Runoff is the balance of rainwater, which flows or runs over the natural ground surface after losses by evaporation, interception and infiltration. The yield of a catchment area is the net quantity of water avai lable for storage, after all losses, for the purpose of water resource utilization and planning. The runoff from rainfall was estimated by empirical and rational methods: 1. Empirical formula: the relationship between runoff and precipitation is determined by regression analyses based on our field data. Eq gives empirical relation between variables runoff and precipitation is given by eq 1: R = 0.849 . p. 30.5 -----(1) Where, R: runoff, P: rainfall in cm. 2. Rational method: a rational approach is used to obtain the yield of a catchment area by assuming a suitable runoff coefficient. Yield = C*A*P -------(2) Where, C: runoff coefficient, A: catchment area and P: rainfall. The value of C varies depending on the soil type, vegetation, geology, etc. From 0.1 to 0.2 (heavy forest), 0.2 to 0.3 (sandy soil), 0.3 to 0.4 (cultivated absorbent soil), 0.4 to 0.6 (cultivated or covered with vegetation), 0.6 to 0.8 (slightly permeable, bare) to 0.8 to 1.0 (rocky and impermeable). Stream flow and precipitation: Distributions of annual river and stream flows are affected by physiographic factors of a watershed area apart from its precipitation. The literature regarding watershed response can be classified into two general groups. The majority of the research has dealt with obtaining the time distributions of direct surface runoff at a point, given the volume and distribution of the effective rainfall. The remaining part deals with the total rainfall-runoff relationship, including estimation of the volume of effective rainfall and considering loss functions experienced by storm rainfall. Studies regarding the conversion of effective rainfall to hydrographs of stream flow at the catchment/watershed outlet stem primarily from unit hydrograph theory. The theory has been modified, applied, verified and used for analysis and synthesis. The concept of the instantaneous unit hydro graph along with various storage and routing ideas has led to numerous theoretical response models. On the other hand, few rainfall-runoff models have been investigated with emphasis on the conversion of rainfall to effective runoff. Hydrograph depicts stage, discharge, velocity or other properties of water flow with respect to time. It can be regarded as an integral expression of physiographic and the climatic characteristic that govern the relations between the rainfall and the runoff of a particular drainage basin. A unit hydrograph is the graph resulting from 25 mm effective rainfall generated uniformly over the basin at a uniform rate during specific period of time or duration. The unit hydro graph procedure can be applied to data from small catchment/watershed. However, the relatively short time unit required makes the derivation of the unit hydrograph a difficult task and as a result, a synthetic hydrograph approach is used. A synthetic hydrograph is prepared using the data from a number of watersheds to develop a dimension less unit hydrograph applicable to un gauged catchment/watershed. Stream flow and ecology are both affected by catchment conditions. Changes in stream discharge and sediment loading, caused by the modification of the catchment area are reflected in variations in the rate of sediment transport, channel shape and stream pattern. Responses to a change may be immediate, delayed or dependent upon a critical factor reaching a threshold level. It is necessary to know the response of catchment/watershed to rainfall in order to design structures, such as overflow spillways on dams, flood protection works, highway culverts and bridges. The rate at which runoff moves towards the stream is dependent on the drainage efficiency of the hill slopes. Drainage efficiency is influenced by the slope and length of upland surface, its micro topography, the permeability and moisture content of the soil, subsurface geology and vegetation cover. The hydro potential of each stream is assessed so as to have micro, mini or small hydro power plants. Power and energy: The evaluation of hydropower potential requires knowledge of both the absolute value and the time variability of flow and head. Power (P in kW) is calculated based on flow data and head height, as given in equation 3. The corresponding electrical energy (kWh) produced is given by Eq. 4: Power = 9.81 * Average (flow data) * Average (head height) ------(3) Energy = P * t * n * f ------ (4) Where, P: power in kW, t: operating time in hours, n: efficiency of the turbine generator assembly, f: coefficient for seasonal flow variation for run of river installation. DSS validation: DSS is validated with the field data collected for exploring the feasibility of small, micro and mini hydel schemes in Uttara Kannada district of Western Ghats. Study area: Uttara Kannada District located in the mid-western part of Karnataka state is selected for this study. It lies 74°9' to 75°10' east longitude and 13°55' to 15°31' north latitude and extends over an area of 10291 sq km, which is 5.37% of the total area of the state, with a population above 12 lakh. It is a region of gentle undulating hills, rising steeply from a narrow coastal strip bordering the Arabian Sea to a plateau at an altitude of 500 m, with occasional hills rising above 600 to 860 m. According to the recent remote sensing data, of the 10291 sq km geographical area, 67.04% is under forest, 1. 94% under paddy and millet cultivation, 1.26% under coconut and areca garden, 1.94% under rocky outcrops and the balance 27.82% is under habitation and reservoirs. There are four major rivers-Kalinadi, Bedthi, Aghnashini and Sharavathi. Besides these, many minor streams flow in the district. This district with 11 taluks can be broadly categorized into three distinct regions-coast lands (Karwar, Ankola, Kumta, Honnavar and Bhatkal taluks), mostly forested Sahyadrian interior (Supa, Yellapur, Sirsi and Siddapura taluks) and the eastern margin where the tableland begins (Haliyal, Yellapur and Mundgod taluks). Climatic conditions ranged from arid to humid due to physiographic conditions ranging from plains, mountains to coast. This large variety of natural conditions provides the basis for generalization of the theoretical probability distributions for annual precipitation. Among the four rivers, the hydro potential of Kali and Sharavathi has been tapped already for power generation. The completed large-scale projects have caused serious environmental damage in the form of submergence of productive natural virgin forests, horticulture and agricultural lands, etc. In view of these, we assess the potential of the Bedthi and Aghnashini rivers and explore ecologically sound means of harnessing the hydro energy. Catchment area: The catchment area for streams is obtained from the Survey of India toposheets. Stream gauging is done with both direct and indirect methods. Catchment area measured from the marked toposheets using planimeter for the streams in Bedthi and Aghnashini river basins. Along the Bedthi river course drops at various points have been identified: Kalghatgi (80 m), Kaulgi Halla (64 m), major drop at Magod (of about 340 m) and the lowest drop 8.5 m is in Ankola taluk, about 129 km from Kalghatgi. Numerous streams join the river along its course from Kalghatgi. Major streams with good drops (head) are Shivganga (119 m), Handinadi (230.50-318.50 m) and Matti gatta (270 m). The Aghnashini river has major drops at Unchalli (360 m) and the major streams are Benne (400 m drop), Bhimavara (290 m), Mudanalli (270 m), etc. The average channel slope (Sc) is one of the factors controlling water velocity, while the slope of the catchment (Sb) influences surface runoff rates. These two parameters give an idea about the nature of a stream. Hence S, and So are computed. Magod has a slope of 61.34°. The Shivganga and Mattigatta streams of the Bedthi catchment have slopes 43.83° and 40.03°, while Muregar and Boosangeri have slopes of 6.27° and 2.29°. The Muregar jog has a catchment of 25.97 sq km, while Boosangeri has 11.29 sq km. Stream gauging at regular intervals is calTied out in Muregar, Boosangeri, Vanalli and Shivganga. |
| E-mail | Sahyadri | ENVIS | GRASS | Energy | CES | CST | CiSTUP | IISc | E-mail |
