6. Results |
GIS is used for identifying and quantifying the effect of local constraints on the renewable energy potential. This helped in providing the flexibility to enrich the database, with spatial data on which decisions are based. This will provide additional renewable energy availability restriction considering spatial parameters.
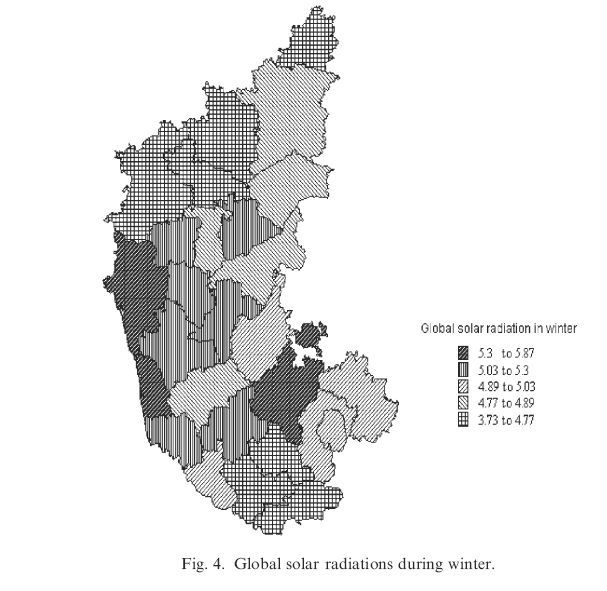
Global solar radiation in Uttara Kannada during summer, monsoon and winter is 6.31, 4.16 and 5.48kWh/m2, respectively. Similarly, Dakshina Kannada has 6.16, 3.89 and 5.21kWh/m2 during summer, monsoon and winter, while Mandya district has minimum global solar radiation of 5.41, 3.45 and 3.73 kWh/m2 during summer, monsoon and winter, respectively. The results were implemented in GIS to obtain maps showing districtwise variation of global solar radiation. Fig. 2 shows the districtwise variation of global solar radiation during summer, Fig. 3 during monsoon and Fig. 4 during winter.
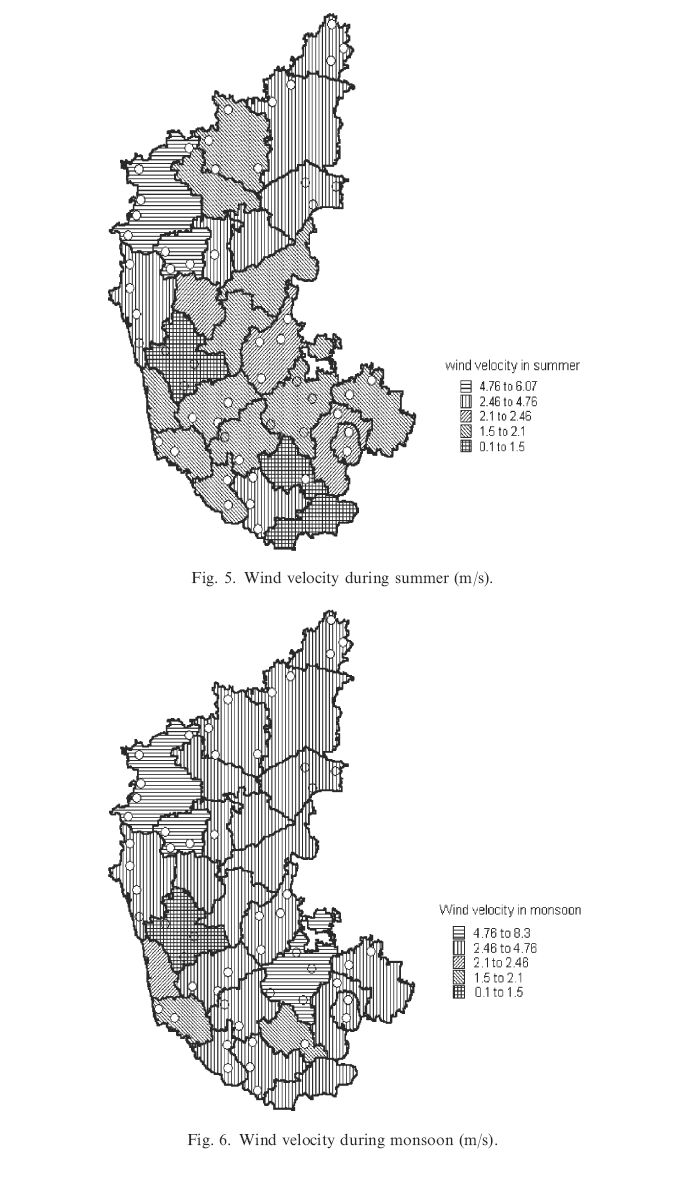
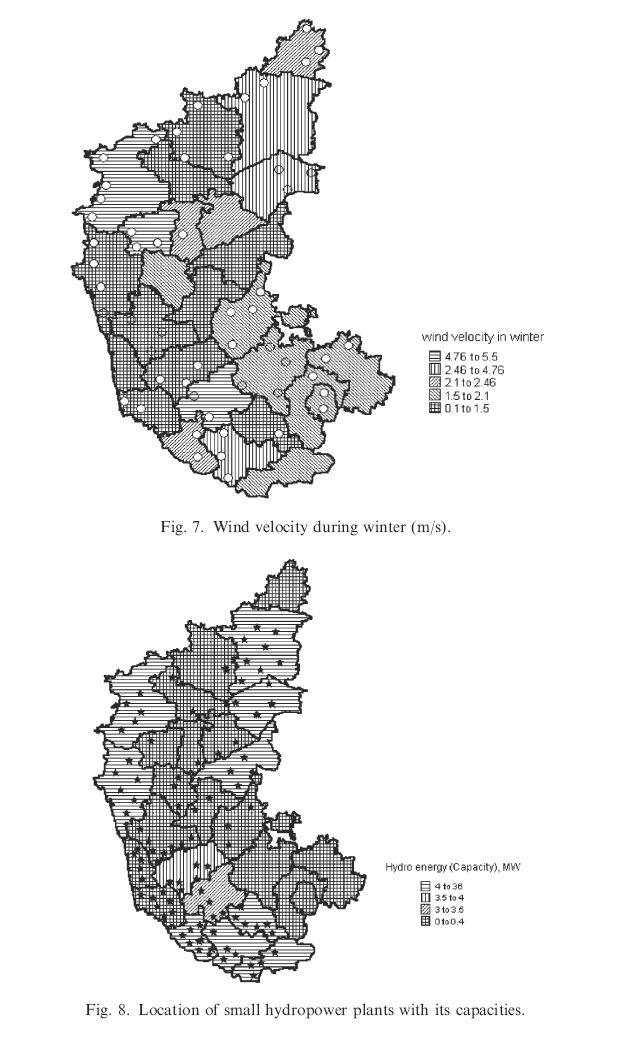
Wind potential maps across various seasons were generated using GIS considering seasonal wind velocities at various locations. Wind velocities are presented as thematic layers, which help in identifying the sites with higher energy production. Figs. 57 depict the wind potential variability across seasons (summer, monsoon and winter) and across districts in Karnataka State, India. The wind potential is evaluated stationwise and is represented by a polygon in the map. A polygon corresponds to a district, which is an administrative unit in India to implement wind energy programmes at disaggregated levels. The map also shows the number of wind-monitoring stations. Chikkodi in Belgaum has the highest wind velocity.
Wind velocity in Chikkodi taluk, Belgaum district, during summer, monsoon and winter are 6.06, 8.27 and 5.19 m/s, respectively, while Bagalkote district has lowest wind velocity (0.52, 0.85 and 0.33 m/s during summer, monsoon and winter, respectively).
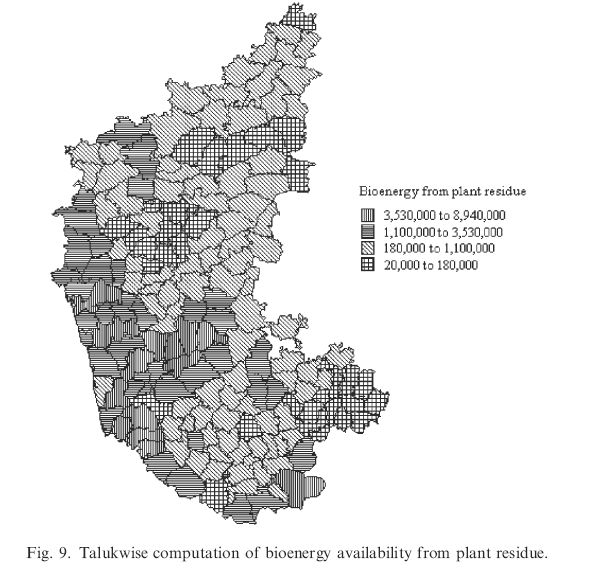
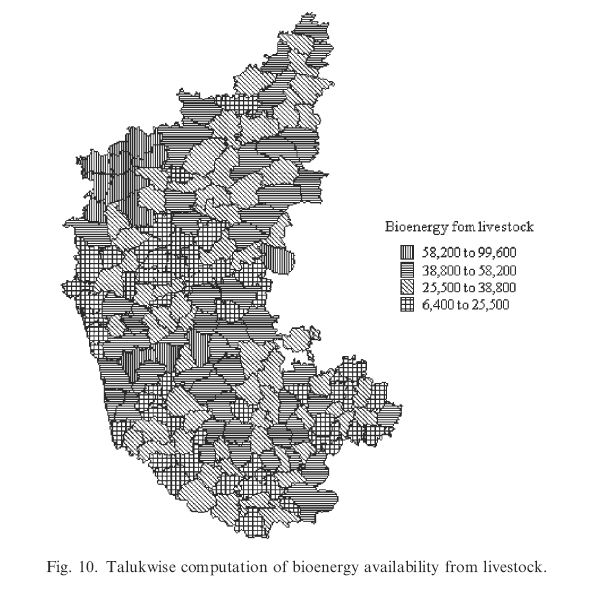
The study reveals that maximum energy derived from bioresource is in Channagiri taluk (8,990,963 Mkcal) Davangere district, where agricultural residue constitutes 1.67% of the total bioresource, 13.65% from forest residue, 83.97% from horticulture residue, 0.04% from plantation and 0.65% from livestock. Anekal taluk in Bangalore Urban district derives minimum energy from bioresource (40,210.28 Mkcal). Agricultural residue constitutes 21.16% of the total bioresource, 8.80% from forest residue, 37.74% from horticulture residue, 3.74% from plantation and 28.54% from livestock. Talukwise computation of bioenergy availability from plant residue (agriculture, forest, horticulture and plantation) is illustrated in Fig. 9. Fig. 10 shows the bioenergy availability from animal residue (livestock). Fig. 11 illustrates the energy derived from total biomass (from plant residue and livestock).
Bioresource potential (from forests, plantations, agriculture, horticulture and animal residues) and demand, talukwise for Karnataka was calculated. The ratio of availability to demand indicates the bioresource status of various taluks in the State. Ratio greater than 1 indicates the presence of surplus bioresource, while a value less than 1 characterises a bioresource-deficient zone. When this ratio is less than 1, bioresources become nonrenewable energy sources as there is scarcity of resources. The computation of bioenergy availability, demand and bioresources status talukwise shows that Siddapur taluk in Uttara Kannada district has the highest bioenergy status of 2.004. Anekal taluk in Bangalore Urban district has the least status of 0.004. Fig. 12 shows talukwise bioresource status of Karnataka.