|
Summary
Concentration of greenhouse gases (GHG) in the atmosphere has been increasing rapidly during the last century due to ever increasing anthropogenic activities resulting in significant increases in the temperature of the Earth causing global warming. Major sources of GHG are transportation (burning fossil fuel), forests (due to human induced land cover changes leading to deforestation), power generation (burning of fossil fuels), agriculture (livestock, farming, rice cultivation and burning of crop residues), water bodies (wetlands), industry and urban activities (building, construction, transport, solid and liquid waste). Aggregation of GHG (CO2 and non-CO2 gases), in terms of Carbon dioxide equivalent (CO2e), indicate the GHG footprint.
GHG footprint is thus a measure of the impact of human activities on the environment in terms of the amount of greenhouse gases produced. The study accounted the amount of three important greenhouses gases namely carbon dioxide (CO2), methane (CH4) and nitrous oxide (N2O) and thereby developing GHG footprint of the major cities in India. This work was published in peer reviewed journal (Ramachandra T.V., Bharath H. Aithal, Sreejith, 2015. GHG footprint of major cities in India, Renewable and Sustainable Energy Reviews 44 (2015) 473–495, http://dx.doi.org/10.1016/j.rser.2014.12.036) and this publication received wide attention of media and organisations in India including couple of questions (during question hour) in the parliament.
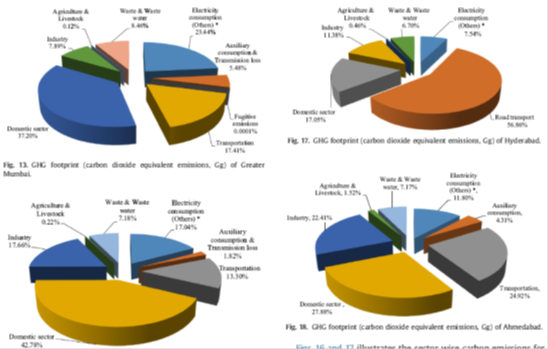
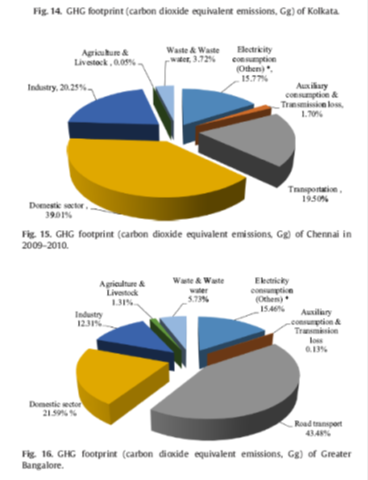
GHG footprint (Aggregation of Carbon dioxide equivalent emissions of GHG’s) of Delhi, Greater Mumbai, Kolkata, Chennai, Greater Bangalore, Hyderabad and Ahmedabad are found to be 38633.2 Gg (or 38.63 million tons), 22783.08 Gg, 14812.10 Gg, 22090.55 Gg, 19796.5 Gg, 13734.59 Gg and 9124.45 Gg CO2 eq respectively. The major contributors sectors are transportation sector (contributing 32%, 17.4%, 13.3%, 19.5%, 43.5%, 56.86% and 25%), domestic sector (contributing 30.26%, 37.2%, 42.78%, 39%, 21.6%, 17.05% and 27.9%) and industrial sector (contributing 7.9%, 7.9%, 17.66%, 20.25%, 12.31%, 11.38% and 22.41%) of the total emissions in Delhi, Greater Mumbai, Kolkata, Chennai, Greater Bangalore, Hyderabad and Ahmedabad respectively.
GHG Emissions in Transportation Sector:
Emissions from the road transport sector are directly related to the quantities of petrol and diesel consumption and the increase in emissions has been due to an increase both in the number of motor vehicles on the road and the distance these vehicles travel. Traffic composition analysis of six mega cities of India (Delhi, Mumbai, Kolkata, Chennai, Bangalore and Hyderabad) shows that there is significant shift from the share of slow moving vehicles to fast moving vehicles and public transport to private transport.
GHG footprint of transportation sector:
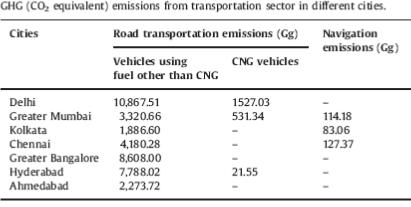
In the major cities transportation sector is one of the major anthropogenic contributors of greenhouse gases. Emissions resulting from total vehicles registered within the city boundary and also from CNG fuelled vehicles present in few of the major cities are calculated. Navigational activities from the port cities are also included in the emissions inventory on the basis of fuel consumption. Delhi leads the emission chart among other cities due to higher emissions because of large number of vehicles. As per the statistics of Transport Department in Delhi, the total number of vehicles in Delhi is more than combined total vehicles in Mumbai, Chennai and Kolkata. Also Delhi has 85 private cars per 1000 population against 8 private cars per 1000 population on all India average. Delhi also has 344868 CNG vehicles during the year 2009-10. In Delhi during the year 2009-10, total number of registered vehicles was 6451883, out of which there were around 20 lakhs of cars and jeeps and 40.5 lakhs of motor cycles including scooters and mopeds. CNG fuelled vehicles emitted 1527.03 Gg of CO2 equivalents whereas the remaining vehicles resulted in 10867.51 Gg of emissions contributing almost 30% of the total emissions in this sub category which is the highest among all the major cities. This is twice the earlier estimate of 5.35 million tons (5350 Gg) of CO2 emissions from road transportation sector in Delhi during the year 2007-08 or emissions of 7660 Gg using top down approach or 8170 Gg using bottom-up approach.The CNG vehicles are also present in two other cities: Greater Mumbai and Hyderabad. Emissions from CNG vehicles in Mumbai during the year 2009-10 are found to be 531.34 Gg of CO2 equivalents and for Hyderabad it is estimated that 21.55 Gg of CO2 equivalent was emitted from CNG vehicles during the study year. The emission inventories for transportation sector in all the major cities are given in Table 1.
Table 1:
|