|
Data Analysis, Results and Discussion
Remote sensing data provides the most useful data on the condition and extent of resources on Earth. This spectral reflectance data in digital form allows the analysis using computers (Digital Image Processing). It involves image restoration (to geometrically correct the images), enhancement (to improve the contrast of images), transformation (such as Principal Component Analysis (PCA) - to reduce the dimensionality of data sets, Normalised Difference Vegetation Index (NDVI) - to carry out land cover analysis) and classification (to derive information related land uses) [14]. Bioresource Assessment using the remote sensing data involves:
- Restoration of satellite images in its correct geometric position.
- Interpretation of satellite images to delineate various geomorphic units and land use classes.
- Field verification of interpreted units.
The process of obtaining useful information from remotely sensed data requires the agglomeration of the data into meaningful groups that can be represented as a map of numerous but relatively homogenous classes. Decision-making and resource monitoring are based on the information provided by these maps. This data can be directly input in GIS to allow spatial analysis of the classified images. Other ancillary data can be used to either improve the training stage of the classification or refine the classification output. The use of a GIS also permits integration of all the information contained in the different ancillary map layers with classifications obtained from satellite imagery, and generation of new levels of information through its overlay capability.
Energy Scenario: Kolar depends mainly on non-commercial forms of energy. Non commercial energy constitutes 84%, met mainly by sources like firewood, agricultural residues and cow dung, while commercial energy share is 16%, met mainly by electricity, oil, etc. The efficiency of conversion of the biomass to useful energy is between 5% and 15%.
Estimation of Bioresources: Forests provide both tangible and non-tangible benefits towards amelioration of soil, protection of environment besides economic benefits through timber, and minor forest produce, fuel and other products. Both conventional (quadrat sampling techniques) and recent method of usage of satellite imagery (remote sensing) is used to assess bio resources available in the region. Secondary data collected from the forest department shows that 7 taluks have forest cover less than 10%, 2 taluks are in the range 10 - 20% (Gudibanda and Srinivasapur) while, the remaining two taluks (Bagepalli and Chikballapur) have forest cover greater than 20%. Woody biomass annual availabilities in taluks of Kolar were computed taking into account woody biomass productivity of 3.6 t/ha/yr (evergreen, semi evergreen), 3.9 t/ha/yr (deciduous) and 0.9 t/ha/yr (Scanty and Scrub vegetation).
Land Cover Analysis – Kolar District: The analysis of vegetation and detection of changes in vegetation pattern are keys to natural resource assessment and monitoring. Healthy green vegetation has different trends in interaction with the energy in visible and near-infrared regions of the electromagnetic spectrum. This strong contrast between the amount of reflected energy in the red and near-infrared regions forms the basis to develop quantitative indices of vegetation condition using remotely sensed data. Various vegetation indices (VI) have been developed for qualitative and quantitative assessment of land cover. The slope-based and the distance-based vegetation indices (VIs) help in land cover analysis depending on the extent of vegetation and soil in a region. In particular, the sensors with spectral bands in the RED and NIR lend themselves well to vegetation monitoring since the difference between the red and near-infrared bands have been shown to be a strong indicator of the amount of photosynthetically active green biomass. NDVI separates green vegetation from its background soil brightness. It is expressed as the difference between the near infrared and red bands normalised by the sum of those bands, i.e.
NDVI = ((NIR – RED) / (NIR + RED)) .....……(1)
This is the most commonly used VI as it retains the ability to minimise topographic effects while producing a linear measurement scale. In addition, divisions by zero errors are significantly reduced. The index normalises the difference between the bands so that the values range between -1 and +1. The negative value represents non-vegetated area while positive value represents vegetated area. NDVI computed for Kolar district is given in Figure 2. In Kolar district, as per NDVI analysis 52.5 % land is under vegetation while 47.5% land is under non-vegetation.
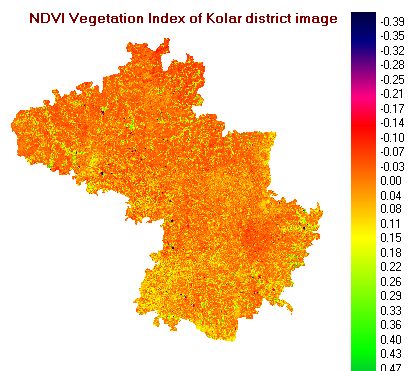
Figure 2: Land cover of Kolar district
Compared to this, the distance based group measures the degree of vegetation present by gauging the difference of any pixel's reflectance from the reflectance of bare soil. The scatter plot of the two bands (Red and NIR) and regression analysis was performed by taking red band as the independent variable and NIR band as the dependent variable which helped in obtaining the slope, intercept and the correlation coefficient (equation 2, 3, 4 and 5).
y = 0.6347x + 34.762 ------------------------------- (2)
R2 = 0.8903 ------------------------------------------ (3)
When the NIR band was treated as the independent variable the following results (equation 4 and 5) were obtained:
y =1.4025x - 33.004 --------------------------------- (4)
R2 = 0.8903 ------------------------------------------ (5)
Computation of Transformed Soil-adjusted Vegetation Index using TSAVI= a(NIR-a*RED-b) / (RED + a*NIR – a*b + 0.08(1+a2)), where b: the slope and a: intercept (from equation 2 above), gave the output comparable to NDVI.
Land Use analysis: The land use map for Kolar district (talukwise) was prepared based on the interpretation of MSS data of IRS-1C satellite. Six major land use categories (i.e.: Built-up, Agriculture, Plantation, Vegetation (forests), Wasteland and Waterbodies) were obtained based on the information, which could be obtained from LISS III MSS imageries of 23.5 m spatial resolution. False Colour Composite (FCC) was generated with the band-2 (green), band-3 (red) and band-4 (near infrared). FCC generated for Kolar district is given in Figure 3. The vector polygons of different land use categories were extracted from the FCC and field visits using GPS were made to collect attribute information corresponding to polygons in the heterogeneous patches of the image. Both supervised and unsupervised classification approaches were tried to identify land use categories. For some of the land use classes adequate sub classes were made to avoid range overlapping (for example, agriculture class was further divided into three classes for different types of crops). A total of eleven classes were finalised and adequate numbers of pixels were chosen for each of the class. The FCC image was used to create one or more vector files of training site polygons i.e. vector outlines of training site areas by the use of the on-screen digitise feature. The training site polygons for Kolar taluk are shown in Figure 4. A total of eleven classes were taken. Classification of remotely sensed data requires the assignment of each of the pixels on an image to a class. The classification approach is based on the assumption that each of the classes on the ground has a class-specific spectral response with each of the classes varying in spectral patterns. There is substantive variation in the distribution of the pixel reflectance values depending upon where the samples are drawn within a land use type. The spectral information contained in the original and transformed bands is then used to characterise each class pattern, and to discriminate between classes. Figure 5 depicts landuse map of the district classified using Gaussian Maximum Likelihood Classifier (GMLC). The level of accuracy in GMLC is 94.67 compared to unsupervised classifier (58.07%). Accuracy estimation in terms of producer's accuracy, user's accuracy, overall accuracy and k Kappa coefficient were subsequently made after generating confusion matrix. The producer's accuracy, user's accuracy corresponding to the various categories and overall accuracy results obtained are summarised in Table 1. A KHAT k value (0.931577) obtained from supervised classification matrix indicated that an observed classification is 93 percent better than one resulting from a chance.
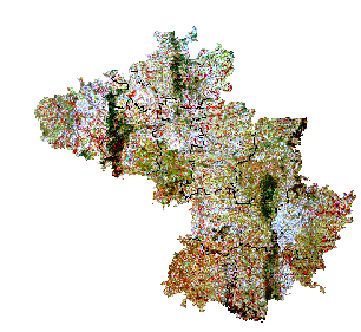
Figure 3: False Colour Composite (FCC) of Kolar district
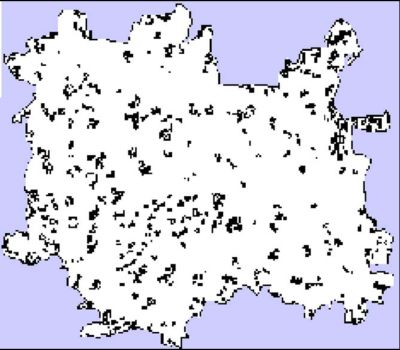
Figure 4: Training polygons of Kolar taluk
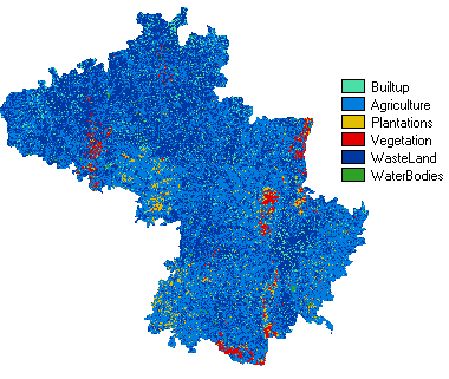
Figure 5: Land use in Kolar district
Table 1: Producer’s accuracy, user’s accuracy and overall accuracy.
| Supervised Classification |
Unsupervised Classification |
| Category |
Producer’s
Accuracy (%) |
User’s accuracy (%) |
Overall accuracy (%) |
Producer’s accuracy (%) |
User’s accuracy (%) |
Overall accuracy (%) |
| Agriculture |
95.45 |
97.67 |
94.67 |
80.49 |
97.06 |
78.07 |
| Builtup |
94.11 |
100.00 |
68.00 |
80.95 |
| Forest |
90.90 |
86.96 |
88.37 |
74.51 |
| Plantation |
91.89 |
94.44 |
65.16 |
100.00 |
| Waste land |
100.00 |
93.75 |
85.71 |
56.60 |
With supervised classification one provides a statistical description of the manner in which expected land use classes should appear in the imagery, and then the likelihood that each pixel belongs to one of these classes is to be investigated. Once a statistical characterisation has been achieved for each information class, the image is then classified by MLC with a better accuracy of 94.67% (compared to other supervised classification approaches - Minimum Distance to Mean (MD)- 76% and Parallelepiped (PP)- 70%)by examining the reflectance for each pixel and making a decision about which of the signatures it resembles most. Overlaying district layer with taluk boundaries on the classified district image, talukwise land use details were obtained. Landuse analysis for the Kolar district by MLC technique indicates that 46.69% is agricultural land, 42.33% is wasteland (barren land), 4.62% is built up, 3.07% is plantation, 2.77% is natural forest and 0.53% is waterbodies. Recursive soil erosion was reported in Kolar, leading to the loss of productive topsoil, which is evident from the extent of the wasteland (about 42%) in the district. The loss of topsoil degrades arable land and eventually renders it unproductive. The area under vegetation (Agriculture, Plantation and Forests) ranges from 27.91% (Gudibanda), 33.35% (Bagepalli), 36.94% (Gauribidanur), 48.41% (Chintamani), 52.66% (Kolar), 53.56% (Sidlaghatta), 54.51% (Mulbagal), 56.36% (Chikballapur), 65.62% (Srinivasapur), 66.76% (Bangarpet), and Malur (71.71%).
Improved Spatial Resolution: IHS fusion technique was adopted to convert a colour image from the RGB (Red, Green, Blue) space into the IHS (Intensity, Hue, Saturation) colour space. IHS transformation can enhance image features, improve spatial resolution, and integrate disparate data. The Intensity (I) band resembles a PAN image and was replaced by a high-resolution PAN image in the fusion. A reverse IHS transform is then performed on the PAN together with the Hue (H) and Saturation (S) bands, resulting in an IHS fused image. The general IHS procedure uses three bands of a lower spatial resolution dataset and transforms these data to IHS space. A contrast stretch is then applied to the higher spatial resolution image so that the stretched image has approximately the same variance and average as the intensity component image. Then, the stretched, higher resolution image replaces the intensity component before the image is transformed back into the original colour space [36]. The IHS colour coordinate system is based on a hypothetical colour sphere. The vertical axis represents intensity, which ranges from 0 (black) to 255 (white). The circumference of the sphere represents hue, which is the dominant wavelength of colour. Hue ranges from 0 at the midpoint of red tones (through green, blue and black) to 255. Saturation represents the purity of the colour and ranges from 0 as the center of the colour sphere to 255 at the circumference [37]. The IHS values can be derived from the RGB values through transformation equations. The following equations (equation 6, 7, and 8) are used to compute IHS values for a RGB image (BV1, BV2, and BV3). The IHS values can also be converted back into RGB values using the inverse equations [38]
Status of Bioresource: Biomass availability was computed talukwise considering the spatial extent of bioresources and the productivity. The average fuel wood demand was considered as 1.3 kg/person/day based on the household survey of 2500 sample households covering all categories of households in the district. The ratio of availability to the demand (bioresources) gives an idea of its status in a region. This is computed talukwise and it is listed in Table 2. Ratio less than one gives the scarcity of bioresource in that region. The availability to demand ratio ranges from 0.12 (Chintamani) to 0.42 (Chikballapur). The ratio being less than one indicates that there is bioresource scarcity and Kolar district can be categorised as a bioresource deficit district. Bioresource status ratio (resource to demand) showed that more than 95% of the villages have very less value (0-0.2), while very few villages have average value (>0.6).
Table 2: Talukwise bioresource status in Kolar district
| Taluk |
Bioresource status |
| Bagepalli |
0.15 |
| Bangarpet |
0.15 |
| Chikballapur |
0.42 |
| Chintamani |
0.12 |
| Gauribidanur |
0.16 |
| Gudibanda |
0.16 |
| Kolar |
0.33 |
| Malur |
0.21 |
| Mulbagal |
0.18 |
| Sidlagatta |
0.17 |
| Srinivasapur |
0.39 |
Kolar depends mainly on non-commercial forms of energy. Non commercial energy constitutes 84%, met mainly by sources like firewood, agricultural residues and cow dung. Availability of animal residues for biogas generation gives a viable alternative for cooking and lighting fuel and fertiliser. However, fodder from agricultural residues is insufficient to support the present livestock population in this district. Various alternatives such as fuel-efficient stoves, biogas and energy plantations are proposed for improved utilisation of bio resources and to enhance bioresources. Renewables such as solar energy can be used for cooking and lighting. To maintain the environmental balance and to meet the bioresource demand there should be tree plantations in wastelands and some alternative energy source should be found for cooking need.
Mapping of Tree Species: Field surveys in Kolar indicate that rural household depends on species such as Prosopis juliflora, Acacia nilotica, Acacia auriculiformis to meet fuel wood requirement for domestic activities. Hence, to take stock of fuel wood availability, mapping was done considering villages as sampling units and villages were selected randomly. Training data through field surveys for Prosopis juliflora and other fuel wood species in Kolar taluk covering 30 villages (Figure 6) were collected. In order to take stock of fuel wood availability in a village, detailed mapping of trees (pixel level mapping) was carried out wherein all the scattered trees in both cultivated and non-cultivated fields were considered including some of them growing in arduous geographical locations like the steep hill ranges and other such localities (except some small totally inaccessible regions like along rock boulders uphill the Antaragange range reserve forest) were mapped using GPS.. The survey counts and measures all trees with a diameter of 10 cm and above (dbh). The parameter such as tree type, girth at breast height (GBH), height, and soil type along with the position (in three dimensional) was done for each tree. In case of a patch, a quadrat was taken. The quadrat dimension depends on density of trees and the type of patch (homogenous or heterogeneous). Counting the number of trees in the quadrat and extrapolating it to the whole of the patch area, the trees in the whole village were mapped. In case of homogenous plantations covering a large area, 10 m x 10 m quadrat was laid and the total number of trees in it was counted, which was later extrapolated to its spatial extent. Then, this information was converted into digital format using GIS (a vector map of respective village using GIS with attribute database). Vector layers of the villages were generated with individual trees marked on the village layer and the corresponding tree information was recorded in the database. These layers were generated for all surveyed villages (Figure 7.1 and Figure 8.1 for Iragasandra and Huttur villages). These layers were then overlaid onto the fused image of PAN and LISS (Figure 7.2 and Figure 8.2). Spectral response patterns of the dominant species, covering a large aerial extent were determined by linking ground data with the image data. Large plantations and grooves are depicted in polygons and an individual tree is shown with a symbol, and colours were assigned for various species. (Figure 7.1 and Figure 8.1).
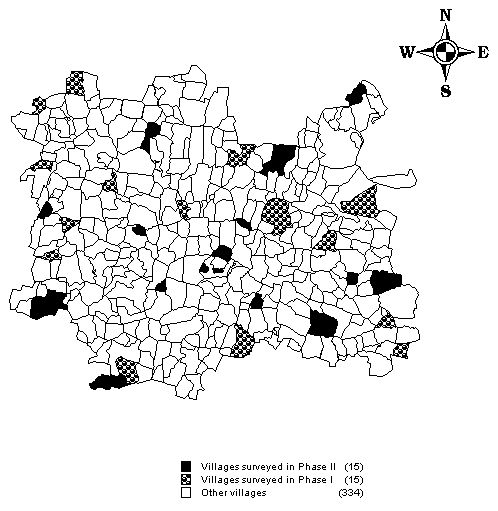
Figure 6: Villages surveyed in Kolar taluk
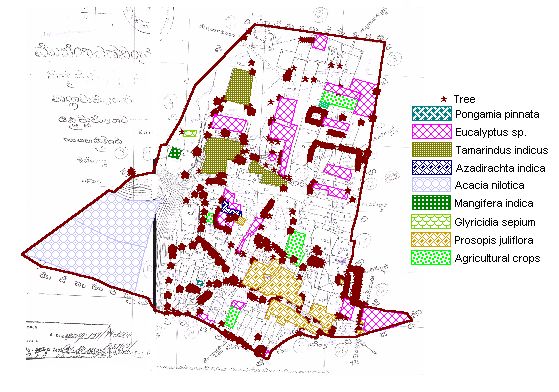
Figure 7.1: Vector layer of fuel wood species in Iragasandra village
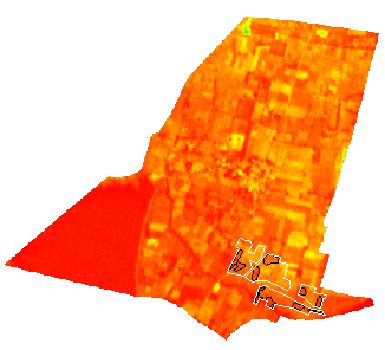
Figure 7.2: Remote sensing data (5.8 m spatial resolution) of Iragasandra village
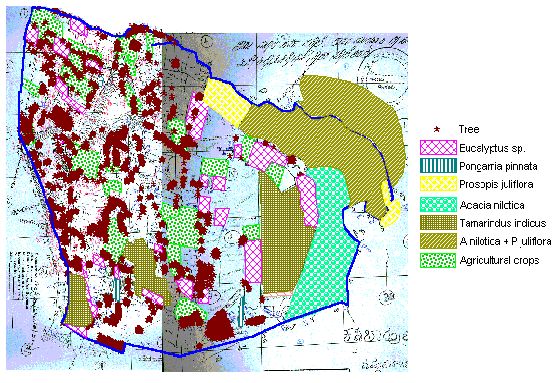
Figure 8.1: Vector layer of fuelwood species in Huttur village
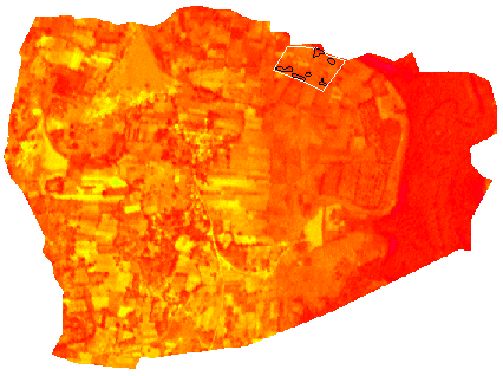
Figure 8.2: Remote sensing data (5.8 m spatial resolution) of Huttur village
Spectral Signature Analysis: The vector layer of a particular species is overlaid to its corresponding remote sensing data to get the respective spectral signatures. Frequency distribution and histogram analyses of spectral values were done and Figure 9 provides the histogram for Prosopis juliflora. Frequency distribution of spectral values helped in delineating the reasons for variations. The range where the highest peak occurs corresponds to a spectral value of adult species. Average value of the selected range was taken as spectral value of that species and its standard deviation gives the range for spectral signature. Spectral value depends on the type of species, its girth, canopy and density. Considering these parameters, training sites for each species was mapped. Then their corresponding spectral signature is found out by overlaying field data with remote sensing data. Table 3 shows the spectral signature ranges for various tree species dominant in the villages of Kolar taluk.
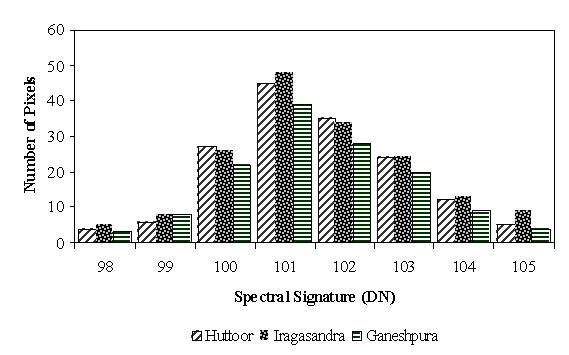
Figure 9: Histogram: Spectral signatures of Prosopis juliflora
Table 3: Spectral ranges of fuel wood tree species (in the remote sensing data)(based on December 2006, MSS data fused with PAN)
| Village |
Species |
| Eucalyptus |
Prosopis Juliflora |
Mangifera indica |
Pongamia
Pinnate |
Acacia nilotica |
Acacia auriculiformis |
Tamarindus indica |
| Huttoor |
83 - 92 |
98 –105 |
|
106-108 |
76 - 80 |
|
93 –96 |
| Ganeshpura |
85 - 96 |
98-104 |
107-110 |
103 – 107 |
|
|
94 –96 |
| Ramasandra |
86 – 92 |
|
106– 108 |
|
78-82 |
|
|
| Kondasandra |
|
|
107-109 |
|
|
90 - 100 |
93 –97 |
| Kaparasiddanahalli |
88– 94 |
|
|
|
|
92 - 96 |
|
| Nandikamanahalli |
84 – 93 |
|
106-110 |
104-106 |
|
89-96 |
|
| Iragasandra |
87 – 96 |
99-104 |
109– 111 |
103-108 |
|
89-95 |
88 - 95 |
| Antaragange |
83 – 95 |
|
|
|
|
|
|
| Sangondahalli |
84 – 88 |
|
|
|
|
|
|
Mapping of Prosopis juliflora: Mapping of Prosopis juliflora-using GPS was done in Iraghasandra and Huthur villages of Kolar taluk. The study was done in two phases. In first phase, all the areas with Prosopis juliflora-were identified and marked as quadrats. Then the imageries of the particular quadrats were studied to get the spectral signatures and spectral response pattern. In the second phase, sub quadrat was taken within the quadrat with thick patches (density of trees, age of the plantation – juvenile and adult, etc.). With the results of second phase the spectral pattern was still narrowed down based on the density (spatial spread of trees in a quadrat) and age of the trees.
The knowledge of spectral response pattern of select species (considering density and age), helped in mapping those select species for the entire Kolar taluk as well as for the neighbouring Gauribidanur taluk with the help of PAN and LISS III fused data in Kolar district. Figure 10 depicts fused image. The map of Prosopis juliflora was verified using GPS. Polygons chosen for verification are given in Figure 11. The spectral pattern of Prosopis juliflora (adult plantation) is in the range of 100-102 (whereas Juvenile ones are in the range 98-99 while trees which are sparsely spread constitute the range 103-105) and the field verification indicated the mapping accuracy of 88% and errors due to omission and commission contributed to 12% (Fig. 12).
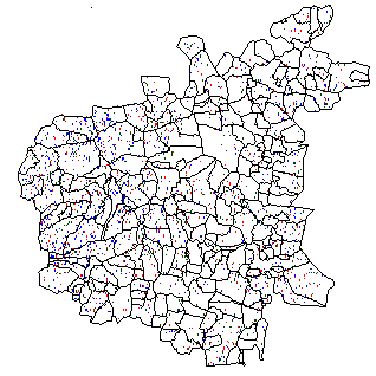
Figure 10: Mapped Prosopis juliflora trees in Gauribidanur taluk (based on the training data collected from neighbouring Kolar taluk)
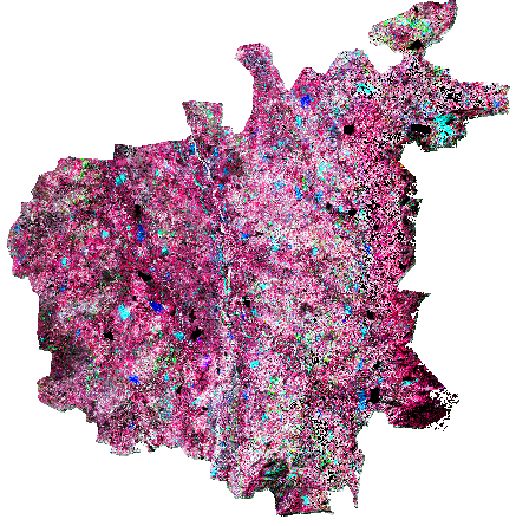
Figure 11: Fused remote sensing data of Gauribidanur taluk
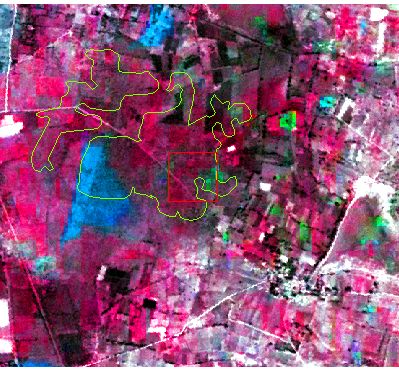
Figure 12: Verification sites of Prosopis juliflora patches in Gauribidanur taluk
|


 Abstract