|
Methodology
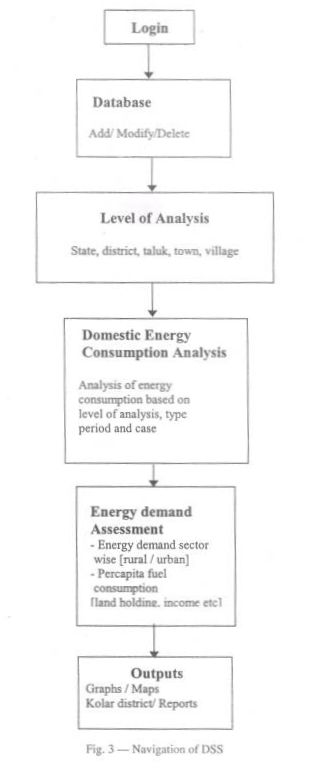
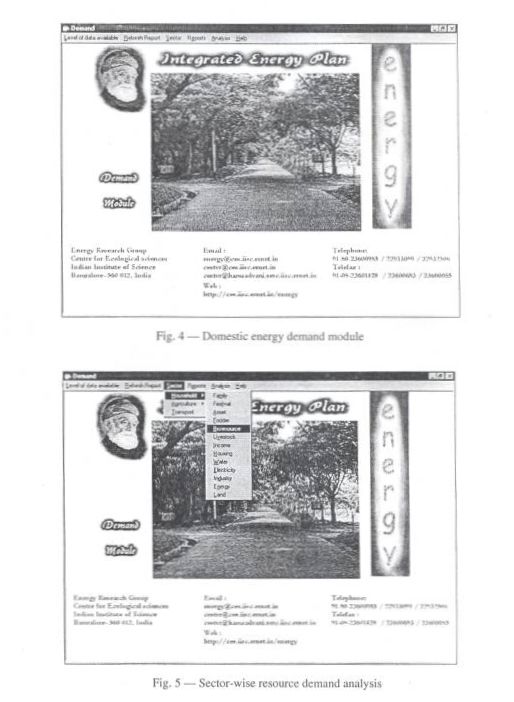
DSS of domestic energy demand assessment (Fig. 1) is developed with a GUI, using Microsoft Visual Basic 6.0 (VB 6.0) as front-end and Microsoft Access database as backend. GUI environment helps in entry, update of database along with options to compute domestic energy consumption at selected locations. Integration of this module in GRAM++ (GIS software) helps in spatial and temporal analyses12.
Case Study and Implementation of DSS
Sector-wise disaggregated information of energy usage is developed for the district to assist in regional energy planning exercise. This case study provides comparative analyses of village level domestic energy consumption pattern considering regional and seasonal variations. Cooking, water heating, and space heating are the major end use activities. Results based on 18 months of field research in all taluks of Kolar district reveal that the average energy consumption norm does vary significantly for cooking and water heating in various seasons across the district.
Study Area
Kolar district is located in the southern plains of Karnataka State, India (Fig. 2). It lies between 77° 21' to 78° 35' east longitude and 12° 46' to 13° 58' north latitude and extends over an area of 8,225 sq. km. The population was 2.52 million in 2001. For administrative purposes, district has been divided into 11 taluks. There are 15 towns and 3,345 inhabited villages in district Kolar belonging to semi-arid zone of Kamataka. In the semi arid zone apart from the year-to-year fluctuations in the total seasonal rainfall, there are also large variations in the time of commencement of rainfall adequate for sowing as well as in the distribution of drought periods within the crop-growing season. Kolar district depends on rainfall during southwest and northeast monsoon. Out of about 2,80,000 ha of land under cultivation, 35 per cent is under well and tank irrigations. There are about 951 big tanks and 2934 small tanks in the district.
Average population density of the district is 2.09 personslha (rural) and 2.69 personslha (rural + urban). The population density ranges from 1.44 (Bagepalli), 1.69 (Gudibanda), 1.70 (Srinivasapur) to the maximum of 2.55 (Kolar). While population density in taluks lies within this range - Bangarpet (2.52), Malur (2.38), Gauribidanur (2.36), Sidlaghatta (2.16), Chintamani (2.10), Mulbagal (2.04), Chikballapur (1.92).
Average livestock density of the district is 0.81. It ranges from 0.68 (Bagepalli, Malur), 0.70 (Kolar) to a maximum of 1.09 (Gauribidanur). Extent of forest cover in the district is about 6.5 per cent (Bangarpet, 1.71; Malur, 2.3; Kolar, 2.78; Srinivasapur, 15; and Chikballapur, 20 %). Taluks are grouped into three groups (<10 %, 10-20 %, and >20 %) based on percentage of forest cover. Chikballapur and Bagepalli have forest cover > 20 per cent, Gudibanda and Srinivasapur are in the range 10 - 20 per cent, while remaining taluks have forest cover < 10 per cent.
In order to get an insight into the energy consumption pattern and extent of variation in the domestic sector, detailed energy surveys were conducted in the district, consisting mainly of secondary and primary data collection. An exploratory survey was conducted in various taluks initially. Stratified random surveys of fuel consumption were conducted in 2500 households from 137 villages uniformly distributed over all taluks of Kolar district to assess the energy situation in the district. Data collected from these houses were computerized and verified (survey was repeated in households to ensure the data consistency). Removal of ambiguous and inconsistent data is about 17 per cent and the final analyses were carried out for the consistent data of 2080 households (83 %). Per capita fuel consumption is computed season-wise and region-wise to determine the fuel consumption pattern and its variability considering the seasonal and geographical factors.
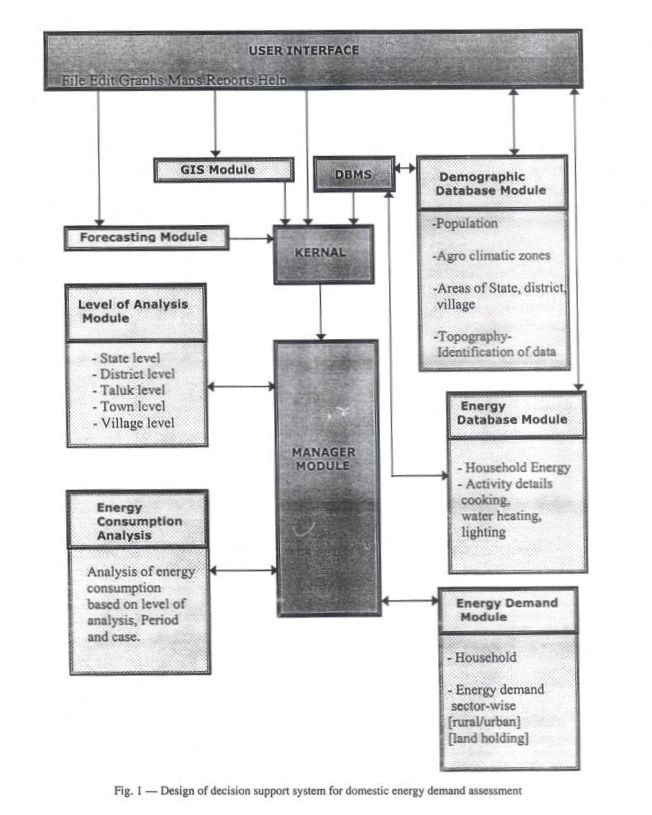
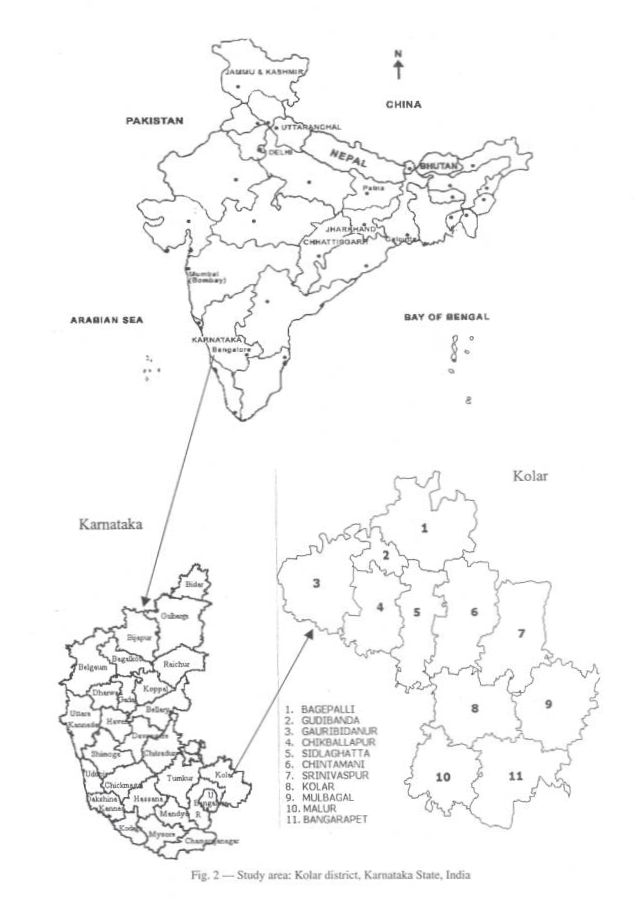
Table –1 Standard adult equivalents used in analysis
| Family size y |
Standard adult equivalent |
| Men 18-59 |
1.00 |
| Women 18-59 |
0.80 |
| Men > 59 |
0.80 |
| Women > 59 |
0.80 |
| Boys 5-18 |
0.80 |
| Girls 5-18 |
0.50 |
| Kids 1-5 |
0.35 |
| Child < 1 |
0.25 |
Data Analysis
Per capita fuel consumption (PCFC) is computed to determine the fuel consumption pattern in various zones and to identify various parameters involved in the variation and level of fuel consumption for cooking and water heating. PCFC is given by,
PCFC = FC/p
where FC = fuel consumed in kg/d and p = number of adult equivalents, for whom food was cooked.
Following factors were considered for the computation of PCFC:
- More than one type of fuel is used for cooking and water heating in any household. The quantity of fuel consumed is determined by subtracting the weight of the remaining fuel from its initial weight. The daily consumption of different fuels is calculated separately from the fuel weights of the consecutive days.
- These daily consumption values in each household are converted to their equivalent dry weights, using the measured moisture content values, which are then converted into equivalent value using the net calorific value of each type of residue. These are added to get the daily energy consumption for each household.
- Daily energy consumption of each household is further converted to per adult energy consumption, using adult equivalent of the number of people, computed assuming the conversion factors (standard adult equivalents) as given in Table 1.
- For each family, daily per adult energy consumption is computed season-wise. The average value, standard deviation and maximum and minimum values are computed for annual and seasonal consumption.
- The data is grouped, based on household income, landholding category, community and village separately. All the above parameters were computed for these groups5.
Similarly, depending on the activities (cooking, water heating, lighting, etc.), the per-capita consumption per day is computed for electricity, kerosene, and LPG for 2500 households in Kolar district.
Biogas Usage
Biogas can be used for many purposes, mainly cooking and lighting in rural areas. It can be burned with a gas mantle or be converted to electricity, using dual mode engine. The per capita requirement of gas for domestic purposes such as, cooking and water heating, is in the range 0.34-0.43 m 3 /d (efficiency of standard burner is about 60 %). The gas requirement to generate one unit of electricity (kWh) is about 0.54 m3. The calorific value of gas is about 4713 kcal/m3. Biogas potential assessment in Kolar district reveals that biogas can meet the cooking requirement of at least 20 per cent of the total district population.
|