Systematically managed database is highly useful in assessing the yield of any reservoir. But in the present case, such a database is not available with the Fisheries Department.
Table 4: Comparison of catchment area and water spread area.
Name of the Reservoir |
Catchment area (sq. km) |
Water spread area (sq. km) |
Catchment area Water spread area |
Linganamakki |
1991.71 |
322.56 |
6.174696 |
Tungabhadra |
28168 |
378.14 |
74.49093 |
Krishnarajasagara |
10619 |
129.24 |
82.16496 |
Markonahalli |
4103 |
13.36 |
307.1108 |
Hemavathy |
2810 |
75.17 |
37.38193 |
Supa |
1067 |
123.00 |
8.674797 |
Source:
- Statistical bulletin of Fisheries1998-99
- http://www.fao.org/DOCREP/003/VR930E/V5930EO6.htm
The unorganised market channels further complicated the data collection from the fish landing Centres. Thus, in the absence of any historical information from any sources regarding the fish yield of the reservoir, yield estimation could be crude. However, an attempt has been made here based on the present field data.
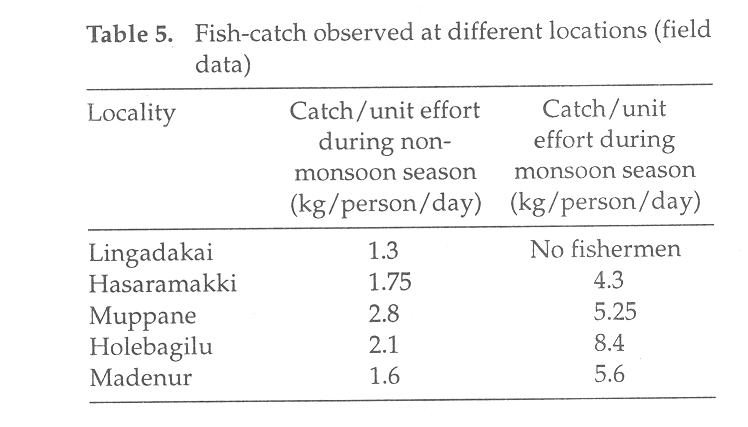
Five sampled localities were selected to assess the yield of the reservoir. Lingadakai, Hasaramakki, Muppane, Holebagilu, and Madenur are the spots where sampling was carried out along with active fishermen. Information was collected as in natural conditions without disturbing the fishermen at any stage. This could probably represent the actual field condition and fishing patterns of the fishermen. Multiple sampling in the same locality further helped in averaging the yield which is listed in Tables 5 and 6 respectively.

This data represents fishing using gill nets and hooks as a majority of the fish catch is carried out through them. Ideal fishermen were selected for the sample data with the consideration of standard effort and time. In the design, 10% of extra fishermen were considered for the monsoon season. During the field visits it was observed that especially the migratory fishermen were in groups of 10 or more, in which few of the fishermen had fishing licenses. Remaining fishermen had no valid fishing license. To supplement this kind of illegal fishing 10% extra has been considered. After the monsoon season, most of these migratory fishermen move to some other reservoirs. Thus, unauthorised fishing reduces during non-monsoon seasons.
The merchants pay on an average of Rs. 22 per kg of fish. As per the estimate yield. of the reservoir, the annual revenue obtained by the fishermen on spot becomes Rs. 43,84,990. Individually the permanent fishermen earn annually Rs. 22042/-.
The reservoir fish yield is estimated to be 610.76 kg/ sq. km at full reservoir level. Even though the monsoon period is shorter than the non-monsoon period, about 68.23% of the total fish-catch takes place during monsoon. During monsoon period the increase in fish catch can be attributed to the tapping of the breeding season. Usually, fishermen shift to shallow areas as the water level rises during the monsoon season. This indicates that they are tapping the breeding grounds of most of the fishes. The fishermen have attributed the increase in introduced fish catch to reduction in turbidity during monsoon season.