Articles
Conservation of Wetlands: Ecosystem-based Adaptation of Climate change Environment Education at all levels to enhance environmental literacy for environmentally sound development Spatial Decision Support System for managing fish resources in Bangalore Microalgal SDSS for sustainable management of lakes Conservation and Sustainable Management of Sambhar Lake, a Ramsar Site of International Importance Decentralized Solar power generation: Challenges and opportunities ReferencesConservation of Wetlands: Ecosystem-based Adaptation of Climate change
Ramachandra T.V. 1,2,3,*,
Asulabha K.S. 1 and
Sincy V. 1
1 - Energy & Wetlands Research Group
[CES TE15], Centre for Ecological
Sciences,
2 - Centre for Sustainable Technologies
(astra)
3 - Centre for infrastructure,
Sustainable Transportation and Urban
Planning (CiSTUP)
Indian Institute of Science, Bangalore
– 560 012, India.
Tel:91-80-
22933099/22933503 (extn 107, 114),
Fax:
91-80-23601428/23600085/23600683[CES-TVR]
*Communication
E Mail:
tvr@iisc.ac.in;
energy.ces@iisc.ac.in
Abstract
Wetlands constitute the most productive ecosystems with a wide array of goods and services. These ecosystems serve as life support systems; serve as habitats for a variety of organisms including migratory birds for food and shelter. They aid in bioremediation and are hence aptly known as ‘kidneys of the landscape’. Major services include flood control, wastewater treatment, arresting sediment load, drinking water, protein production, and more importantly recharging of aquifers apart from aiding as sinks and climate stabilizers. The wetlands provide a low-cost way to treat the community’s wastewater, while simultaneously functioning as a wild fauna sanctuary, with public access. These ecosystems are valuable for education and scientific endeavours due to their rich biodiversity. However, post-industrialization and globalization era witnessed a spurt in unplanned developmental activities with senseless urbanisation leading to the degradation and decline of fragile ecosystems. This necessitates the conservation of vital ecosystems through sustainable management tenets, which requires an understanding of the livelihood support of ecosystems. Hence, there is a pressing need to carry out the valuation of the ecosystem services, especially intangible benefits, provided by ecosystems. The value of all ecosystem services, including the degradation costs, and implications of climate change needs to be understood for developing appropriate policies toward the conservation and sustainable use and management of ecosystems. Regional and national accounts need to include measures of resource depletion or their degradation in a measure of the current economic well-being of a population. The existing GDP growth percentages used as yardsticks to measure the development and well-being of citizens in decision-making processes are substantially misleading, as it is based on the market exchange of material well-being, will indicate resource depletion/degradation only through a positive gain in the economy and will not represent the decline in these assets (wealth) at all. Appraisal of ecosystem services (ES) allows for adjusted regional or national accounts which reflect the output of ecosystem services as well as the depletion of natural resources and the degradation costs (externalized costs of the loss of ecosystem services) of ecosystems in economic terms, which will help raise awareness and provide a quantitative tool to evaluate the sustainability of policies toward prudent management and conservation of fragile livelihood supporting ecosystems. The monetary valuation of ecosystem services can help in building a better understanding of their influence on well-being and can further facilitate information-driven decisions and policy reforms that align with the Sustainable Development Goals (SDGs) through the wise use of natural resources. Prudent management of vital ecosystems aid in mitigating the threat of global warming as healthy ecosystems aid in mitigating changes in climate.
Keywords: Wetlands, climate change, adaptation, ecosystem services
Introduction
Wetlands constitute vital components of the regional hydrological cycle. They are highly productive, support exceptionally large biological diversity, and provide a wide range of ecosystem services such as food, fibre, waste assimilation, water purification, flood mitigation, erosion control, groundwater recharge, microclimate regulation, enhance the aesthetics of the landscape, and support many significant recreational, social and cultural activities, aside from being a part of our cultural heritage. It was acknowledged that most urban wetlands are seriously threatened by conversion to non-wetland purposes, encroachment of drainage through landfilling, pollution (discharge of domestic and industrial effluents, carbon sequestration, disposal of solid wastes), hydrological alterations (water withdrawal and inflow changes), and over-exploitation of their natural resources. This results in the loss of biodiversity and disruption of goods and services provided by wetlands. Major implications of unplanned developmental activities are
-
Loss of wetlands and green
spaces:
Urbanisation has telling influences
on the natural resources such as
decline in green spaces (vegetation)
including wetlands and / or
depleting groundwater table in the
rapidly urbanising landscapes such
as Bangalore. The region had green
cover of 68.2% (in 1973) which has
declined to < 3% (in 2021) with
an increase in urban area (paved
surface) of 1080% with a decline of
green cover of 88% and a 79% decline
in wetlands (Figure 1).
Quantification of a number of trees
in the region using high spatial
resolution remote sensing data with
field census reveals 1.5 million
trees and human population is 9.5
million, indicating one tree for
seven persons in the city.

Figure 1: Spatial pattern of landscape dynamics in Bangalore during 1973 to 2021
-
Floods:
Conversion of wetlands to
residential layouts has compounded
the problem by removing the
interconnectivity in undulating
terrain. Encroachment of natural
drains, alteration of topography
involving the construction of
high-rise buildings, removal of
vegetative cover, and reclamation of
wetlands are the prime reasons for
frequent flooding even during normal
rainfall post-2000. Unplanned
urbanisation has drastically altered
the drainage characteristics of
natural catchments, or drainage
areas, by increasing the volume and
rate of surface runoff. Drainage
systems are unable to cope with the
increased volume of water, and are
often blocked due to indiscriminate
disposal of solid wastes.
Encroachment of wetlands,
floodplains, etc. obstructs
floodways causing loss of natural
flood storage.
Frequent flooding in the city is a consequence of the drastic increase in impervious area and loss of wetlands (and interconnectivity of wetlands) with the high-density urban developments. The uncoordinated pattern of urban growth is attributed to a lack of good governance and decentralized administration, which was evident from the lack of coordination among many Para-state agencies, which has led to unsustainable use of the land and other resources. The mitigation of frequent floods and the associated loss of human life and properties entail the restoration of interconnectivity among wetlands, restoration of wetlands (removal of encroachments), conservation, and sustainable management of wetlands.
-
Decline in groundwater table:
Studies reveal the removal of
wetlands has led to the decline in
the water table. The water table has
declined to 300 m from 28 m over a
period of 20 years after the
reclamation of the lake with its
catchment for commercial activities.
In addition, the groundwater table
in the intensely urbanized area such
as Whitefield, etc. has now dropped
to 400 to 500m.
-
Heat island:
Surface and atmospheric temperatures
are increased by anthropogenic heat
discharge due to energy consumption,
increased land surface coverage by
artificial materials having high
heat capacities and conductivities,
and the associated decreases in
vegetation and water pervious
surfaces, which reduce surface
temperature through
evapotranspiration.
- Increased carbon footprint : Due to the adoption of inappropriate building architecture, the consumption of electricity has increased in certain corporation wards drastically. The building design conducive to tropical climate would have reduced the dependence on electricity. Higher energy consumption, enhanced pollution levels due to the increase of private vehicles, traffic bottlenecks have contributed to carbon emissions significantly. Apart from these, mismanagement of solid and liquid wastes has aggravated the situation.
Lakes or Wetlands provide vital ecosystem services and processes, such as the provision of food (fish, fodder, etc.), groundwater recharge, water purification, remediation, nutrient assimilation, carbon sequestration, moderating micro-climate, habitat for flora and fauna, flood reduction, erosion control, opportunities for education, aesthetics, and recreation (de Groot et al. 2020; Ramachandra et al. 2011, 2019, 2021; Barbier 2013; Costanza et al. 1997). Wetlands help to conserve biodiversity by providing habitat for fish, planktons, aquatic plants, insects, and crustaceans, as well as feeding and resting areas for water birds (Ramachandra et al. 2016). Food chains/food webs describe the structure of communities inhabiting a particular ecosystem, and the associated energy as well as nutrient flows, and the interactions between species (Ramachandra et al. 2005; 2006; 2016). Wetlands aid in removing nutrients like nitrate, phosphate, etc., from water (Ramachandra et al. 2021; Ramachandra et al. 2020a).
The function of the wetland ecosystem is illustrated in figure 1, which includes food production, habitat provision, information provision, and regulation of ecosystem processes. Microalgae are primary producers that sequester carbon and synthesize food and energy for higher trophic levels (Kulkarni and Ramachandra 2006; Peel et al. 2019). Enhanced oxygen levels on early Earth, triggering aerobic respiration and the evolution of complex multicellular life forms are due to photosynthesis by microalgae (cyanobacteria) and the release of oxygen (Sánchez-Baracaldo and Cardona 2020). Wetlands provide food and shelter for diverse aquatic organisms (zooplankton, fish, and birds), fodder (livestock and other grazers), medicine, water purification/treatment (remediation), and carbon sequestration (Ramachandra et al. 2020b; Ramachandra et al. 2014). Fish store nutrients in their tissues, translocate nutrients, and excrete dietary nutrients in dissolved forms that are readily available to primary producers (Vanni 2002). Fish feeding alters the community structure of phytoplankton, zooplankton, and insects (Griffiths 2006).

Figure 2 :
Wetland ecosystem function and service
valuation
Wetlands provide numerous ecosystem services, sustaining the livelihoods of dependent populations with the provisioning, regulating, and cultural services, and hence there is a need to quantify the socio-cultural, ecological, and economic value of wetlands (TEEB 2010) for appropriate management strategies by policymakers, and other stakeholders (figure 2) with incentives, and financial support for conservation. Prudent management with the sustainable use of wetlands would aid in maintaining biodiversity, mitigating pollution, and changes in the climate.
Ecosystem service from wetlands
Ecosystem services categorized as provisioning services, regulating services, and cultural services are the benefits derived from nature for human well-being (figure 3). Freshwater lakes provide various services supporting the livelihoods of dependent communities, which include the provision of fish (food), fodder (livestock), water (drinking and irrigation), navigation, recreation, and socio-economic development (Najar and Khan 2012), generation of hydropower, etc. (Anshumali and Ramanathan 2007). Recreation services of wetlands are evident as tourism is a major source of income, and employment in Rudrasagar lake (Burman et al. 2007). The wetland ecosystem supply values range from 7670 (Andhra Pradesh), 7689.4 (Gujarat) to 7896.5 (Karnataka) million US$yr−1 (Pandey et al. 2004).

Figure 3 :
Ecosystem services from wetlands
The total ecosystem supply value (TESV) is the sum of provisioning, regulating, and cultural services. The value of an asset is determined by estimating the net present value (NPV) based on the stream of income expected to be earned in the future and then discounting the future income back to the present accounting period (SEEA 2021). Valuation of wetland ecosystem services would aid in formulating strategies for wetland conservation to adapt and mitigate changes in the climate, protect biodiversity, and sustainable use of wetland resources. The main objectives of this study were to assess total ecosystem supply value (TESV) and assess the net present value (NPV) of wetlands in Karnataka, India.
Materials and Methods
Study Area : Karnataka State is endowed with a vast inland water spread that includes lakes, tanks, reservoirs, rivers, and ponds. Figure 4 depicts the spatial distribution of wetlands in Karnataka. The state is located at 11°30’N and 18°30’N latitudes, 74°E and 78°30’E longitudes, and is the eighth largest state by area and the ninth largest state by population in India. Karnataka state is surrounded by the Arabian Sea to the west, Goa to the northwest, Maharashtra to the north, Telangana to the northeast, Andhra Pradesh to the east, Tamil Nadu to the southeast, and Kerala to the southwest. The state is divided into 30 districts, with Bengaluru as the capital city. Karnataka has a total land area of 191,967 km2 (or 5.83 per cent of India's total land area). Rainfall ranges from 500 mm to over 4000 mm. Agumbe in the Sahyadri region receives the second heaviest annual rainfall (7000 mm) in India. Summer temperatures range from 18°C – 40°C, while winter temperatures range from 14°C – 32°C. Ragi, jowar, rice, wheat, sugarcane, coconut, groundnut, and cotton are the major crops grown in Karnataka.

Figure 4 :
Wetlands of Karnataka, India
The total ecosystem supply value of wetlands in Karnataka was assessed considering (a) provisioning services, (b) regulating services, and (c) cultural services. Ecosystem services are accounted through the (i) residual value method, and (ii) benefit transfer method. Provisioning services of ecosystems are accounted for through the residual value (or resource rent) method. The residual value method has been used to estimate the value of an ecosystem service by taking the gross value of the final marketed good (to which the ecosystem service provides input) and then deducting the cost of all non-ecosystem inputs, including labour, produced assets, and intermediate inputs (SEEA 2021). Benefit transfer involves transferring monetary values of ecosystem services from previous studies or literature that focused on a different region or time period to our area of interest (Ramachandra et al. 2019). Regulating and cultural service values are based on case studies from India, which are compared with the global ecosystem service valuation database (ESVD) [https://www.es-partnership.org/wp-content/uploads/2020/08/ESVD_Global-Update-FINAL-Report-June-2020.pdf] and published literature (of case studies from India) considering GDP (PPP) per capita for India (https://data.worldbank.org/indicator/ NY.GDP.PCAP.PP.CD? locations=IN) and the currency exchange rate (https://www.xe.com/currencyconverter/convert/?Amount=1&From=USD&To =INR).
The provisioning services considered are microalgae, fish, and macrophytes. Microalgae have a relatively shorter cycling period (5–7 days), and the microalgal productivity is 51.1 t/ha/yr. Microalgal biodiesel production will be economically viable with the economic valorization of residual biomass and extraction of value-added products such as glycerol, colloids, etc. (Branco-Vieira et al. 2020; Yang et al. 2012). The total benefit (in Rs/ha/yr) from microalgae was computed by considering biodiesel, glycerol, food/protein, and feed for fish. Microalgae, being producers in the aquatic food chain, sequesters efficiently to the extent of 1.83 kg of carbon dioxide by a kilogram of algae (Chisti 2008). The carbon sequestration service is accounted for by considering the social cost of 80 USD per tonne of carbon dioxide removal (Verma et al. 2014) and molecular weight ratio (1 tC equals 3.67 tCO2). The total value of carbon sequestration is Rs 234404 tCO2/ha/yr.
Macrophytes covered 50432.35 ha, which is ~18% of the Karnataka wetland area. Benefit from macrophytes was computed by considering services such as fodder, honey production, food, grazing, and handicrafts. The total value for carbon sequestration by macrophyte is Rs. 311.92 kgCO2/ha/yr.
Fish is a rich source of easily digestible protein, polyunsaturated fatty acids, vitamins, and minerals for human nutrition (Elaigwu et al. 2019). The average fish catch based on field investigations is 495 kg/ha/yr and benefit (residual value) from fish (as food) is 65 Rs/kg. The data on irrigation (figure 5b) and agricultural crops grown in each district of Karnataka was obtained from government reports (District at a Glance).
The provisioning services of wetlands are calculated by equation (1). The regulating service ( RS ) is calculated by equation (2), and the cultural service ( CS ) is calculated by equation (3). The total ecosystem supply value ( TESV ) is calculated using equation (4), which is the sum of provisioning, regulating, and cultural services. The equation (5) is used to calculate the NPV (net present value) of a wetland ecosystem (SEEA 2014, 2021), considering a social discount rate of 3% and the life of an ecosystem asset of 50 years.
…………………… (1)
Where, PSn is the total provisioning service district wise. n is Karnataka's 1–30 districts, i is the various provisioning services ( i = 1 to 10 services), An is the wetland area of each district, but the area is different for the macrophyte (considered macrophyte cover area), irrigation (considered tank irrigated area), and fuelwood service (considered annual fuelwood extraction from 10% of the macrophyte area).
…………………… (2)
…………………… (3)
…………………… (4)
…………………… (5)
where, NPV = net present value; R = net cash flow from an ecosystem in year t ; T = discount period (50 year); and r = discount rate (3%). District-wise spatial extent of macrophyte is assessed using remote sensing data (Google Earth) and QGIS open-source GIS for mapping various wetland ecosystem services.
Results and Discussion
Microalgae biomass composed of carbohydrates, lipids, and proteins has been widely used in industries to produce fuel (biodiesel, bioethanol, methane, biobutanol, and biogas), feed (spirulina, and chlorella powder), biofertilizers, and medicines (pharmaceuticals and nutraceuticals). Select microalgal species are rich in proteins and produce proteins of 2.5 to 7.5 tons/ha/yr (Khan et al. 2018al 2018b). The provisioning services provided by microalgae from wetlands accounts to 110467 Rs/ha/yr.
Fisheries sector provides livelihoods, income, and economically nutritious food to the society (Sincy et al. 2018, 2022). Fish compose protein, essential fatty acids, and micronutrients (Fe, Zn, Ca, and vitamin A) and form an important component of the human diet and serve as medicine apart from supporting livelihoods of fishing communities. Major carps such as Labeo rohita , Catla catla , Cirrhinus mrigala , and the exotic carps Cyprinus carpio , Ctenopharyngodon idella , and Hypothalmichthys molitrix with high economic value constitute a vital component of local economy in India (Dasgupta and Panigrahi 2014). Eco-tourism integrates both socio-economic and cultural activities involving fishing activities has been providing recreation and education services that is aiding in the decentralized development (Tursi et al. 2015) based on fish resources. The provisioning service provided by fish from wetlands in Karnataka accounts to 32175 Rs/ha/yr. Fish supports the livelihoods of fishing communities with regular income and employment. The estimate indicates of US$ 158,368, the revenue from fish products at Sundarbans (Islam and Hossain 2017).
Macrophyte provides food, fodder, medicine, and aid in water purification (remediation), carbon sequestration, while providing recreation opportunities (Ramachandra et al. 2018). Macrophyte serve as food for other aquatic organisms, fodder for livestock, medicine for treating animal and human diseases, fiber, green manure, industrial raw materials (manufacture of essential oils), pesticides, and ornamental plants (Zhang et al. 2014). Alternanthera sessilis , Eleocharis dulcis , and tubers of Colocasia esculenta are being used as vegetables, while Fimbristylis dichotoma , Cyperus iria , and C. pangorie are used for making mats (Rao et al. 2008). The ecosystem services provided by diverse species of macrophyte amounts to 11291 Rs/ha/yr.
The benefits provided by wetlands of Karnataka can range from tangible products (such as food, fodder, fuelwood, medicine, and water) to intangible products (such as habitat, climate regulation, flood control, erosion control, water and air quality regulation, recreation, and aesthetics). The spatial analyses of wetlands in Karnataka using remote sensing data, highlight that about 61% of wetlands had an area of <2.5 ha, 36% of wetlands had an area of 2.5 – 50 ha, and 3% of wetlands had an area of >50 ha.
The provisioning, regulating, and cultural services provided by wetlands in Karnataka constitute about 18%, 69%, and 13%, respectively, of the total ecosystem supply value. The provisioning, and regulating services provided by wetlands in Karnataka, which amount to 49.70 and 196.89 billion Rs/yr respectively.

Figure 5 : a)
Provisioning service and b) Regulating
service of wetlands of Karnataka
Recreational services of wetlands include swimming, boating, jogging, gardening, amusement parks, and as picnic spots for scenic beauty. The lakes in Karnataka have cultural significance, for example, Lalbagh lake inside the Lalbagh Botanical Gardens supports a variety of flora and fauna and attracts nature lovers, bird watchers, and tourists. Nagavara lake in Bengaluru has the water-front leisure park, Gardens, adjacent to it. The amusement park for children, and musical fountains, are popular among visitors. Thonnur lake in Mysuru is an attractive spot for bird watching, boating, and swimming. Researchers are attracted to Karanji lake in Mysuru as it has the largest walk-through aviary in India and a butterfly park. The Regional Museum of Natural History on the banks of Karanji lake provides information on the natural environment of South India and nature conservation. Pampa Sarovar is a sacred lake in Koppal district, Karnataka. A special pooja is conducted in the Honnamana kere (Honnama lake) in Kodagu during the Gowri festival. People offer bagina (puja items along with flowers and bangles placed in a bamboo basket) to the lake and pray for good rain. In Karnataka, during Ganesh Chaturthi, Ganesh idols are immersed in Kalyani near the lakes. During festivals such as Durga puja, Jagadhatri puja, Lakshmi puja, and Ganesh Chaturthi, visitors perform puja in lakes (Bhattacharya et al. 2014; Bengani et al. 2020).
The cultural services provided by wetlands in Karnataka amount to 37.93 billion Rs/yr and the district-wise share is presented in figure 6. The annual economic value of the cultural service of the Pateira de Fermentelos wetland is estimated at 3087 €/ha/yr (Roebeling et al. 2016). About 90% of people are willing to pay (WTP) for recreation in the Kanibrazan wetland, with an average estimate of 38217 Rials/person (Zarandi et al. 2019). The cultural services of wetlands are evident from the revenue of US$ 144832 from the Sundarbans from tourism with 96949 native and 3868 foreign tourists (Islam and Hossain 2017).

Figure 6 :
Cultural service of wetlands of
Karnataka
The district-wise ecosystem services provided by wetlands, reveal that the Tumakuru district with the larger spatial extent of wetlands, contributes significantly (47,142 million Rs/year) through ecosystem services, followed by Kolar, Chitradurga, Hassan, Chikkaballapura, Mandya, and Shivamogga. The value of provisioning, regulating, and cultural services provided by wetlands in Tumakuru district is 8214, 32641, and 6287 million Rs/yr respectively. Udupi district had the lowest values of 40, 157, and 30 million rupees per year in provisioning, regulating, and cultural services, respectively.
Total ecosystem supply value is the summation of provisioning, regulating, and cultural services. TESV depends on the spatial extent and condition of the ecosystem. The TESV of Karnataka wetlands reveals that Tumakuru district tops among all districts with 47.14 billion Rs/yr of the total 284.52 billion Rs/yr from wetlands in Karnataka (Figure 7).
NPV computed based on the annual flow of TESV shows that the worth of ecosystem assets of wetlands in Karnataka amounts to 7321 billion rupees. NPV ranged between 450 - 650 billion rupees in districts like Chitradurga, Chikkaballapura, Hassan, and Kolar (Figure 7), whereas it ranged between 250 - 450 billion rupees in Davanagere, Haveri, and Shivamogga. Similar studies done across the globe indicate the net present value of revenue (benefits) earned during the last ten years from Sukhna lake in Chandigarh was estimated at Rs. 451 million (Chaudhry et al. 2013). In the case of Koshi Tappu Wildlife Reserve, the total net benefit value from wetland fodder was estimated at USD 4251,919 (Sharma et al. 2015).

Figure 7 : a)
TESV and b) NPV of
wetlands of
Karnataka
Wetlands are fundamental to the economic, social, and cultural wellbeing of the population in India. Table 1 lists provisioning, regulating, cultural services, TESV, and NPV of wetlands in Karnataka. Wetlands cover an area of 281300 hectares in Karnataka and provide provisioning services worth 1.8 lakh Rs/ha/yr, regulating services worth 7 lakh Rs/ha/yr, and cultural services worth 1.3 lakh Rs/ha/yr. The total ecosystem supply value (TESV) of wetlands in Karnataka amounts to 285 billion Rs/yr (10.1 lakh Rs/ha/yr) and the NPV of wetland assets is about 7321 billion rupees (table 1).
Table 1 : Total ecosystem value of Karnataka wetlands
|
Services |
Details |
|
|
|
Wetland: Total area (ha) |
281299.5 |
|
Provisioning Service |
Total Rs/yr (in Billion Rupees) |
49.70 |
|
Production Rs/ha/yr (in Lakhs) |
1.8 |
|
|
% distribution |
18 |
|
|
Regulating Service |
Total Rs/yr (in Billion Rupees) |
196.89 |
|
Production Rs/ha/yr (in Lakhs) |
7 |
|
|
% distribution |
69 |
|
|
Cultural Service |
Total Rs/yr (in Billion Rupees) |
37.93 |
|
Production Rs/ha/yr (in Lakhs) |
1.3 |
|
|
% distribution |
13 |
|
|
TESV |
Total Rs/yr (in Billion Rupees) |
284.52 |
|
Production Rs/ha/yr (in Lakhs) |
10.1 |
|
|
NPV |
NPV in Billion Rupees |
7320.6 |
Conservation and Management of Wetlands: The loss of ecologically sensitive wetlands is due to the uncoordinated pattern of urban growth happening in Bangalore. This is due to a lack of good governance and decentralized administration evident from lack of coordination among many Para-state agencies, which has led to unsustainable use of the land and other resources. Failure to deal with water as a finite resource is leading to the unnecessary destruction of lakes and marshes that provide us with water. This failure in turn is threatening all options for the survival and security of plants, animals, humans, etc. There is an urgent need for:
- Restoring and conserving the actual source of water - the water cycle and the natural ecosystems that support it - are the basis for sustainable water management
- Reducing the environmental degradation that is preventing us from reaching goals of good public health, food security, and better livelihoods world-wide
- Improving the human quality of life that can be achieved in ways while maintaining and enhancing environmental quality
- Reducing greenhouse gases to avoid the dangerous effects of climate change is an integral part of protecting freshwater resources and ecosystems.
A comprehensive approach to water resource management is needed to address the myriad water quality problems that exist today from non-point and point sources as well as from catchment degradation. Watershed-based planning and resource management is a strategy for more effective protection and restoration of aquatic ecosystems and for protection of human health. The watershed approach emphasizes all aspects of water quality, including chemical water quality (e.g., toxins and conventional pollutants), physical water quality (e.g., temperature, flow, and circulation), habitat quality (e.g., stream channel morphology, substrate composition, riparian zone characteristics, catchment land cover), and biological health and biodiversity (e.g., species abundance, diversity, and range).
Conclusion
The valuation of ecosystem services of wetland ecosystems, district-wise for Karnataka State, India is implemented as per the validated protocol - System of Environmental Economic Accounting (SEEA, 2021). Services of the ecosystem were quantified by considering only the contribution of the ecosystem to the benefit, through the residual value method by taking the gross value of the final marketed good to which the ecosystem service provides input and then deducting the cost of all other inputs, including labour, produced assets, and intermediate inputs.
The value of wetland ecosystem services, helps in developing appropriate policies toward the conservation and sustainable management of ecosystems. The value of provisioning, regulating, and cultural services ranged from 4 - 821.4 ten million Rs/yr, 15.7 - 3264.1 ten million Rs/yr, and 3 - 628.7 ten million Rs/yr respectively. Among the districts, the Tumakuru district contributes significantly with TESV of 47.14 billion Rs/yr. TESV of Karnataka wetlands amounts to 285 billion Rs/yr and the NPV is 7321 billion rupees. The valuation of ecosystem services underlines the fact that wetlands are highly productive and economically viable ecosystems, and the accounting of ecosystem services provides crucial information for optimal decision making toward the wise use of wetland resources.
Conservation of wetland ecosystems entails regular monitoring of water quality, recording of aquatic species, regular removal of accumulated silt, maintaining riparian vegetation, prevention of untreated wastewater inflow, regulating the introduction of exotic species, implementation of constructed wetlands and algal pond at inlets for nutrient removal, awareness among stakeholders, including public through regular seminars, workshops, and media, encouraging research on wetlands, adoption of wetlands by the local educational institutions for regular monitoring and environmental education programmes, and constituting a functional working committee of subject experts, local people, and decision makers for regular auditing and to provide valuable inputs to the wetland custodians.
Acknowledgement
We thank the EIACP (ENVIS) Division, The Ministry of Environment, Forests and Climate Change, Government of India and Indian Institute of Science (IISc) for the sustained support to ecological research.
Environment Education at all levels to enhance environmental literacy for environmentally sound development
T V Ramachandra and Medha Murthy
Energy & Wetlands Research Group
[CES TE15], Centre for Ecological
Sciences,
Indian Institute of Science, Bangalore
– 560 012, India.
Tel:91-80-
22933099/22933503 (extn 107, 114),
Fax:
91-80-23601428/23600085/23600683[CES-TVR]
Communication
E Mail:
tvr@iisc.ac.in;
energy.ces@iisc.ac.in
The 1960s and 1970s saw increasing awareness in the public about worsening environmental conditions; a thriving counterculture in the USA and books such as Silent Spring (1962) served as a medium through which the public could understand the extent of anthropogenic impact on the environment, and voice their questions and concerns [1]. The emergence of environmental issues as a global concern was driven by several important social movements brought about by the public, such as the first official Environmental Justice Movement in North Carolina. Environmentalists who communicated to people the dangers they were in due to environmental degradation received immense public backing and went on to campaign successfully for the introduction of regulatory laws; an example being Claire Patterson and his research on lead in the ocean and atmosphere, which he used to lobby for the Clean Air Act[1].
To this day, people remain integral to the cause of environmental justice and protection. They have the right to be involved in the management and conservation of the world around them, and when aware of environmental issues, they can contribute significantly to sustainability efforts. For example, a study cited in a report [2] by the National Environmental Education and Training Foundation shows that environmentally knowledgeable individuals are:
- 50% more likely to recycle
- 50% more likely to avoid using chemicals in yard care
- 10% more likely to save energy at home
- 10% more likely to purchase environmentally safe products
Clearly, some base level of environmental understanding in the public is vital. At this juncture, it is important to define the terms Environmental Education and Environmental Literacy, and further explore the connection between them.
Defining Environmental Education and its Importance:
Environmental Education is defined by UNESCO as a learning process that increases people's knowledge and awareness about the environment and associated challenges, develops the necessary skills and expertise to address the challenges, and fosters attitudes, motivations, and commitments to make informed decisions and take responsible action. In short, we may say that the true aim of EE is to inculcate Environmental Literacy in individuals.
Environmental Literacy is a neat term comprising these values as defined by the NAAEE: an awareness of and concern about the environment and its associated problems, as well as the knowledge, skills and motivations to work toward solutions of current problems and the prevention of new ones.
Today, most of us pick up environmental knowledge in bits and pieces from the news, social media, our peers, and perhaps even entertainment media. Rife with bias and misinformation as these sources are, they do not help us gain much meaningful knowledge of our surroundings, ie, environmental literacy cannot be achieved. This is why environmental education is vital- by introducing it at all levels of formal education and elsewhere, awareness and respect of the environment may be developed in individuals from childhood.
Environmental education must provide a scientifically sound knowledge base of various aspects of the natural environment, as well as a systems thinking approach to understanding the various ecological, climatic, political and social contexts that shape this environment, and their relationships with each other. Learners should develop critical thinking skills, (especially in today’s social media landscape of fake news and misinformation), so they can make informed decisions about how they interact with the environment and other structures related to it. Creative problem solving should also be encouraged, so that learners may develop innovative solutions for the issues facing society today [3,9,10,11].
Importance of Widespread Environmental Literacy:
Environmentally literate citizens are vital, as the emergence of environmental science in the US and movements closer to home such as the Chipko movement demonstrate. Public awareness can increase public participation [6], and encourage people to be proactive in environmental protection- through engagement with the making/implementation of government policies, making environmentally conscious lifestyle changes and championing environmental causes in their communities. By developing environmental literacy and understanding of stewardship in the future generation, we can prepare them to manage resources more responsibly. Conducting training programs may help officials and decision makers to integrate sustainable development principles in their proposals and policies.
A Brief History of Environmental Education:
The importance of imparting a working knowledge of the environment to the public started to be recognised in the 1970s, with the first United Nations Conference on Human Environment taking place in Stockholm in 1972, and the first Intergovernmental Conference on Environmental Education being held in Tbilisi, Georgia (then USSR) in 1978. Chapter 36 of Agenda 21, the report of the Earth Summit held in Rio De Janeiro in 1992, encouraged member states to increase awareness and education on the environment and development[3].
Environmental education was seriously considered in India as early as 1964, with the Kothari Commission recommending some form of EE, and the Centre for Environmental Education was formed in 1984. However, it was not till December 2003 that the Supreme Court mandated that NCERT prepare a syllabus (effective from 2004) that included environmental education in the curriculum for all years (1-12), which the states would then implement in all their schools. In an affidavit from 2007, NCERT describes an inclusion based approach, wherein principles of environmental science are included in other core subjects[5].
A Brief Review of EE in India and The World Today:
Problems with India’s approach to environmental education persist. The focus in most schools is still direct transmission of theoretical, textbook-centric knowledge, rather than a holistic, locale-specific approach that encourages analysis and critical thinking. Dr. David Orr[10], a stalwart of the field, describes how boxing of knowledge into core subjects (as is done in the inclusion approach recommended by NCERT) creates a divide between students and the environment, by excluding the interconnectedness of these principles[4].
Also concerning is the lack of inclusion of traditional knowledge concerning land stewardship in current EE programs (the Eurocentrism of EE, that ignores perspectives from marginalized people who have experienced ecological poverty[4]), and fewer initiatives that empower communities to maintain their own resources. Community resource management is vital for a number of reasons- people deserve to participate in decisions made about their surroundings, they can hold authorities accountable, improving the quality and procedural legitimacy of decisions taken[8].
Activities such as debate, research projects, and community outreach initiatives, as well as actual interaction with the environment for younger students would be far more effective in helping students connect with their surroundings meaningfully.(see in detail study cited below that demonstrated which kinds of education had the highest positive impact on students)(CEE has initiated some programs with respect to this, such as EOSE[4], but systemic change is required)
Very few honors/bachelors programs specifically for environmental science exist at an undergraduate level, and even if they do they are usually not well developed. School teachers often do not have a background in environmental science; they do not receive adequate training in teaching the subject, and are only briefed on the material. Activities that students are encouraged to do, such as tree planting and community cleanups, are often performative and tokenistic, with no real thought given to underlying issues or proper scientific methodology[7,9].
Dr. Orr also describes the aspects of environmental science that require questioning current political or economic structures are left out at higher levels of education, where they are critical. Within the confines of centralized, discipline-centric EE, students are not directed to truly think about their relationship to nature[11], and question the societal power structures that exist in relation to it. Research shows that other non-school avenues hold immense potential- such as community engagement activities and sites, extra curricular workshops and hands-on research and experience, and eco-based tourism[9].
Initiatives From the United Nations:
- Young Champions of The Earth (2020): Seven young people, selected from every global region based on the merit of their ideas for positive environmental change, were provided with seed funding, attendance at high level UN meetings, an introduction to dignitaries, as well as guidance and mentorship to continue working on their ideas.
- Earth School: A joint project by UNEP and Ted-Ed introduced during the pandemic to help students, parents and educators remain connected to the natural world. With over 30 different lessons on different aspects of the natural world and what it takes to conserve them, the program aimed to develop stewardship and environmental literacy in learners around the globe.
- Massive Open Online Courses (MOOCs): These are highly accessible courses covering subjects such as Nature-based Solutions for Disaster and Climate Resilience, and Marine Litter.
- Playing for the Planet Alliance: An initiative to raise awareness among young people through the massive reach of online gaming platforms. Members of this alliance have pledged to reduce their emissions, support the global environmental agenda, and integrate environmental principles and concepts into their gameplays.
- Publications such as the Little Book of Green Nudges (a guide describing how to reduce a campus’ environmental impact through behavioral changes) and Green Jobs for Youth (a document that raises awareness and provides information on the growth of green jobs, green job pathways, how to incorporate a green aspect in any organization and relevant information on how to provide student with green opportunities, mostly aimed at higher education institutes)[12]
Initiatives From the Centre for Environmental Education (India):
CEE has spearheaded several important initiatives over the years, a few of which are listed below.
- Paryavaran Mitra: National level school network initiative, introduced by CEE and the Ministry of Environment, Forest and Climate Change. This program provides schools with resources that enable them to conduct action projects and engage students in such projects that focus on local environmental issues (the five themes delineated by the program are Water & Sanitation, Biodiversity and Greening, Energy, Waste Management and Culture & Heritage. Other curricular and extracurricular activities are also conducted by CEE.
- Eco Club Programs: Encouraging the formation of eco clubs in schools across the country in collaboration with NGOs and the Ministry of Environment, Forest and Climate Change. National Green Corps, Clean Ganga Club and Dolphin Club are examples of such initiatives.
- Sustainable School Campus Programme- Anandshala was developed by CEE in collaboration with UNICEF and the Government of Gujarat, working with schools to increase the quality of education and sustainability of the schools’ infrastructure. This program has also been implemented in Jammu and Kashmir, Rajasthan, Andhra Pradesh and Karnataka.
Initiatives From Energy and Wetlands Research Group:
https://wgbis.ces.iisc.ac.in
In light of this review, we describe some of the initiatives conducted by the ENVIS program (https://wgbis.ces.iisc.ac.in/) and the Energy and Wetlands Research Group (https://wgbis.ces.iisc.ac.in/energy/) at IISc. These are community-driven, with strong emphasis on developing deep rooted scientific understanding of immediate surroundings and care and respect for nature, and tackling local environmental challenges as a base for studying more global/national scenarios. The initiatives include but are not limited to symposiums, lectures, full-fledged courses and mentoring programs.
-
Biennial Lake Symposium: As part of
this international event, students
and teachers from schools and
colleges around the state are
invited to present papers on
research/project work they have done
in the field of environmental
science, and network with peers and
experts. EWRG interacts with these
students throughout the course of
their projects, helping to develop
their ideas, concepts and scientific
inquiry skills further, and
encouraging them to think deeply
about issues in their surroundings.
Keeping with the themes of Lake
2022, students this year presented
projects involving water/soil
quality testing in nearby lakes,
biodiversity surveys, innovative
experiments with the effects of
pollutants on plants and vice versa,
identification of problems in local
waste management and measures to
overcome them, as well as awareness
campaigns they had conducted in
their communities.
200 participating students from over 6 schools gained in-depth, practical environmental knowledge, as well as necessary skills and experience working with the social and political structures which manage the local environment (such as city development boards, panchayats etc) This program encourages critical thinking, creative problem solving and environmental responsibility. By allowing children to think for themselves and innovate, it aims to inculcate the confidence and skills to make significant changes in the next generation. 12 such symposiums have been held till this date, with this being the 13th.
-
Know your ecosystem: Consisting of
workshops held both in city school
premises and the lush IISc campus,
this program program aims to help
kids brought up in Bangalore’s
highly urbanized environment
reconnect with their surroundings;
providing expert insight into local
biodiversity and local environmental
issues in a scientific, hands-on way
for older children, and with fun
activities and games for younger
children. By inculcating
appreciation for the environment and
science in these children, this
program hopes to foster the desire
and skills to actively protect their
environments. 412 such events have
been held since 1998, with a few
examples being: (more details can be
found on the EWRG webpage)
- World Ozone Day celebration at BGS National Public School
- Workshop on Wetlands at Ideal International School
- Workshop on Field Ecology at R.K.Mission Auditorium
- Village Biodiversity Mapping in Kanakpura Through School Students and Teachers on Science Day
-
Workshop on Role of Students
in Coastal Ecosystem
Management - multiple
locations
-
Environmental Management Course:
These rigorous, capacity building
courses for working professionals
from industry, universities and
governmental and non governmental
organizations help them integrate
sustainability principles and
environmental concerns into their
fields. This year, the course
involved four months of teaching, a
final project, and expert lectures
from stalwarts of the fields of
urban planning, resource management,
remote sensing and ecology. The
diverse backgrounds of the
participants allowed them to provide
unique insights on the concepts,
making it an enriching experience
for all. Common workshops are also
conducted as part of the course,
such as the Workshop on Ecological
Sampling Techniques conducted in
2021. 20 such sessions have been
held from 2003 to 2022.
-
Invited talks, keynotes addresses
and lectures- 1813 such talks
drawing on disciplines from
environmental science have been
given at various institutions across
the country.
-
Mentorship For Interns: EWRG has
hosted 55 postgraduate, graduate,
undergraduate and high school
students as interns so far. 185
Master’s thesis dissertations
from various institutions have been
presented through this research
group, with 16 in the year
2021-2022. 17 Doctoral theses have
also been completed through EWRG,
with majority of these students
currently serving as faculty in
institutions such as IIT, MSRIT,
Petroleum Research Institute and
Agarkar Research Institute.
-
Other Initiatives:
- Water testing labs have been set up at 8 network schools, empowering students with environmental knowledge through monitoring of ecosystems, and hands-on experience with handling scientific equipment.
- AICTE-QIP short term courses have been held on topics such as Principles and Applications of GIS and Remote Sensing, Municipal Solid Waste Management, Free and Open Source Geospatial Technologies for Natural Resource Management. 18 such courses have been conducted by EWRG so far.
- Green Skill Development Program (GSDP): As part of an initiative by the Ministry of Environment, Forest and Climate Change to develop green skills in workers for a sustainable future, IISc-EWRG provided 3 courses on valuation of ecosystem services and green GDP in the period of 2018-2022.
Analysis:
Initiatives by EWRG are unique in that they do not rely on indirect engagement through school teachers and school curriculum structures- which is possible as they are local and don’t need to be coordinated nationwide. Direct engagement of learners and educators with EWRG scientists and researchers with expertise and experience in the field of environmental science was integral to the success of these efforts- as they could provide insight and knowledge that educators without a background in the field might not have.
With school-level engagement being extracurricular, EWRG programs are not confined to operate within the rigid framework of the school curriculum. Efforts have also been made to make these programs inclusive and accessible to smaller schools for underprivileged children, both through online platforms and through actually visiting these schools present all over the state.
Smaller scale initiatives such as these also have the advantage of being able to take into account local cultures and perspectives to help illustrate concepts, which global programs such as MOOCs might not be able to (for example, language might be a barrier for many students in India, so a more local program is beneficial ) It’s not a matter of one over the other- rather, both programs should exist and be accessible in order to provide holistic environmental education to students.
Conclusion:
Environmental education is a critical component of today’s society, and is essential for responsible citizenship and the prevention of further environmental degradation. It is especially important for countries that are developing as rapidly as India, as much environmental destruction has accompanied this growth, and needs to be stopped. However, EE as a field requires reformation in India- premier educational institutions can help this process along by conducting grassroots-level programs with a sound scientific base for whole communities as well as students.
Spatial Decision Support System for managing fish resources in Bangalore
Sincy V. 1,4, Asulabha
K. S. 1,4, Abhishek B.
1, Jaishankar R.
4 and Ramachandra T. V.
1,2,3*
1 - Energy & Wetlands Research Group
[CES TE15], Centre for Ecological
Sciences,
2 - Centre for Sustainable Technologies
(astra)
3 - Centre for infrastructure,
Sustainable Transportation and Urban
Planning (CiSTUP)
Indian Institute
of Science, Bangalore – 560 012,
India.
4 - CV Raman Laboratory of Ecological
Informatics, Indian Institute of
Information Technology and Management -
Kerala, Thiruvananthapuram –
695581, Kerala, India.
Tel:91-80-
22933099/22933503 (extn 107, 114), Fax:
91-80-23601428/23600085/23600683[CES-TVR]
*Communication
E Mail: *
tvr@iisc.ac.in
Abstract
The worth of wetlands is evident from the provision of various ecosystem services, such as provisioning, regulating, and cultural services. The wetlands are important feeding and breeding grounds for ichthyofauna. But the water quality and ichthyofaunal biodiversity of the wetlands are dependent on various abiotic and biotic factors. Water pollution and wetland degradation have been increasing for decades as a result of untreated or partially treated wastewater inflows and solid waste dumping. These pollutants influence the water quality and disturb the life cycles of aquatic organisms. As a result, habitat destruction and a decline in native species of ichthyofauna were recorded. Hence, these wetlands need to be protected from further degradation. With the improvement of the internet, decision support systems (DSS), geographic information systems (GIS), and visualization tools, the development of a web-enabled spatial decision support system (SDSS) for ichthyofauna is necessary for initiating conservation measures. The main objective of this paper is to design and implement the Ichthyofauna spatial decision support system (ISDSS), focusing on ichthyofauna in the lakes of Bangalore. ISDSS has been designed through free and open source software such as Geoserver, PostgreSQL, GeoTools, and Openlayers and spatial information of Open Geospatial Consortium (OGC) standards for multiple criteria analysis. The present study includes 36 lakes in 3 valleys of Bangalore (Koramangala and Challaghatta valley, Vrishabhavathi valley, and Hebbal valley). The ISDSS includes a total of 18 ichthyofauna species belonging to 14 genera, 4 orders, and 7 families. The ISDSS is an interactive, computerized, spatial decision support system with a repository of data pertaining to the quality of ecosystems and ichthyofauna diversity that assists the decision makers in the analysis and visualization of information towards strategic decision-making.
Key words: Spatial decision support
system, GIS, Wetlands, Habitat
quality, Ichthyofauna
Introduction
Wetlands are vital ecosystems that provide numerous ecosystem services (SEEA, 2021; Ramachandra et al., 2021a), such as provisioning (products obtained from the ecosystem), regulating (benefits obtained through the regulation of various ecosystem processes), and cultural services (nonmaterial benefits obtained through spiritual enrichment, cognitive development, aesthetics, and recreation), as shown in figure 1.

Figure 1: Ecosystem services from wetlands
The Ramsar convention on wetlands, an international treaty for the conservation and sustainable use of wetlands signed in 1971, defined wetlands as "areas of marsh, fen, peat land or water, whether natural or artificial, permanent or temporary, with water that is static or flowing, fresh, brackish, or salt, including areas of marine water, the depth of which at low tide does not exceed 6 m.’’ Currently, there are about 2,455 Ramsar sites in the world, covering an area of 255,897,678 hectares (https://www.ramsar.org/). In India, 75 wetlands have been identified as Ramsar sites or wetlands of international importance (as of August 2022), with the Sundarbans in Kolkata being the largest and the Renuka wetland in Himachal Pradesh being the smallest Ramsar site in India. Now, Tamil Nadu State has the highest number of Ramsar sites with 14, followed by Uttar Pradesh with 10 Ramsar sites. The Ranganathittu Bird Sanctuary in the Mandya district of Karnataka State has been recently declared as Ramsar site (figure 2).

Figure 2: Ramsar
sites in India
Ichthyofauna, or fish, help in nutrient cycling, controlling the growth of aquatic weeds and vegetation, and mosquito control, apart from providing both recreational and cultural values. Fish is highly nutritious, low in fat, high in protein content, and an excellent source of Omega-3 fatty acids. Fish act as a valuable bioindicator for evaluating environmental contamination as well as trace element pollution (Sincy et al., 2022; Plessl et al., 2017). Fish mortalities in lakes are triggered by both abiotic and biotic factors like variations in weather patterns, water temperature, dissolved oxygen, pH, turbidity, salinity, ammonia, carbon dioxide, pesticides, toxic algae, thermal shock, organic pollutants, and the overgrowth of microalgae and macrophytes in lakes (Ramachandra et al., 2016). Threats to fishdiversity include alteration of habitat, reduction of habitat area, overfishing, construction of dams, drought, loss of interconnectivity among water bodies, siltation, pollution of water bodies, introduction of non-native (exotic) species, etc. (Gupta et al., 2015).
Even though wetlands provide numerous ecosystem services, they are very fragile and threatened ecosystems due to anthropogenic stress. The effluents emanating from industries, the extensive use of fertilizers, pesticides, and insecticides in agricultural fields, and the discharge of domestic waste and sewerage from urban areas contribute to the deterioration of the water quality in wetlands, resulting in the loss of aquatic biodiversity. Polluted waters are enriched with nutrients, ions, and organic matter (Ramachandra et al., 2020a; Ramachandra et al., 2021b). Heavy metals such as zinc, copper, nickel, mercury, cadmium, lead, and chromium discharged from wastewater into the environment at higher concentrations are toxic or carcinogenic and persist for longer periods in the environment (Fu and Wang, 2011). Heavy metal pollution of aquatic ecosystems results in bioaccumulation and biomagnification in biota at different trophic levels (Ramachandra et al., 2020b; Adhikari et al., 2009). An increase in heavy metal concentrations in fish and water may induce mutagenic and genotoxic effects in aquatic organisms as well as cause deleterious effects on human health upon consumption (Ali et al., 2020). Thus, it is important to conserve wetlands and their ichthyofauna.
An interactive computer-based decision support system (DSS) helps to compile, analyze, and present the data for decision-making. For example, DSS has been developed for regional energy planning (Ramachandra et al., 2006); for assessing regional biomass energy potential (Ramachandra et al., 2005); and for assessing micro, mini, and small hydel potential (Ramachandra et al., 2004). Geographic information system (GIS) use maps to help people view, interpret, and visualize data and reveal trends. Thus, it is a promising tool that helps in depicting the spatio-temporal dynamics of environmental factors and the distribution of biodiversity in lakes. Spatial decision support system (SDSS) that integrates both geographic information systems (GIS) and decision support systems (DSS) makes use of geographic or spatial data for effective decision-making (Ramachandra et al., 2017; Keenan, 2006; Jarupathirun, 2007). The characteristics of SDSS are shown in figure 3.

Figure 3: Characteristics of SDSS
Several web-based spatial decision
support systems have been developed,
such as WebWMPI for watershed management
(Zhang et al., 2011); DSS-WMRJ for
watershed management (Zhang et al.,
2015); SDSS for watershed management
(Choi et al., 2005); for land management
and soil conservation (Terribile et al.,
2015); and interactive well water risk
estimation (iWWRE) to monitor water
contamination in private wells in North
Carolina (Lan et al., 2020). Databases
that provide information on fish include
FishBase (a global biodiversity
information system on finfishes);
Ffish.asia (freshwater fish biodiversity
of Southeast and East Asia); Ichthyology
Collection Database (freshwater fish
biodiversity); Fish Pathogens Database
(information on isolates of fish
pathogens); etc. These databases record
only the biodiversity information and
distribution patterns of fish species
but do not provide habitat quality data.
There are only a few studies in
Bangalore on ichthyofauna diversity and
its habitat conditions. But a database
on ichthyofauna and its habitat
(wetlands) has not yet been developed.
The main objective of this paper is to
design the Ichthyofauna Spatial Decision
Support System (ISDSS), focusing on
ichthyofauna in freshwater ecosystems in
Greater Bangalore.
Materials and Methods
Study area
Greater Bangalore (12°49’5’’N to 13°08’32”N latitude and 77°27’29”E to 77°47’2”E longitude), covers an area of 741 square kilometers. The district is located at an altitude of 920 m above mean sea level, and is divided into three watersheds: Hebbal, Koramangala-Challaghatta, and Vrishabhavathi (figure 4). The undulating terrain in the region has facilitated the creation of a large number of tanks providing water for irrigation, drinking, fishing, and washing purposes (Ramachandra and Kumar, 2008).

Figure 4: Lakes of
Greater Bangalore
Water sampling and physicochemical analysis
The water samples from 36 lakes in Bangalore (figure 4) were collected in clean and sterile polypropylene bottles and carried to the laboratory for physicochemical analysis. Some physicochemical parameters are measured on site, such as water temperature (WT), electrical conductivity (EC), total dissolved solids (TDS), pH, and dissolved oxygen (DO). The parameters, such as total alkalinity (TA), chlorides (Cl), nitrate (N), orthophosphate (OP), total hardness (TH), calcium (Ca), magnesium (Mg), chemical oxygen demand (COD), and biochemical oxygen demand (BOD), were analyzed in the laboratory using standard methods (APHA, 2005).
Ichthyofauna sampling and identification
Ichthyofauna (fish) specimens were collected from the monitored lakes of Bangalore with the help of a gill net or cast net by local fishermen. The geographical coordinates of sampled sites were measured with the help of Garmin GPS (Garmin GPSMAP 64S, USA). Photographs of fresh specimens were taken with the help of a digital camera. Then the specimens were preserved in a 10% formaldehyde solution. The specimens were identified up to the species level through standard taxonomic keys, reference books (Jayaram, 1999; Talwar and Jhingran, 1991), and a virtual database - Fish Base (http://fishbase.org). The conservation status of fish was recorded (IUCN Red List of Threatened Species).
Development of Spatial DSS on fish data
Ichthyofauna spatial decision support
system (ISDSS) has been designed through
free and open source software such as
Geoserver, PostgreSQL, GeoTools, and
Openlayers and spatial information of
Open Geospatial Consortium (OGC)
standards for multiple criteria
analysis.
Results and Discussion
Spatial DSS for managing fish resources
The current study involved the design of the Ichthyofauna Spatial Decision Support System (ISDSS). The ISDSS gives details like lake name, village name, latitude, longitude, water quality, and fish species found in the lakes of Bangalore, Karnataka, India. Since water quality parameters such as temperature, pH, carbon dioxide, DO, ammonia, nitrite, suspended solids, and alkalinity influence the growth, reproduction, and survival of ichthyofauna (Okoliegbe et al., 2020), it is necessary to include habitat quality in the ISDSS. The present study covers 36 lakes in 3 valleys of Bangalore and recorded a total of 18 ichthyofauna species belonging to 14 genera, 4 orders, and 7 families.
The Home page contains sections like Lakes, Ichthyofauna, Literature, Fish Database, and Contact (figure 5).

Figure 5: ISDSS

Figure 6: Lakes section
in ISDSS
Lakes include information on lakes lying under Koramangala and Challaghatta valley, Hebbal - Nagavara valley, and Vrishabhavati valley in Bangalore, Karnataka, India. The attributes include: the geographical location and description of the lakes; water quality parameters; and ichthyofauna species in the lake.
Ichthyofauna includes attributes such as: Kingdom; Phylum; Class; Order; Family; Common name; Synonym; Kannada name; Feeding habit; Fish diet; IUCN status; Moisture, Protein; Fat; and Ash content of each species; description of the ichthyofauna species; their ecological and economic importance; as well as habitat condition (figure 7). The economic importance of fish is included in the ISDSS as they constitute a valuable source of protein, vitamins, and minerals along with polyunsaturated fatty acids (PUFA) that are essential for human health (Barik, 2017).

Figure 7: Ichthyofauna section in ISDSS
Literature contains published articles, reports, and useful links pertaining to ichthyofauna species and habitat quality.
Fish Database provides links to other databases on ichthyofauna (fish) in the world.
Contact contains address and contact number of Environmental Information System (ENVIS), Centre for Ecological Sciences (CES), Indian Institute of Science, Bangalore.
ISDSS is a user-friendly, computerized,
spatial decision support system that
helps decision makers improve water
quality and protect aquatic diversity in
urban wetlands.
Conclusion
The present study focused on the design
and implementation of the Ichthyofauna
Spatial Decision Support System
(ISDSS). ISDSS will improve
knowledge of urban wetlands and
ichthyofauna diversity for wise use of
wetlands. It covers 36 lakes in 3
valleys of Bangalore, which recorded 18
ichthyofauna species belonging to 14
genera, 4 orders, and 7 families. A
web-based Ichthyofauna spatial decision
support system handles, displays,
analyses data to allow effective
visualization and querying that satisfy
the end users. ISDSS will help the
public and policymakers
easily understand the ecosystem
dynamics and biodiversity so that
appropriate conservation measures can be
taken.
Recommendations
Fish growth and development are
influenced by both abiotic and
biotic factors. A change in the water
quality parameters may affect the growth
and survival of fish. Conservation
measures to maintain fish biodiversity
include: (a) avoiding pollution due to
untreated sewage, industrial effluents,
fertilizers, pesticides, and other
anthropogenic activities; (b) avoiding
harvesting fish during the spawning
period; (c) avoiding harvesting
juveniles; (d) banning the
introduction of exotic species into
lakes; and (e) educating locals about
the importance of lakes and ecology of
freshwater fishes.
Acknowledgments
We are grateful to the EIACP (ENVIS) Division, The Ministry of Environment, Forests and Climate Change, the Government of India and the Indian Institute of Science for the sustained support for ecological research.
Microalgal SDSS for sustainable management of lakes
Asulabha K. S. 1,4 ,
Sincy V. 1,4, Abhishek B.
1, Jaishankar R.
4 and Ramachandra T. V.
1,2,3*
1 - Energy & Wetlands Research Group
[CES TE15], Centre for Ecological
Sciences,
2 - Centre for Sustainable Technologies
(astra)
3 - Centre for infrastructure,
Sustainable Transportation and Urban
Planning (CiSTUP)
Indian Institute
of Science, Bangalore – 560 012,
India.
4 - CV Raman Laboratory of Ecological
Informatics, Indian Institute of
Information Technology and Management -
Kerala, Thiruvananthapuram –
695581, Kerala, India.
Tel:91-80-
22933099/22933503 (extn 107, 114), Fax:
91-80-23601428/23600085/23600683[CES-TVR]
*Communication
E Mail: *
tvr@iisc.ac.in
Abstract
Microalgae are the primary producers and represent flora diversity in wetlands. The composition of algae depends on the environmental conditions of its habitat, based on the water quality parameters including physical, chemical, and biological parameters. Microalgae as bioindicators, aid in the biomonitoring of wetland ecosystems, due to their nutrient requirements, rapid reproduction rate, and very short life cycle. Decision support system based on microalgae helps in monitoring fragile wetlands. An interactive computer-based Decision Support Systems (DSS) helps to compile, analyse and present the data for wetland management. Spatial Decision Support System (SDSS) combines the technologies of Geographic Information Systems (GIS) and DSS to aid decision-makers with problems that have spatial dimensions. The current study presents a Microalgae Spatial Decision Support System (MSDSS) designed for assessing the status of wetlands, based on microalgal data. The SDSS is developed with the integration of spatial data through free and open source software such as Geoserver, PostgreSQL, GeoTools, and Openlayers, which aids in data analyses for assessing the quality of wetland ecosystems and microalgal biodiversity. A total of 101 genera of phytoplankton belonging to 5 phyla, 9 classes, 24 orders, and 41 families were recorded through monitoring of 115 lakes in Bangalore. The microalgae in Bangalore lakes belonged to Chlorophyta, Bacillariophyta, Cyanobacteria, Charophyta, and Euglenozoa.The MSDSS, with the location-specific information of wetlands, aids in decision-making through data interpretation and visualization. MSDSS will help with wetland protection, management, and conservation in Bangalore, Karnataka, India.
Key words: Wetlands, Microalgae, Spatial decision support system, Water quality, GIS
Introduction
Wetlands are ecotones (transition zones) between terrestrial and aquatic environments that provide abundant beneficial services. Wetlands provide crucial ecosystem services such as provision of fish, fodder, fuelwood, water supply, water purification, groundwater recharge, nutrient cycling, erosion control, flood control, carbon sequestration, and providing habitats for aquatic flora and fauna, as well as providing opportunities for education, aesthetics, and recreation (Ramachandra et al., 2016). The provisioning service, regulating service, and cultural service provided by Karnataka wetlands were 1.8 lakh Rs/ha/year, 7 lakh Rs/ha/year, and 1.3 lakh Rs/ha/year, respectively. The TESV and NPV of Karnataka wetlands were 285 billion rupees/year and 7321 billion rupees, respectively (Ramachandra et al., 2021). Wetlands in Bangalore are polluted and more degraded due to pollutants from untreated sewage or wastewater released from industrial, commercial, and residential areas as well as agricultural runoff (Ramachandra et al., 2020a). The inflow of untreated domestic sewage into lakes results in water quality deterioration, alteration of the physicochemical characteristics of water, nutrient (nitrogen and phosphate) accumulation in lakes, groundwater contamination, eutrophication, excessive growth of microalgae and aquatic macrophyte, silt and organic matter accumulation, and the occurrence of blue-green algal blooms, which cause taste and odour problems. This in turn decreases dissolved oxygen levels in lakes, affecting aquatic biota and ultimately hampering ecosystem functioning (Hilton et al., 2006). Analyses of urban dynamics in Greater Bangalore using temporal remote sensing data revealed an increase in urban area (1028%) with decreases in vegetation (88%) and water bodies (79%) during 1973–2017 (Ramachandra and Bharath, 2016).
Microalgae play a pivotal role in the food web, as they are the primary producers and provide food for consumers like zooplankton and fish. Microalgae are chlorophyll-bearing, photosynthetic organisms that have the ability to convert sunlight into food and energy and release oxygen as a by-product of photosynthesis (Asulabha et al., 2022). Microalgae aid in wastewater treatment (phycoremediation), due to their ability to use inorganic nitrogen and phosphorus for their growth and reproduction. They are capable of removing heavy metals, pesticides, and hydrocarbons from water (Kaloudas et al., 2021). Microalgae are a significant component of biological monitoring programmes for assessing water quality. They aid in the cost effective assessment of water quality because of their ability to uptake nutrients, rapid reproduction rate, and very short life cycle. Microalgae act as bioindicators, which provide information on ecosystem status and trends, thus, serving as a cost-effective biomonitoring tool.
A decision support system (DSS) is an interactive computer-based system that helps decision makers utilize data and models to solve unstructured problems (Ramachandra et al., 2005). For example, decision support systems have been developed for wetland management (Janssen et al., 2005); biodiversity conservation (Guillet et al., 2012); and forest management (Blondeel et al., 2021). Spatial decision support systems (SDSS) are an extension of the decision support system (DSS) concept, with spatial data used for the analysis of decisions (Ramachandra et al., 2004; Keenan, 2006; Jarupathirun, 2007). Thus, SDSS, which integrates technologies from both GIS (geographic information system) and DSS, helps in decision-making. Recent advancements in DSS, remote sensing, and GIS technologies have found increased applications in ecosystem management and nature conservation (Jafary et al., 2018; Greco et al., 2017; Geneletti, 2004; Vacik and Lexer, 2001). A web-based spatial decision support system (WSDSS) with multiple criteria decision analysis (MCDA) helped to prioritize ecologically sensitive regions in the Uttara Kannada district of Karnataka based on ecological, biological, geo-climatic, renewable energy, and social variables (Ramachandra et al., 2017). Web mapping application (WMA) is developed for for wetland management (SDSS) . An open-source GIS software and JavaScript library plugins, including a PostGIS database, GeoServer, and Leaflet library, were used for WMA for the Kolleru Lake aquaculture system (Kolli et al., 2022). A web-based SDSS, namely, web-based participatory urban planning (WPUP), was developed to enhance public participation in urban planning processes (Mansourian et al., 2011). Numerous databases on algae have been developed worldwide, for example, AlgaeBase (a global algal database); Australian Fresh Water Algal Name Index (records freshwater algae); Algae of India (records algae diversity); Algal Bloom Information Service (for bloom monitoring in the Indian Ocean); Diatoms of North America (diatom diversity); etc. One of the drawbacks of these databases is that they do not provide habitat quality. Thus, a database needs to be designed that provides information of both the freshwater algae diversity and the water quality. The main objective of the current study is to design a Microalgae Spatial Decision Support System (MSDSS) for assessing the status of wetlands, focusing on microalgae data of lakes in Bangalore, Karnataka State, India.
Materials and Methods
Study Area
Greater Bangalore (12°49’5’’ N to 13°08’32” N latitude and 77°27’29” E to 77°47’2” E longitude) in Karnataka State covers an area of 741 square kilometers. The district is located at an altitude of 920 m above mean sea level, delineating three watersheds, namely Koramangala and Challaghatta valley, Vrishabhavathi valley, and Hebbal valley. The mean annual rainfall in Bangalore is 880 mm, with 60 rainy days a year over a decade. The summer temperature ranges from 18°C - 38°C, while the winter temperature ranges from 12°C - 25°C. The present study surveyed 115 lakes in Bangalore, Karnataka State, India. Water quality monitoring and recording of microalgal diversity in 96 lakes in Bangalore were performed as part of a biomonitoring exercise and the creation of a database (figure 1).

Figure 1: Lakes of
Bengaluru, Karnataka State, India.
Water quality analysis and Microalgal diversity
Water samples were collected in clean and sterile polypropylene bottles and transported to the aquatic ecology laboratory (at Indian Institute of Science) for water quality analysis. Physicochemical parameters like water temperature (WT), pH, electrical conductivity (EC), total dissolved solids (TDS), and dissolved oxygen (DO) were measured at site. Other chemical parameters were estimated in the laboratory, such as total hardness (TH), calcium (Ca), magnesium (Mg), chlorides (Cl), total alkalinity (TA), nitrate (N), orthophosphate (OP), chemical oxygen demand (COD), and biochemical oxygen demand (BOD), using standard methods (APHA, 2005). Microalgae were collected from the lakes of Bangalore using a plankton net and then fixed with 4% Lugol’s iodine solution. Microalgae taxa were identified to the taxonomic level, according to the standard keys (Desikachary, 1959; Prescott, 1970; AlgaeBase, 2021), and enumerated with an optical microscope at 10 X, 40 X, and 100 X magnifications.
Creation of Microalgal SDSS
Microalgae Spatial Decision Support
System (MSDSS) designed to
visualize the status of wetlands in
Bangalore, focusing on microalgae
diversity data. The SDSS has been
designed through the integration of
spatial data using free and open source
software such as Geoserver, PostgreSQL,
GeoTools, and Openlayers. MSDSS aids in
visualizing lake wise water quality and
microalgal biodiversity.
Results and Discussion
Microalgae SDSS
The water quality parameters play a decisive role in the structure and composition of microalgae (phytoplankton) in aquatic ecosystems. The deterioration of the wetland environment or variations in the physicochemical characteristics of water affect the community structure and biodiversity of aquatic organisms (Kock et al., 2019; Wang et al., 2019). The increasing water pollution and harmful cyanobacterial algal blooms due to nutrient enrichment in lakes pose a serious threat to freshwater resources and biodiversity. MSDSS provides a framework for integrating database management systems, with WMS (Web map service) and WFS (web feature service) to viusalise water quality and microalgal diversity , which provides insights for prudent management by decision-makers.
The Microalgae Spatial Decision Support System (MSDSS) provides information on the microalgae diversity of lakes in Bangalore with water quality for monitored 96 lakes in Bangalore (figure 2).

Figure 2: Data
input to MSDSS

Figure 3: Microalgae Spatial Decision Support
System (MSDSS)
Figure 3 illustrates MSDSS GUI (graphic user interface) of MSDSS with options to visualize lake-wise water quality, microalgae diversity, and associated details such as Literature, Algae Database, and Contact (figure 3).
Lakes section provides information regarding the monitored lakes valley-wise (Koramangala and Challaghatta valley, Hebbal - Nagavara valley, and Vrishabhavati valley) in Bangalore. The attributes for each lake include the geographical location, details ; water quality parameters; and microalgae in the lakes (figure 4).

Figure 4: Lake
section (MSDSS)
Microalgae data include attributes such as Kingdom; Phylum; Class; Order; Family; bio-chemical composition (Protein; Carbohydrate, and Lipid content) of each microalgae genus; description of the microalgae and their ecological and economic importance; as well as habitat condition (figure 5). The present study records a total of 101 genera of phytoplankton belonging to 5 phyla, 9 classes, 24 orders, and 41 families. The microalgae recorded in 96 lakes of Bangalore belonged to 5 major groups, such as Chlorophyta, Bacillariophyta, Cyanobacteria, Charophyta, and Euglenozoa. Microalgal biomass has valuable components like carbohydrates, long-chain fatty acids, pigments, and proteins. Lipid in microalgae is used for biodiesel production . Thus, microalgae have widerange applications including the pharmaceutical and nutraceutical industries. They also serve as bioindicators and help in CO2 mitigation (Yen et al., 2013).

Figure 5: Microalgae section (MSDSS)
Literature section in MSDSS contains published articles, reports, and useful links pertaining to microalgae and water quality of lakes.
Algae Database provides links to other databases on microalgae around the world.
Contact provides address of Environmental Information System (ENVIS), Centre for Ecological Sciences (CES).
Thus, the Microalgae Spatial Decision Support System (MSDSS) with the location-specific information of wetlands aids in decision-making through data interpretation and visualization.
Conclusion
Microalgal biomass has emerged as a
sustainable source of lipids and
proteins, with numerous
applications in the pharmaceutical and
nutraceutical industries. Thus,
documentation of microalgal diversity is
important. The Microalgae Spatial
Decision Support System (MSDSS) is
an interactive, computer-based system
that integrates both DSS and GIS
technologies, designed to support
in the efficient
decision-making. A total of 101
genera of phytoplankton belonging to 5
phyla, 9 classes, 24 orders, and 41
families were identified in 96 lakes in
Bangalore. The microalgae belonged to
Chlorophyta, Bacillariophyta,
Cyanobacteria, Charophyta, and
Euglenozoa. The data gathered from
MSDSS will help in the biomonitoring of
lakes. Thus, MSDSS would aid in the
wetland protection, management, and
conservation in Bangalore, Karnataka,
India.
Recommendations
Wetlands are highly productive
ecosystems, supporting wide array of
biological diversity by providing
habitat for a huge number of life forms
such as bacteria, phytoplankton,
zooplankton, fungi, insects, snails,
grasses, weeds, macrophytes, fish,
birds, etc. Water quality monitoring and
management of lakes at regular intervals
would help in mitigating water
pollution, the deterioration of
freshwater ecosystems, and the decline
in biodiversity. Integration of
wastewater treatment plants with
constructed wetlands and algal ponds
helps in efficient nutrient removal from
urban lakes. The management of
microalgal blooms is possible only if
measures are taken to control the levels
of nutrients (N and P) and organic
matter and promote the aeration of water
bodies (to increase the dissolved oxygen
levels).
Acknowledgements
We are grateful to the EIACP (ENVIS) Division, The Ministry of Environment, Forests and Climate Change, the Government of India and the Indian Institute of Science for the sustained support for ecological research.
Conservation and Sustainable Management of Sambhar Lake, a Ramsar Site of International Importance
Ramachandra T.V., Virdi S.S. and
Prasanna B.M.
Energy and Wetlands Research Group,
Centre for Ecological Sciences,
Indian Institute of Science, Bengaluru, Karnataka, India
https://wgbis.ces.iisc.ac.in/energy/
E Mail:
envis.ces@iisc.ac.in , tvr@iisc.ac.in
ABSTRACT
Sambhar Lake is a Ramsar site located in Rajasthan, and is home to rich diversity including numerous migratory birds The current study focusses on the assessment of the existing conditions of the lake and its catchment in the context of natural resources and richness of biodiversity based on field investigations, and literature reviews, pertaining to documentation of geographic and biological characteristics of the wetland, spatial characterisation of the lake and catchment, spatio-temporal analysis of water spread and documentation of biodiversity, including total bird species, IUCN status of visiting birds, historic population patterns, migratory paths, factors affecting bird populations have also been analysed. Further, the study proposes recommendations and suggestions to maintain and improve the ecological health of the wetland and mitigate the potential contemporary as well as future anthropogenic damages.
1.0 INTRODUCTION
Sambhar wetland is located at latitude 26° 58'- 27° 2' N and longitude 74° 54' - 75° 15' E on the east of the Aravalli hills (the Sambhar-Sirohi ranges) in the state of Rajasthan. It is one of the popular Ramsar sites of India, with an area of 23000 ha (230 km2). The lake has a historical and cultural significance, attracting thousands of flamingos, pelicans, and other migratory birds. This ecosystem is an integral flamingo habitat with the greatest number of sightings second only to the Rann of Kutch (Kulshreshtha et al. 2011). As it is the Second most frequented wetland by thousands of migratory birds, especially Lesser and Greater Flamingos, a comprehensive environmental assessment, conservation and management plan is required to take the right steps before implementation of such a large-scale project so that there is zero or minimal environmental harm and degradation.
2.0 STUDY AREA
Sambhar Lake is surrounded by majorly Nagaur, Jaipur districts and borders the Ajmer district. The lake is India's largest inland saline water body (Bohra, 2020) with a catchment area of 4,888 km2 comprising of dry deciduous forests with sparse thorny scrubs typical of arid and semi-arid zones (Kulshreshtha et al. 2011). Commercial activities carried out in the region mainly consist of tourism, salt production and livestock grazing. The lake is a lifeline for the people of Rajasthan and is responsible for 3% of India's salt production (Bhat et. al 2015). The Sambhar Salt Lake became a designated Ramsar Site of international ecological importance on the 23rd of March 1990 (Ref. No. 464 at rsis.ramsar.org). Sambhar region is also internationally identified as an Important Bird Area (IBA) and a Key Biodiversity Area (KBA) (wiienvis.nic.in).


Figure 2.1: Study Area and Figure 2.2:
Conceptual representation of bird
diversity
The lake basin is divided by a 5.16 km long dam made of sandstone. To the east of the dam are salt evaporation ponds of about 80 square km comprising of salt reservoirs, canals and salt pans separated by narrow ridges. Also on the east side, is an 1876 railroad by the British before independence to provide connectivity from Sambhar city to the salt works (Aggarwal, 1951). Based on the season and quantity of water present, the lake occupies an area of 190 - 250 km2. The lake is dynamic, with water depth fluctuating from as few as 60 centimetres (24 in) during the dry season to about 3 meters (10 ft) at the end of the monsoon season. The depth of the lake varies from west to east significantly, and its elevation varies from 359.96 to 364.77 m (1181 to 1196.76 ft) above the mean sea level (MSL). Except for the reservoir and salt pans, the whole lake dries up, exposing salt flakes during summer. The region has 260-300 sunny days. In figure 2.3 given below, blue line denotes the lake boundary, red line marks maximum water spread area, dark blue line marks the dam that segments the lake from kyars and the yellow line marks the road connecting villages Nawa and Khakardi. Most water is collected by Sambhar Lake due to depression in elevation. Total catchment area is 4,888 km2 comprising of dry deciduous forests with sparse thorny scrubs typical of arid and semi-arid zones.

Figure 2.3: Digitized Boundary of
Sambhar Lake using Google Earth and QGIS

Figure 2.4: Catchment of Sambhar Lake
with buffer zone
3.0 RESULTS
3.1 Water Spread Area
For determination of ecologically sensitive regions, maximum water spread area was determined. This was done by spatiotemporal analysis from the year 1984 till 2020. The result shows that maximum water extent observed was 156.77 km2 in the year 1996. It is evident how water level keeps fluctuating as per climatic conditions, especially because Rajasthan is a desert state.
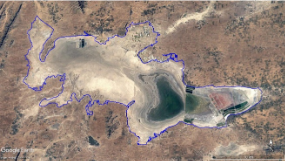
|

|
|
(i) 1984 |
(ii) 1989 |
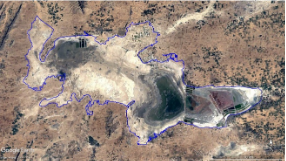
|
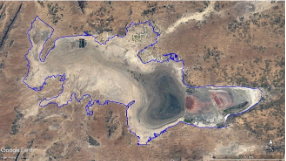
|
|
(iii) 1990 |
(iv) 1991 |
|
|
|
(v) 1992 |
(vi) 1993 |
|
|
|
(vii) 1994 |
(viii) 1995 |
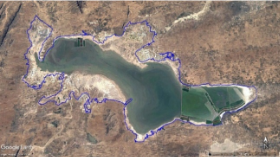
|
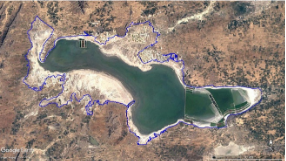
|
|
(ix) 1996 |
(x) 1997 |
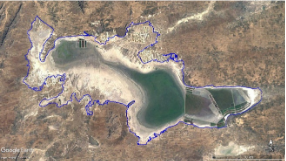
|
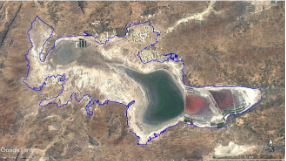
|
|
(xi) 1998 |
(xii) 1999 |
|
|
|
(xiii) 2000 |
(xiv) 2001 |
|
|
|
(xv) 2002 |
(xvi) 2003 |
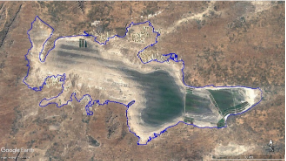
|
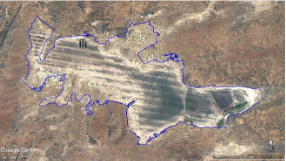
|
|
(xvii) 2004 |
(xviii) 2005 |
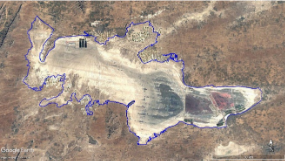
|
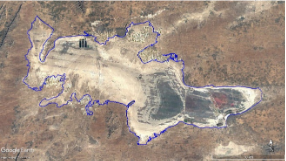
|
|
(ixx) 2006 |
(xx) 2007 |
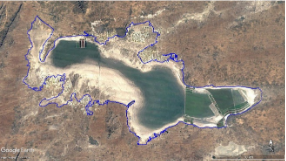
|
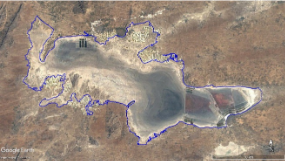
|
|
(xxi) 2008 |
(xxii) 2009 |
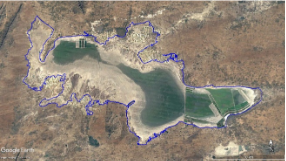
|
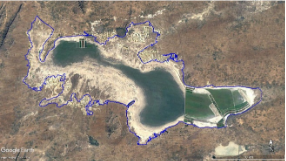
|
|
(xxiii) 2010 |
(xxiv) 2011 |
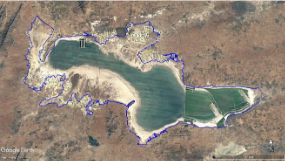
|
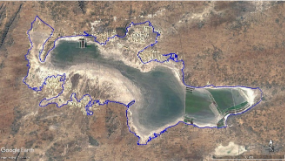
|
|
(xxv) 2012 |
(xxvi) 2013 |
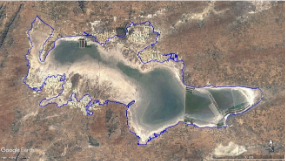
|
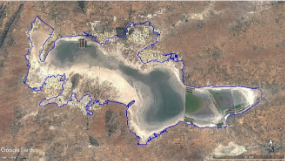
|
|
(xxvii) 2014 |
(xxviii) 2015 |
|
|
|
(xxix) 2016 |
(xxx) 2017 |
|
|
|
(xxxi) 2018 |
(xxxii) 2019 |

|
|
|
(xxxiii) 2020 |
|
Figure 3.1: Spatiotemporal Analysis 1984 - 2020
3.2 Avifaunal Biodiversity
Sambhar habitat actively supports a total of 137 bird species. Out of which 2 are endangered (EN), 3 vulnerable species (VU), 13 near threatened (NT) and 119 least concern (LC) species according to the IUCN red list. The populations are in the tens of thousands, certainly implying multiple beneficial factors of the Sambhar ecosystem such as (Kulshreshtha 2011):
- Highly saline water with unique microbial diversity
- Vast expanse and secure environment
- Availability of abundant food stock
- Opportunity for breeding and wintering
- Rest stop before migration to other parts of India
Table 3.2 containing list of all avian fauna that has been recorded in the Sambhar Wetland with scientific name, common name, habitat, rarity, resident/migrant and IUCN status has been attached in the annexure.

Figure 3.2.1: Avian migratory path -
International
Sambhar supports a large number of migratory avifauna. Migratory birds usually migrate from Central Asia, Africa, Siberia, parts of Russia, Iran and parts of Europe as well as per some of the banding studies.

Figure 3.2.2: Avian migratory path -
National
After wintering at Sambhar, they then disperse across the country, especially towards southern region. Some wetlands that attract these birds, especially flamingos include Rann of Kutch, Keoladeo National Park, Mumbai, Chillika Lake, Thrissur and Pulicat Lake.


Figure 3.2.3: District wise terrain
patterns of lesser and greater flamingos

Figure 3.2.4: Avian migratory path
– Intrastate
Based on some records available, the Greater Flamingos arrive at Sambhar first. Then move to various locations like Anasagar lake, Jawai dam, Alaniya Dam, Chandlai Lake, Chambal region and Keoladeo National Park. The Lesser Flamingo on the other hand do not move much within Rajasthan. They have only been spotted in Chambal region other than Sambhar Lake. Flamingo populations keep fluctuating every year. Generally, because of rainfall patterns, water and food availability, water conditions etc.

Occurrence of 244 species of orders Raptores, Incessores, Gemitores, Rasores, Grallatores, Natatores. Sides of open wells are densely clothed with a species of willow, tiger and sarpat grass and are the favourite haunts of numerous birds. Dense masses of flamingos are to be seen everywhere swimming or wading in the lake-bed, flying overhead, bearing "The rich hues of all glorious things." or stalking sedately along the edge in search of food. Long lines of big and little birds, of all shades of plumage, from the gorgeous rose-coloured adult to the dingy brown-and-white young, march along, and invariably here from west to east, all wagging their down-bent heads in search of the animalcules with which the brackish water abounds. Records of poaching of avian species. When animalcules disappear, many of the swimmers and waders go off or frequent. (Adam 1873).
Number of species observed amount to 252. (Ten additions). Large flocks reached from a westerly direction during the month of September. Prefer working for food along the exposed portions of the low mud walls which separate the salt pans from lake water. Flocks congregate in places covered with a slushy slime-like soil which is very difficult to walk in - on the surface of which existed a quantity of dark greenish microscopic vegetable matter. On which the birds seemed to feed eagerly. Flocks of over five hundred birds closely packed together were spotted. (Adam 1874). About the region in general, if there ever was an unpromising field for an ornithologist it was here; and yet only were a good many species to be found, but two or three of these, species of some interest. (Hume 1878). Opening of sluice gates to drain the water to salt pans has dried up the lake suddenly on many occasions. Such situations like the drying up of majority of the lake bed have forced the birds to abandon the lake in mass. More than 20,000 birds were present in September 2001 however after the release of water by Sambhar Salts, author found only 200 Greater Flamingos left. The chemistry of the lake and its variations need to be studies. On 4th December 1994, 8,500 Lesser Flamingos were seen on the lake, but no Greater Flamingos. Similarly, on 31st January 1995 there were 5,000 Lesser Flamingos but Greater Flamingos and other species were missing, probably due to high level of salinity.
Table 3.2.2: Historical review of avian populations at Sambhar
|
Year |
Number of avifauna reported |
Reference |
|
1873 |
244 species |
Adam 1873 |
|
1874 |
252 species |
Adam 1874 |
|
1878 |
25,000 flamingos |
Hume 1878 |
|
1939 |
Arrival of flamingos |
MacCann 1939 |
|
1951 |
5000-8000 flamingos |
Agrawal 1951 |
|
1968 |
Arrival of flamingos |
Mukherjee 1968 |
|
1969 |
Arrival of flamingos |
Roonwal 1969 |
|
1981 |
5000 flamingos |
Alam 1981 |
|
1984 |
6000-8000 flamingos |
Gole 1984 |
|
1988 |
No arrival of flamingos (Drought year with severe water scarcity) |
Kulshreshtha 2011 |
|
1994 |
5000-8500 flamingos; 8500 flamingos |
Gopal & Sharma 1994, Sangha 2009 |
|
1995 |
5000 flamingos, no other species |
Sangha 2009 |
|
1997 |
8 species and 1500 – 2000 flamingos |
Rahmani 1997 |
|
1998 |
22,500 flamingos |
Sangha 1998 |
|
2000 |
No arrival of flamingos (Drought year with severe water scarcity) |
Kulshreshtha 2011 |
|
2001 |
15,000 flamingos |
Sangha 2009 |
|
2005 |
71 species & 50,000 – 100,000 flamingos |
Kumar 2005 |
|
2006 |
600-700 flamingos |
Kulshreshtha 2011 |
|
2008 |
98 species & 3,000 flamingos |
Kulshreshtha 2011 |
|
2009 |
83 species |
Sangha 2009 |
|
2010 |
52 terrestrial & 46 aquatic birds |
Kulshreshtha 2011 |
4.0 RECOMMENDATIONS AND CONCLUSIONS
Lake Fragmentation
To ensure the sustained water flow into the lake:
- Removal of blockages and the encroachments including enhancing water storage capacity removal of fragmentation of lake and ensuring the continuity of water spread area in the lake.
- Restriction of unauthorized extraction of brine in the lake bed as well as buffer zones.
- Removal of unauthorized salt pans in the lake bed and in the buffer zone.
- Maintaining the integrity of the buffer zone (200m) with no permanent structures, as buffer zones are flood plains and aid as water sink sponge.
- Enhancing the green cover in the catchment area by planting native species.
- Providing green barricade in NW portion (Nawa, Nagaur, Ulana, Kansera and Mohanpura) with native tree species would help in mitigating dust deposition or soil erosion.
The fragmentation of the lake has to be removed to maintain the integrity of the wetland with the continuity in water spread area may be planned and implemented to connect the villages for mobility of people. Immediate removal of the 12.4 km road from Nawa to Khakardi village is necessary, because of the road, multiple anthropogenic activities are increasing and promoted such as poaching and irresponsible tourism. This road divides the lake bed into to two unequal parts which has affected the movement of migratory birds and reduced the overall condition of the Ramsar Site (Z.S.I 2005).


Figure 4.1: Photographs of the road
dividing the lake
Removal of salt pans
T Removal of encroached areas with
appropriate compensations for the
individuals running the salt pans
privately is required to sustain water
in the lake. Restriction of unauthorized
extraction of brine in the lake bed as
well as buffer zones. Removal of
unauthorized salt pans in the lake bed
and in the buffer zone.
Desilting
The silt accumulated in the lake amounts
to 18.6 million cubic meters (49.29
million tons), The silt has to be
removed immediately to improve the
functional capability of the wetland.
Removal will not only improve the water
storage capacity but also improves the
habitat condition of aquatic fauna.
Desilting will also provide opportunity
for youth and also the silt could be
used for beneficial purposes such as the
compressed mud blocks for buildings, and
also to improve the soil condition in
agriculture and horticulture fields.
Constructed Wetland
Suggestion is to implement economical
and optimal option through Constructed
Wetland at City Bittern Area (which has
many inlets of untreated sewage) treated
waste water would help in sustaining the
water in the lake and also for regular
cleaning of panels (to remove the dust).
Technical drawings for the constructed
wetland have been attached in the
annexure.
Eco-sensitive Zone Restrictions
Restriction of developmental activities in eco-sensitive areas including breeding and roosting locations. Transmission towers and distribution network to be planned in such a way that it is not located in the path of the bird movement or closer to the habitat of birds. During the visiting period of migrants, authorities have to ensure adequate quantity of water in the reservoir. As drying up of the lake has affected the avifauna visiting pattern which has been reported earlier.

Figure 4.2: Avifauna and mammal movement
paths and habitat hotspots

Figure 4.3: Map of restricted region
(developmental activities not
permitted)
Conclusion
No development should be undertaken in the area demarcated in figure above (4.3). Factors that are adversely affecting the environmental conditions of the lake should be immediately mitigated or removed. Steps should be taken to improve the health of the Sambhar ecosystem. Negligent attitude towards conservation should be avoided and a proactive approach should be adopted.
Decentralized Solar power generation: Challenges and opportunities
T V Ramachandra a, b, c and B
M Prasanna a
a - Energy
& Wetlands Research Group, Centre
for Ecological Sciences [CES],
http://wgbis.ces.iisc.ac.in/energy
b - Centre for Sustainable
Technologies (astra)
c - Centre for
infrastructure, Sustainable
Transportation and Urban Planning
[CiSTUP], Indian Institute of
Science, Bangalore, Karnataka, 560 012,
India
Abstract:
Electricity generation through harvesting solar energy is gaining significance in the tropical regions because of its decentralized nature and abundant availability of sunlight. Economically efficient, environmentally friendly solar energy harnessing through photovoltaic cells is dominant among all other technologies and also takes a major portion in large-scale deployment of solar power plants. Although solar power plants are beneficial in achieving the Net zero carbon emission goal of the country and are still encounter many challenges. Assessment of the potential of solar insolation, climate regime, photovoltaic power generation potential, and environmental implications are essential for setting up a power plant. The current study focuses on the estimation of the solar potential, and the possible temperature variation with installed PV panels also depicts the area identification for the deployment of large-scale solar plants considering the ecology and biodiversity of the region.
Keywords: Large
scale PV power plant, solar potential,
LST, Air Temperature
Introduction:
The Sun is the prime source of energy, and has been revered as a life-giver to our planet since ancient times. Most of the energy on the Earth is derived from Sun as known as heliocentric. In India, major share of the installed power generation capacity is from fossil fuels i.e. 57.9% (Figure 1) as of 2019. (mnre.gov.in). Also Power generation in India from renewable energy sources have increased from 6 GWh in 2002 to 1,38,337 GWh in 2020 (Figure 2).
Imminent climatic changes and the demand for clean energy sources have induced significant global interest in solar energy. Solar energy has the potential to provide solutions to the longstanding energy problems being faced by developing countries like India. Solar energy can be an important part of India’s plan not only to add new capacity but also to increase energy security, address environmental concerns, and lead the massive market for renewable energy. Solar is emerging as viable alternative for power generation among the available clean energy sources has the highest global warming mitigation potential. Deployment of large-scale Solar power plants are increased in the world as well as in India. India is one of the best recipients of solar energy due to its favorable location in the solar belt (40◦S to 40◦N).
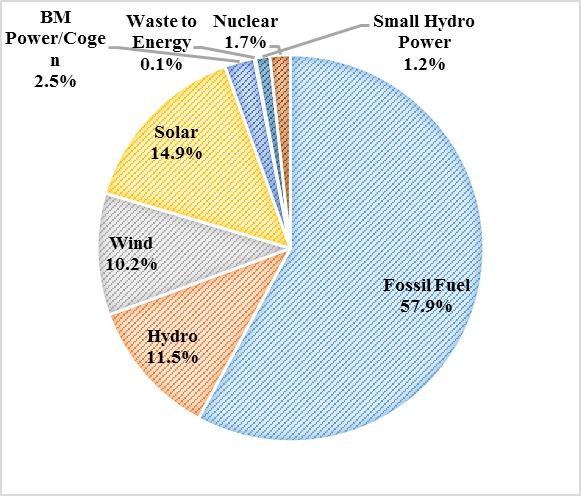
Figure 1. Share of different sources in
installed power generation capacity in
India.

Figure 2. Growth of power
Generation from renewable energy in
India.
As India’s green energy sector prepares to leap forward, it is worth examining the landscape and charting out the path ahead. Reforms in this sector have been ongoing for over a decade and the total installed capacity from renewable sources has doubled in the last five years, touching the 100 GW mark this August. While this is surely a noteworthy improvement, India continues to depend on oil and gas imports. So, on this Independence Day, in alignment with SDG Goal 7 – “Ensure access to affordable, reliable, sustainable and modern energy for all”, the Prime Minister took a pledge to make India energy-independent by 2047. This requires challenging the status quo of policy implementation and starting with the grassroots, instead of highly developed regions. In solar power, although capacity has increased by more than 11 times in the last five years from 2.6 GW in March 2014 to 28.18 GW in March 2019 (which includes a total of 28,180.68 MWp grid connected and 212.05 MWp off grid Solar Power Plants (2018-2019)), a target of installing 100 GW of grid connected solar power by 2022 has been kept. The country’s vision is to achieve Net Zero Emissions by 2070, in addition to attaining the short-term targets which include:
- Increasing renewables capacity to 500 GW by 2030,
- Meeting 50% of energy requirements from renewables,
- Reducing cumulative emissions by one billion tonnes by 2030, and
- Reducing emissions intensity of India’s gross domestic product (GDP) by 45% by 2030
India is endowed with vast solar energy potential. About 5,000 trillion kWh per year energy is incident over India's land area with most parts receiving 4-7 kWh per sq. m per day. Solar photovoltaic power can effectively be harnessed providing huge scalability in India. Solar also provides the ability to generate power on a distributed basis and enables rapid capacity addition with short lead times. Off-grid decentralized and low-temperature applications will be advantageous from a rural application perspective and meeting other energy needs for power, heating and cooling in both rural and urban areas. From an energy security perspective, solar is the most secure of all sources, since it is abundantly available. Theoretically, a small fraction of the total incident solar energy (if captured effectively) can meet the entire country's power requirements. solar energy sector in India has emerged as a significant player in the grid connected power generation capacity over the years. It supports the government agenda of sustainable growth, while, emerging as an integral part of the solution to meet the nation’s energy needs and an essential player for energy security. (mnre.gov.in/solar/current-status)
Materials and Method
Study Area

Figure 3. India with the federal
state boundaries and agro-climatic
zones.
In India there are 28 states and 8 Union territories in the country (knowindia.india.gov.in). India falls under 15 different agro-climatic zones including Island regions as represented in the Figure 3. Whole land footprint of India is considered for the calculation of the Solar insolation potential and Solar PV potential.
For assessment of environmental implication of the solar power generation, two major PV solar power plants of India, based on their power producing capacity, spatial extent, and climatic zones commissioned before 2018 and 2019 chosen, include (i) Bhadla solar Power Plant in Rajasthan and (ii) Pavagada solar PV plant of Karnataka. Study is based on the comparative analysis of both Land surface temperature and Air temperature at PV plant locations and surrounding regions before and after the installation of a solar PV power plant.
Bhadla Solar Park
The Bhadla Solar Park, is the largest solar power plant in the world, total capacity of the solar park is 2245MW (https://energy.rajasthan.gov.in) is located in a semiarid to the arid region at Bhadla village, Jodhpur district of Rajasthan (27°28'37.00"N and 71°57'42.53"E) in uncultivated land with a land footprint of 5700 ha, and an elevation ranging between 168 to 185 m above mean sea level (figure 4). The installation was completed in 2018. Some portion of land was under seasonal cultivation of castor oil seed, Gawar, and Bajara, and agriculture in the area is purely dependent on rainfalls or bore pumps.
Pavagada Solar Park
Pavagada Solar Park (Photovoltaic) a capacity of 2,050 MW was completed in 2019, in the eastern dry agro climatic zone at Tumkur district (14°16'18.06"N latitude 77°24'24.89"E longitude) with an elevation ranging between 450 to 840 m above msl in the plains; and hilly areas ranging between 840 to 1500m above msl (https://cdkn.org). It covers an area of 5300 ha (~13000 acres) across five villages (figure 4), namely, Balasamudra, Tirumani, Kyataganacharlu, Yallur and Rayacharlu of Pavagada Taluk, Tumukur District of Karnataka (https://kspdcl.karnataka.gov.in). As of April 2021, it is the World's third largest photovoltaic solar park after the 2,245 MW Bhadla Solar Park in Rajasthan and the 2,200 MW Huanghe Hydropower Hainan Solar Park in China.


Figure 4. Location of Bhadla and
Pavagada Solar Park
Method

Solar Insolation potential and solar PV potential too understand the opportunities of the decentralized solar power generation in India , which helps in prioritizing solar energy harvestable regions in India. The environmental implication of plants is the variation in the local temperature . In this regard, assessment is done at locations where large-scale solar power plants are operational considering land surface temperature and 2 m Air temperature. as well as the solar insolation potential, solar PV potential, ecology and biodiversity of the region, and legal compliances
The potential of the region for solar power plant is assessed through the quantum of solar radiation (electromagnetic energy) with duration of the sunshine hour, and temperature. If solar energy can be harnessed to its potential, humans will have a permanent and unlimited supply of free and clean energy, withminimum or no long-term environmental impact (Phillips, 2013). Solar insolation is the amount of solar energy that strikes a square meter of the earth’s surface in a single day. Solar insolation mapping has been done to identify the potential of solar energy .
The photovoltaic (PV) potential represents the expected lifetime average electricity production (in kWh) from a kW-peak grid-connected solar photovoltaic (PV) power plant. PVOUT map provides a summary of estimated solar photovoltaic (PV) power generation potential (https://solargis.com).
Solar insolation Potential (Ramachandra et al. 2011)
For assessment of solar insolation potential, the NASA SSE monthly average Global insolation data is collected for more than 900 grids which optimally cover the entire topography of India within the latitudes 8 - 380 N and longitudes 68 - 980 E. These datasets are derived from a physical model based on the radiative transfer in the atmosphere along with parameterization of its absorption and scattering properties. Visible and infrared radiation, inferred cloud and surface properties, temperature, perceptible water, column ozone amounts, and atmospheric variables such as temperature and pressure measured using diverse satellite instruments are the primary inputs to this model. The longwave and shortwave solar radiations reflected to the satellite sensors along with the collected primary inputs are studied to obtain the global insolation for different locations and durations. The global insolation datasets have a spatial resolution of 1º × 1º. After extraction of the data geo-statistical bilinear interpolation is employed to produce monthly average Global insolation maps for the country detailed with isohels (defined as lines/contours of equal solar radiation) using Geographical Information Systems (GIS). Regions receiving favorable annual global insolation for electricity generation with technologies like SPV and CSP and the prospects for successful solar devices dissemination are demarcated as solar hotspots.
Photovoltaic Power Potential (PVOUT)
The photovoltaic (PV) potential data are available in the global solar atlas where the calculation is done through Solargis, whichprovides the PV modelling software and high-resolution solar resource data for solar electricity calculation. The calculation takes into account solar radiation, air temperature, and terrain, to simulate the energy conversion and losses in the PV modules and other components of a PV power plant. In the simulation, losses due to dirt and soiling were estimated to be 3.5%. The cumulative effect of other conversion losses (inter-row shading, mismatch, inverters, cables, transformer, etc.) is assumed to be 7.5%. The power plant availability is considered to be 100%. PV system configuration consists of ground-based, free-standing structures with crystalline-silicon PV modules mounted at a fixed position, with optimum tilt to maximize yearly energy yield. Use of high-efficiency inverters is assumed for the calculation (https://solargis.com/maps-and-gis-data/tech-specs). Complete description of the modeling approach and related uncertainties is available in Solargis (https://solargis.com).
For the current study the GIS data of PVOUT extracted from the Global solar atlas for India and having the special resolution of 1Km. Annually and Monthly averaged Daily Total Photovoltaic Power Potential (PVOUT) of India with the highlighted Rajasthan boundary maps are produced with the help of Quantum Geographical Information Systems (QGIS).

Land surface Temperature
Data from space-borne remote sensors (RS) (Landsat series satellites) are widely used for environmental studies. TIR region corresponding to 8–14 µm in the electromagnetic spectrum is used for quantifying the thermal urban environment (Ramachandra et.al 2018). LST from thermal data have been derived considering the emissivity and atmospheric effects (Sekertekin and Bonafoni 2020). Algorithms consider the number of TIR bands used as (i) single-channel or mono-window algorithms use one TIR band, (ii) split window or multi-channel methods include more than one TIR band (Sekertekin and Bonafoni 2020).
LST of the two different environments of arid/semi-arid region (Bhadhla, Rajasthan) and central dry zone (Pavagada, Karnataka) where the solar PV power plants are already installed, were computed from the Landsat 8 OLI/TIR satellite, in Google Earth Engine (GEE). Landsat 8 Operation Land Imager (OLI) sensor with nine bands (band 1 to 9) and Thermal Infrared sensor (TIR) with two bands (band 10 and 11). LST of a region is computed as follows:
TOA Brightness Temperature
The atmosphere (TOA) radiance is the net radiance of the emitted radiance from the earth’s surface upwelling radiance from the atmosphere, and down welling radiance from the sky and acquired in remote sensors in the thermal infrared (TIR) region. The value of Top of Atmospheric (TOA) spectral radiance (Lλ) in watts/ (m2 srad µm) is determined by multiplying the multiplicative rescaling factor (OLI ML=0.000342) of TIR bands of with its corresponding TIR band (Qcal = band 10) and adding Band specific additive rescaling factor (OLI AL = 0.1). λ represent the wavelength of the thermal band. (Ramachandra et.al 2018 and Jeevalakshmi, Narayana Reddy., Manikiam 2017). Computation of the emissivity corrected land surface temperature(Ts) involves computation of Lλ, T B, NDVI as follows (equations 1 to 5):
L λ is computed by equation 1.
Lλ = M L * Q cal + A L ………. (Eq.1)
The radiance to equivalent brightness temperature at the satellite using equation 2
………. (Eq.2)
where, TB represents the At-satellite brightness temperature, K1 and K2 (kelvin) represents the pre-launch calibration coefficients. Whose value is K1 = 774.8853, K2 = 1321.0789 (for OLI band 10), Lλ is the TOA spectral radiance.
Normalized Difference Vegetation Index (NDVI)
Computation of Normalized Difference Vegetation Index (NDVI) helps in mapping regions with vegetation and non-vegetation. NDVI is calculated on the per-pixel basis as the normalized difference between the near-infrared band (0.85-0.88µm) and red band (0.64 - 0.67µm) using equation 3.
………. (Eq.3)
Where NIR is the near-infrared band (B5) value of a pixel and RED is the red band (B4) value of the same pixel. NDVI ranges between -1 to +1. very low values of NDVI (-0.1 and below) correspond to soil or barren areas of rock, sand, or urban built-up. Zero indicates water cover. Moderate values (0.1 to 0.3) represent low-density vegetation, while high values (0.6 to 0.8) indicate thick canopied vegetation (Ramachandra et.al 2018). NDVI is used to calculate proportional vegetation (Pv) and emissivity (ԑ).
Land Surface Emissivity(ԑ)
Emissivity is a critical variable for the LST estimation, as a small uncertainty in the emissivity (1%) can lead to large errors in the LST (up to 1K) depending on the setting of the sensor, the climatological conditions and geographical setting of the area (Mitraka et al. 2012, Chen et al. 2016, Parastatidis D et al.). In the current study NDVI-based emissivity is estimated from Landsat red and near-infrared data.
………. (Eq.4) (Dissanayake, et al. 2019, Sobrino et al. (2004))
where m represents (εv – εs) − (1 − εs) Fεv; n represents εs + (1 − εs) Fεv; εs is soil emissivity; εv is vegetation emissivity; and F is a shape factor whose mean value, assuming different geometrical distributions, is 0.55 (Dissanayake, et al. 2019, Sobrino et al. (2004)). Value of m is considered as 0.004 and n as 0.986 based on previous results (Sobrino et al. (2004)), the Pv is the proportional vegetation and it is calculated from the Eq.5
………. (Eq.5) (Dissanayake, et al. 2019, Sobrino et al. 2004)
Land Surface Temperature(Ts)
The emissivity corrected land surface temperature(Ts) is computed as per equation 5 (Ramachandra et.al 2018)
………. (Eq.5)
where, is the wavelength of emitted radiance for which the peak response and the average of the limiting wavelengths ( =10.895µm) were used, ρ is h × c/σ (1.438 × 10⁻² m K) with σ being the Boltzmann constant (1.38 × 10⁻²³ J/K), h is Planck’s constant (6.626 × 10⁻³⁴ Js), and c is the speed of light (2.998 × 10⁸ m/s); TB is satellite brightness temperature and ε is land-surface emissivity estimated using Eq.2 and Eq.4 respectively. Then, calculated LST values (Kelvin) were converted to degrees Celsius (◦C). Finally, LST data is further analyzed and represented spatially with the help of QGIS.
Air Temperature
Data under the topics like atmosphere, Biosphere, cryosphere, land surface, ocean, Earth, etc. are available for open access from NASA's Earth Observing System (https://www.earthdata.nasa.gov). Earth Observation Data and Information System (EOSDIS) provides end-to-end capabilities for archiving and distributing Earth science data from multiple missions since 1994 to users.
Daily maximum 2-meter air temperature data is available in the GIOVANNI, an online (Web) environment for the display and analysis of geophysical parameters in which the provenance (data lineage) can easily be accessed (https://giovanni.gsfc.nasa.gov). Air temperature data have a spatial resolution 0.5o * 0.625o and a temporal resolution of 1 day. M2SDNXSLV, a 2-dimensional daily data collection in Modern-Era Retrospective analysis for Research and Applications version 2 (MERRA-2), consists of daily statistics, such as daily maximum (or daily minimum and mean) air temperature at 2-meter. MERRA-2 is the latest version of global atmospheric reanalysis for the satellite era produced by NASA Global Modeling and Assimilation Office (GMAO) using the Goddard Earth Observing System Model (GEOS) version 5.12.4. The dataset covers the period of 1980-present with a latency of ~3 weeks after the end of a month (https://gmao.gsfc.nasa.gov).
Data for Bhadla and Pavagada locations corresponding to the pre-installation period (2015 to 2018 and 2017 to 2019) and post-installation (2019 to 2022 and 2020 to 2022) are considered for analyses. 2-m daily maximum Air temperature data of the peak summer months for Bhadla (April, May, and June months) and for the Pavagada (March, April, and May months) are downloaded from the GIOVANNI. The maximum temperature of each month is considered for the analysis of annual variation. Graphical representation and statistical analysis of Grid wise data were done . Air temperature data is presented spatially with the help of QGIS.

Fig 1. Method adopted for assessing LST
Result
Solar insolation Potential
The study on Hotspots of solar potential in India using high resolution satellite data and techno-economic feasibility assessment demonstrated that Rajasthan also one of Hotspot of solar potential (Ramachandra et al. 2011).
Fig.2 illustrates that the Gangetic plains (Trans, Middle and Upper) Plateau (Central, Western and Southern) region, Western dry region, Gujarat Plains and hill region as well as the West Coast plains and Ghat region receive annual Global insolation above 5kWh/m2/day. These zones include major federal states of Karnataka, Gujarat, Andhra Pradesh, Maharashtra, Madhya Pradesh, Rajasthan, Tamil Nadu, Haryana, Punjab, Kerala, Bihar, Uttar Pradesh and Chattisgarh. The Eastern part of Ladakh region (Jammu & Kashmir) and minor parts of Himachal Pradesh, Uttarakand and Sikkim which are located in the Himalayan belt also receive similar average Global insolation annually. Regions receiving Global insolation of 5 kWh/m2/day and above can generate at least 77 W/m2 (actual on-site output) at 16% efficiency.

Fig.2. Annual average
Global insolation map of India showing
the isohels and solar hotspots.
Photovoltaic Power Potential (PVOUT) of India
Annually averaged daily total of PVOUT (Fig.3.) across the different regions of India varies from 2.031 to 5.925 kWh/kWp, Rajasthan shows the 4.16 to 5.04 kWh/kWp PVOUT potential variation across the state. Fig.4.1 and 4.2 illustrates good PVOUT potential of above 3 kWh/kWp, where in the July month it is low (2.59-4.25kWh/kWp) and high(5.03-6.08kWh/kWp) in the month of March in Rajasthan. PVOUT power generation capacity would enhance considerably with the improvement in efficiency of Solar PV technology.
India has the potential of daily solar radiation incidence varying from 4.5 to 6.0 kWh/m2/day in different parts of the country. Total solar radiation at Sambhar is 2080 kWh/m2/year, translating to 5.70 kWh/m2/day (Solar energy corporation of India, ‘Prefeasibility Report for setting up of Ultra megawatt solar PV power plant at surplus salt pan lands at sambhar Rajasthan’ 2013).

Figure: 4.1. Annual average daily
total PVOUT
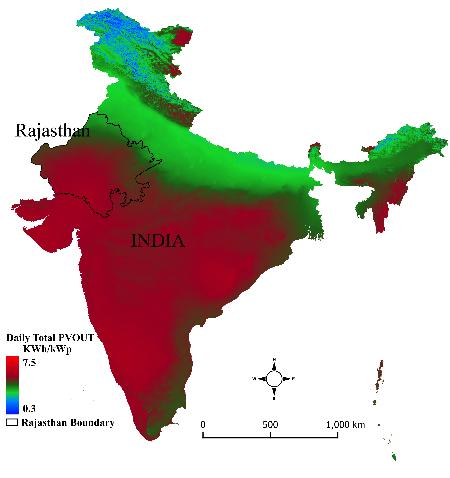 January |
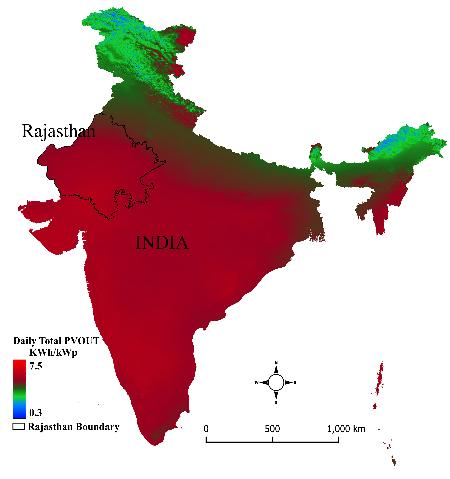 Febuary |
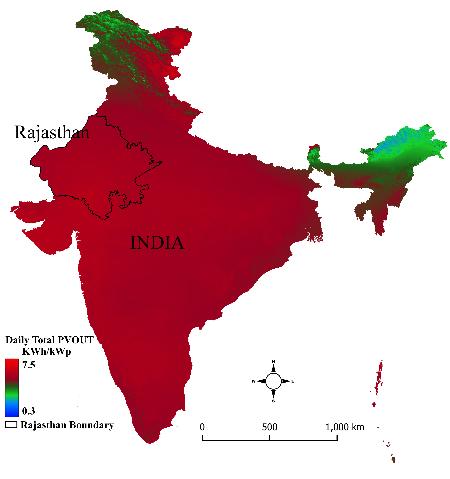 March |
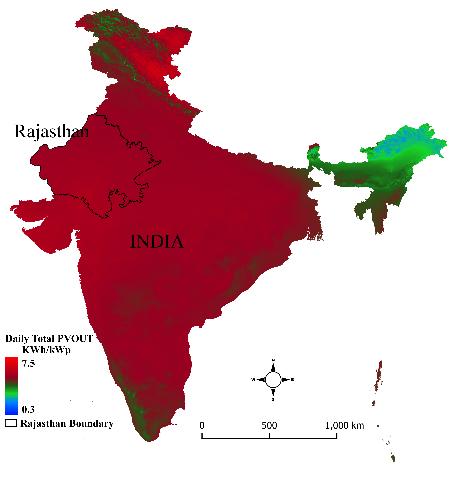 April |
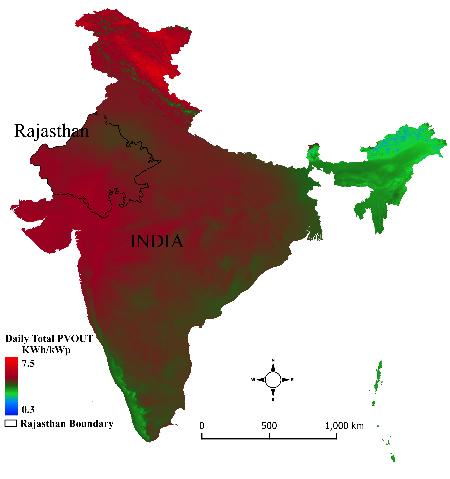 May |
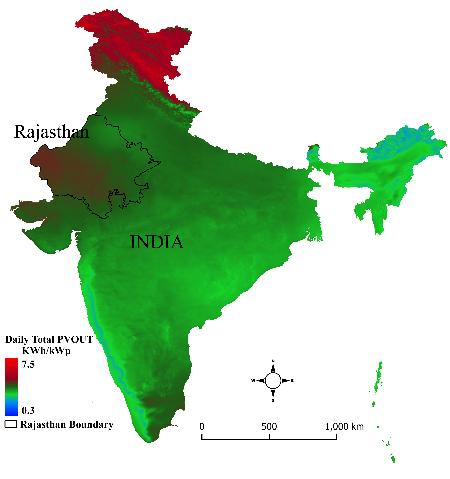 June |
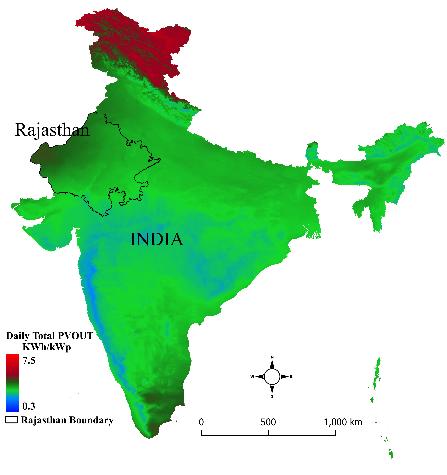 July |
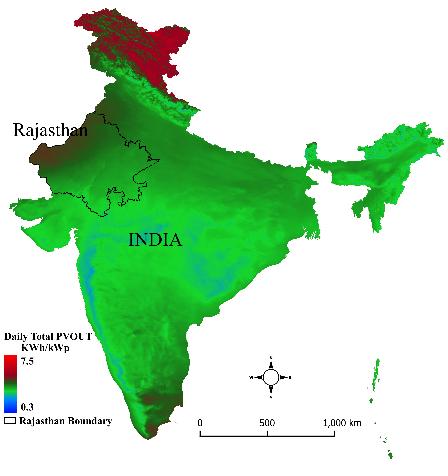 August |
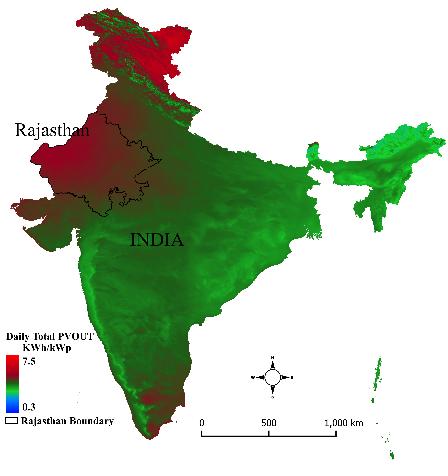 September |
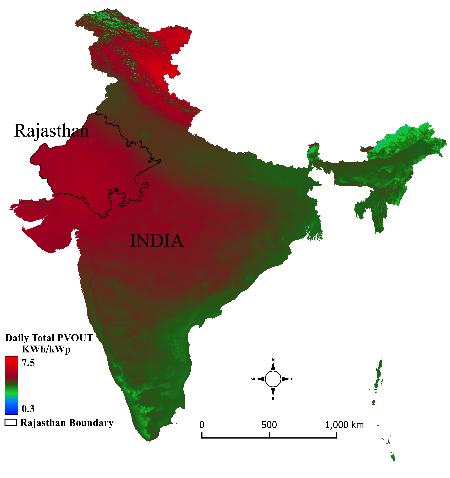 October |
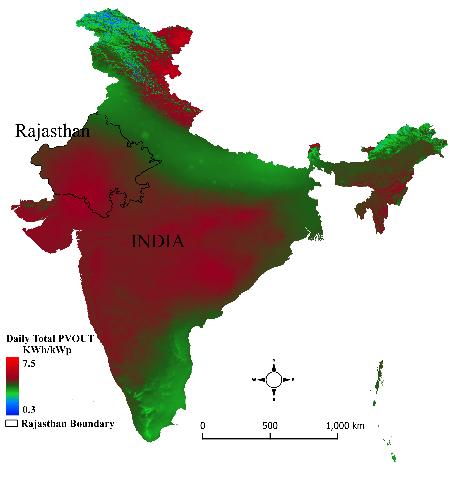 November |
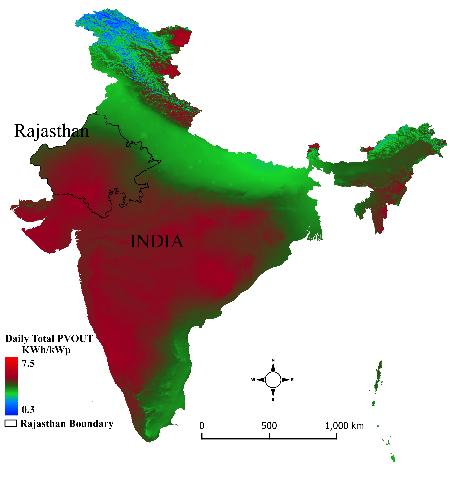 December |
Figure 4.2. Monthly Averaged Daily Total Photovoltaic Power Potential (PVOUT) of India
Land Surface Temperature
Temporal pattern of the Land surface temperature of the study region (land print of PV power plant and landprint of PV power plant along with 5 km buffer) is assessed through the remotely sensed Landasat-8 sensor remote sensing data. Figure 5.1 and 5.2 illustrates the temporal LST in (i) Bhadhla (Rajasthan) PV Solar Power Plant with 5 km buffer and (ii) Pavagada (Karnataka) PV Solar Park with 5 km buffer. Table 2 lists average LST before and after the installation of PV solar plant.
The installation of Bhadla solar plant was completed in 2018. The year wise LST analysis of Bhadla solar park from 2015 to 2021 was done to understand the potential changes in land surface temperature after installation of PV panels. In 2016 Average LST was observed very high (54.24°C). Variability in LST before 3(2016-2018) and after 3 (2019-2021) years of PV installation was assessed statistically (F- test), which indicate there is no significant(P<0.05) variation in the LST during the chosen study periods. The temporal analyses of LST, highlights that the temperature has declined during the post 2019 (post installation of PV) suggesting cooling effect with a difference of ~2°C (2021), ~1.3°C (2019)) and ~0.5°C (2020) (Fig.5.1 and 5.3).
The Pavagada solar park was commissioned in 2019. The temporal assessment LST from the period before (2019) and after (2019 onwards) installation of PV does not show any significant variations, which is evident from statistical test (F-test, p<0.05). The average LST in 2015 are 39.42°C in PV, and 38.40°C in buffer, which has increased in 2019 to 45.2°C in PV region, 44.81°C in the buffer region and in 2021, LST are 39.72°C in PV and 40.47°C in the buffer region which highlights of decrease in LST (after installing PV) compared to 2019 in the PV region, and also in the buffer region (Figure 5.2 and 5.4). Comparison of the LST of the PV region with its surrounding (5 km Buffer) after installation of PV shows a significant cool island effect (p<0.05) PV region has a maximum LST of 45.56°C (2020), and 41.06°C (2021), which is lower than the surrounding(5 km) maximum land surface temperature of 48.67°C (2020), and 43.48°C (2021). LST in the panel deployed region is ~3°C lower than the buffer region (5 km surrounding PV region).
Assessment of LST at both locations with large-scale PV plants, highlights of land surface cooling effect, which are in conformity with the earlier studies (Zhang, Xu, 2020 and Guoqing, Hernandez, Blackburn et al. 2021). Also, statistical analyses of LST of two time periods (pre and post installation) at both study regions indicate that there are no significant temporal variations (p < 0.05) in the LST.
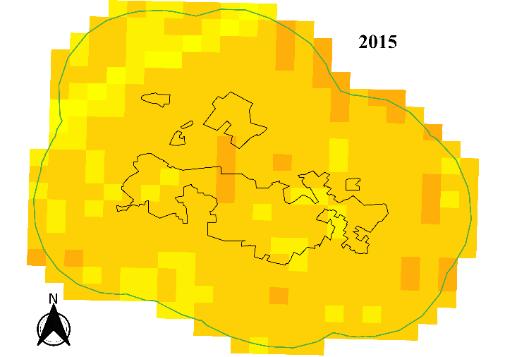 |
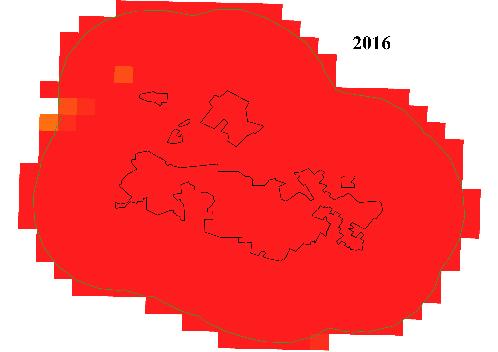 |
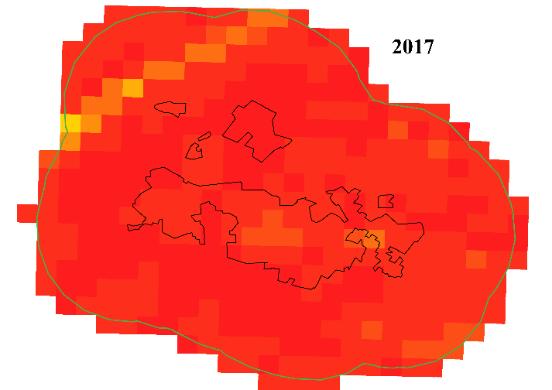 |
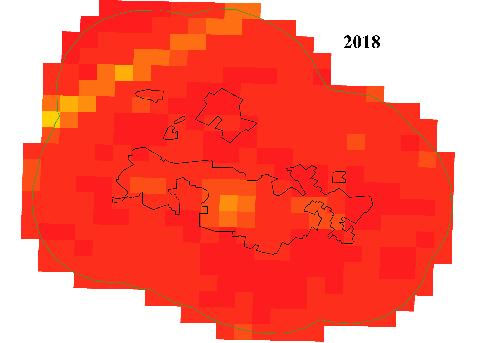 |
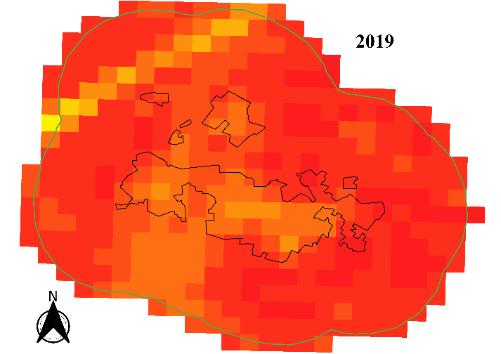 |
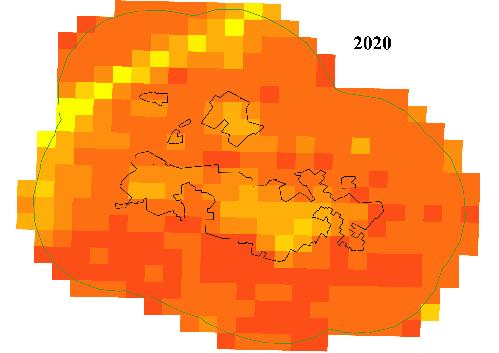 |
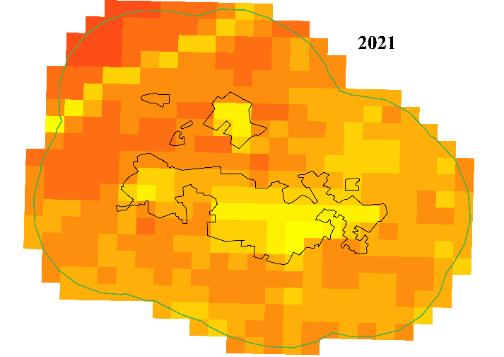 |

 |
|
Figure 5.1. Land Surface Temperature of Bhadhla (Rajasthan) PV Solar Power Plant
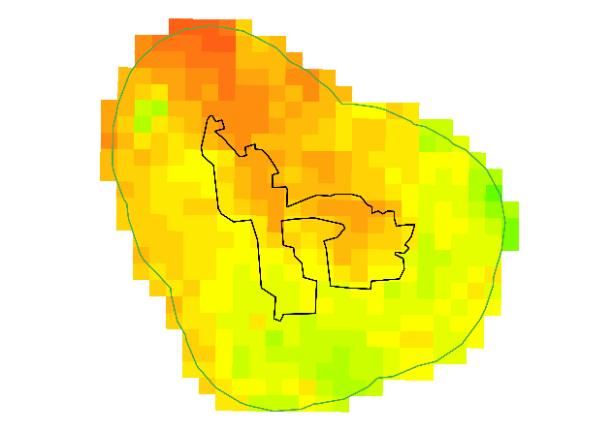 |
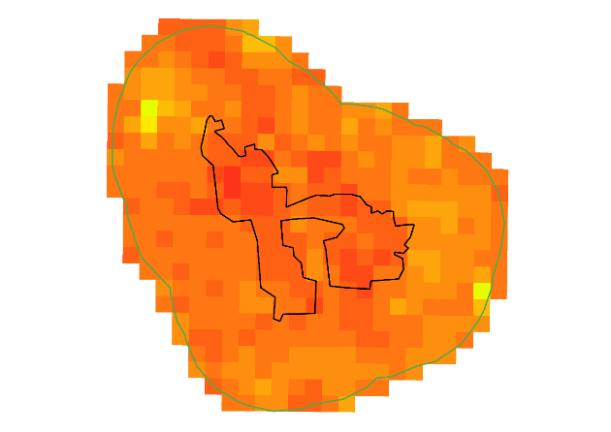 |
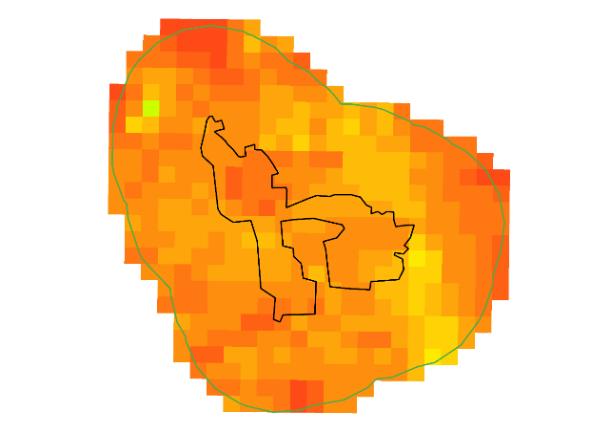 |
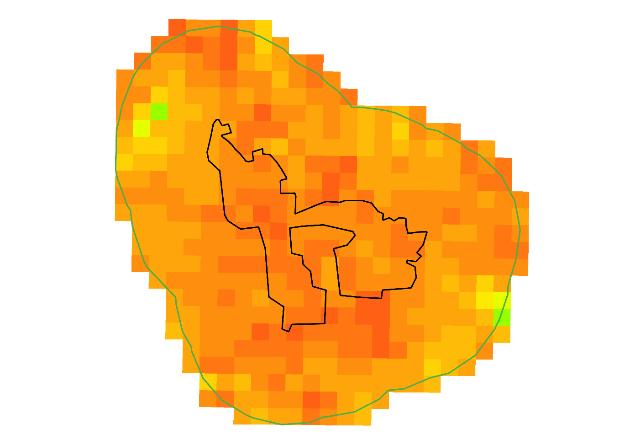 |
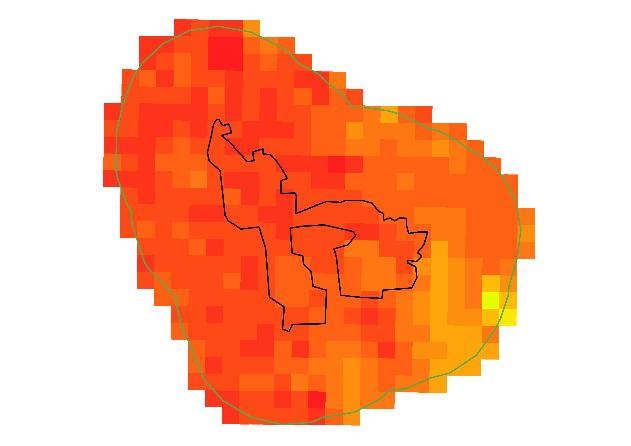 |
 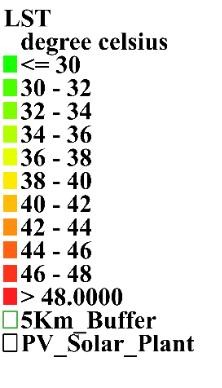 |
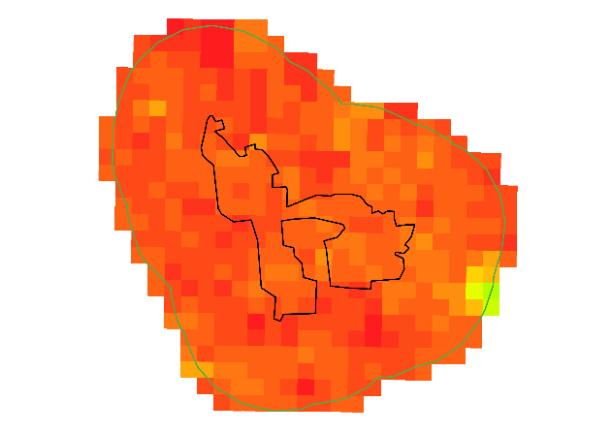 |
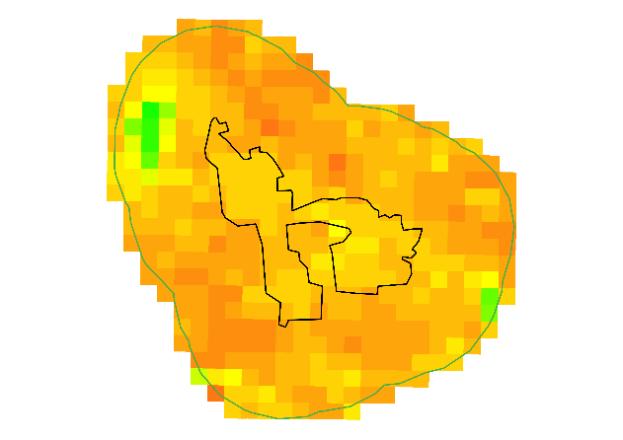 |
Figure 5.2. Land Surface Temperature of Pavagada (Karnataka)PV Solar Park before and after PV installation
Table 2. Average LST before and after the installation of PV solar plant of both locations in the PV and Buffer area.
|
PV Solar power plants |
year |
Pre-Installation |
Year |
Post-Installation |
||
|
PV area |
Buffer Area |
PV area |
Buffer Area |
|||
|
Bhadla Solar Park |
2015 |
45.34 |
45.33 |
2019 |
48.90 |
50.13 |
|
2016 |
54.24 |
53.95 |
2020 |
43.48 |
44.00 |
|
|
2017 |
50.64 |
50.73 |
2021 |
45.44 |
47.14 |
|
|
2018 |
50.38 |
50.70 |
|
|
|
|
|
Pavagada Solar Park |
2015 |
39.41 |
38.4 |
2020 |
44.44 |
44.83 |
|
2016 |
44.63 |
43.23 |
2021 |
39.72 |
40.47 |
|
|
2017 |
42.38 |
42.21 |
|
|
|
|
|
2018 |
42.98 |
42.1 |
|
|
|
|
|
2019 |
45.19 |
44.81 |
|
|
|
|

Figure 5.3. Temporal variation and
difference in the Land Surface
Temperature of PV region and 5 km buffer
of Bhadla (Rajasthan) PV Solar Park.
Dotted line bifurcate years as pre/post
PV panel installation year

Figure 5.4. Temporal variation and
difference in the Land Surface
temperature of PV region and 5 km buffer
of Pavagada (Karnataka) Solar PV Power
Plant. Dotted line bifurcate years as
pre/post PV panel installation year
Air Temperature
Assessed temporal variations in the daily maximum 2 m air temperature of summer months for semiarid to arid regions and eastern dry agro-climatic zone using NASA's Earth (GIOVANNI) data (https://giovanni.gsfc.nasa.gov/giovanni/). Despite the temperature data being coarse resolution, the spatial and temporal pattern of air temperature still provide insights to understand the likely changes in the temperature with the installation of PV solar plant.
Comparative analyses of location-wise and year-wise temporal variation of 2-m Air Temperature at PV region and 5 km buffer in Pavagada (Karnataka) PV Solar Park are depicted in Figure 6.1 (and 6.2), Figure 6.3 (and 6.4) and Figure 6.5 (and 6.6) for March, April and May months respectively, which illustrates that there are no significant changes in the 2-m air temperature during summer months at Pavagada power plant and also in buffer region during post installation compared to the period before installing PV solar plant. Figure 6.7, 6.8, and 6.9 depict the maximum daily, maximum 2-m Air temperature for March, April, and May months at Pavagada PV and surrounding regions, which further highlights that there are no significant variations in temperature (i) at PV locations and buffer regions, and (ii) during post installation period compared with the air temperatures of pre-installation period.


Figure 6.1 and 6.2 Location wise and
year wise temporal variation in 2-m Air
Temperature for March month at PV region
and 5 km buffer in Pavagada (Karnataka)
PV Solar Park.
Note: Green box indicates the location were PV plant is installed. Dotted line bifurcate years as pre/post PV panel installation year.


Figure 6.3 and 6.4. Location wise and
year wise temporal variation of 2-m air
temperature for April at PV region
and 5 km buffer in Pavagada (Karnataka)
PV Solar Park.
Note: Green box indicates the location were PV plant is installed. Dotted line bifurcate years as pre/post PV panel installation year.


Figure 6.5 and 6.6 Location wise and
year wise temporal variation of 2-m Air
Temperature for May at PV region and 5
km buffer in Pavagada (Karnataka) PV
Solar Park.
Note: Green box indicates the location were PV plant is installed. Dotted line bifurcate years as pre/post PV panel installation year.
|
Pre-Installation |

|
||
|
2017 |
2018 |
2019 |
|
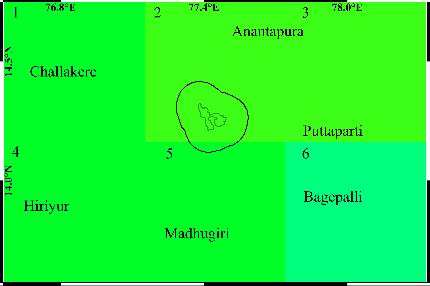
|
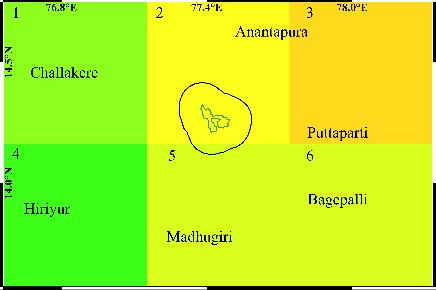
|
|
|
|
Post-Installation |
|||
|
2020 |
2021 |
2022 |
|
|
|
|
|
Figure 6.7. maximum of daily maximum 2-m Air temperature in March at Pavagada PV and Surrounding area
|
Pre-Installation |
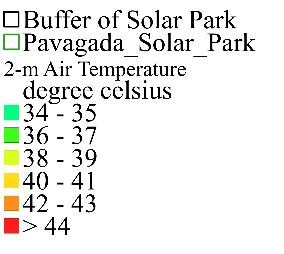

|
||
|
2017 |
2018 |
2019 |
|
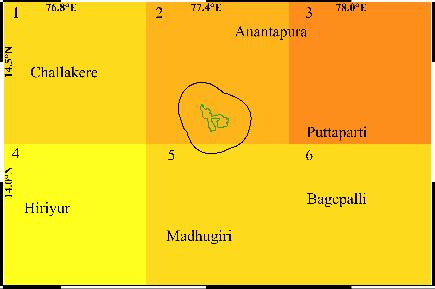
|
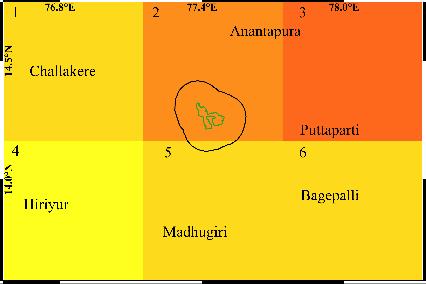
|
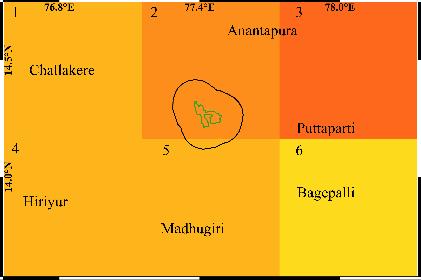
|
|
|
Post-Installation |
|||
|
2020 |
2021 |
2022 |
|
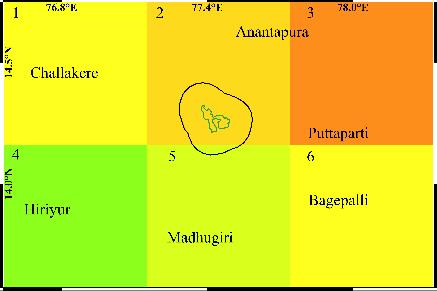
|
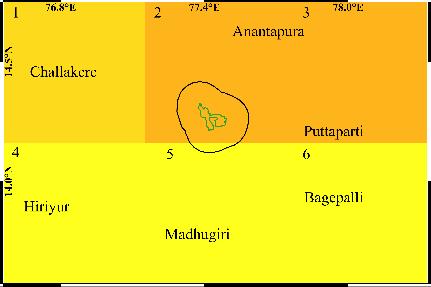
|
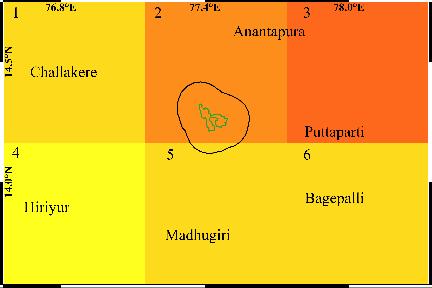
|
|
Figure 6.8. maximum of daily maximum 2-m Air temperature for April at Pavagada PV and Surrounding area
|
Pre-Installation |
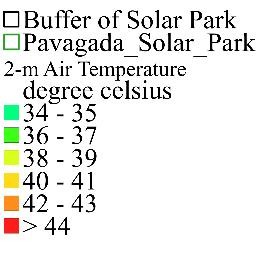

|
||
|
2017 |
2018 |
2019 |
|
|
|
|
|
|
Post-Installation |
|||
|
2020 |
2021 |
2022 |
|
|
|
|
|
Figure 6.9. maximum daily maximum 2-m Air temperature for May at Pavagada PV and Surrounding area
Figure 6.1 to 6.6 depicts the variation in the air temperature in the summer months at Pavagada solar power plant. The maximum temperature is 41.370C in 2021 and 41.17 0C in 2022, which is ~10C (or >10C) higher than pre-installation years at the location-2 with the Solar power plant, the increased temperature in the PV region is noticed for all years except 2020 at all locations including at PV. The lowest temperature in all 6 locations, including the PV region, is in 2017, then increased by an average of 2.50C in 2018 and 2019. However, there is 10 C decrease in 2020 compared to the preceding year, 2019. There are significant variations in temperature during the post-installation period compared to the earlier period for March, evident from the statistical F-test (P<0.05).
Air temperature in 2022 of April in PV region is 0.1 0C higher than 2018, but is ~20C lower in 2020 than the pre-installation period in all locations except Bagepalli (location 6).
Figures 6.7, 6.8, and 6.9 depict the maximum of daily maximum 2-m air temperature for March, April, and May months. The period after the PV installation showed ~1oC lower Maximum temperature in May month (figure 6.5) at all locations, including Solar PV locations (loc 2), after 2019. There are no significant variations in 2-m air temperature during post installation period compared to before 2019 (F-test, p>0.05).
Higher air temperature at location 3
(away from solar PV by ~60Km) during
summer months further highlights that
presence of the large PV may not be the
reason for changes in ambient
temperature. The study confirms that PV
panels do not significantly influence
the ambient temperature. Nevertheless,
there has been an increasing temperature
trend in recent years at all locations,
irrespective of the presence or absence
of PV plants.
Bhadla Solar Park
The Bhadla solar park is located in the semiarid to the arid region. Carried out analyses of location-wise and year-wise temporal variation of 2-m Air Temperature at PV region and 5 km buffer in Bhadla (Rajasthan) PV Solar Park and presented in Figure 6.10 (and 6.11), Figure 6.12 (and 6.13) and Figure 6.14 (and 6.15) for April, May and June months respectively. It illustrates that there is no significant change in the 2-m air temperature during the summer months at Bhadla (Rajasthan) power plant and also in buffer region during post-installation compared to the period before installing PV solar plant. Figure 6.16, 6.17, and 6.18 depict the maximum daily, maximum 2-m Air temperature for April, May, and June months at Bhadla PV and the surrounding area, which further highlights that there are no significant variations in temperature (i) at PV locations and buffer regions, and (ii) during post installation period compared with the air temperatures of pre-installation period.
During the summer months of 2015 to 2018 (pre-installation period), there was an increase in the daily maximum 2-m air temperature, which dropped in 2019 to an average 43.6 0C from 45.2 0C (2018). However, after a further drop in 2020, 2-m air temperature showed an increasing trend in April. 2-m air temperature is 0.50C lower in 2022 (post-installation) than in 2018 (pore-installation), at all locations, including the PV-installed region (0.4 0C lower in 2022 than in 2018). There are significant variations in 2-m air temperature during the post-installation period compared to the pre-installation period (F-test, P<0.05) though there are minor fluctuating trends.
During May, daily maximum temperature shows an increasing trend from 2015 (pre-installation) to 2022(post-installation), and there has been a significant increase in 2016 compared to all years. The ambient temperature increased at PV location by 1.5 0C from 2015 to 2018, which decreased by 10C in 2021 and raised by 10C in 2022 compared to air temperatures of the pre-installation period.
Cooling in the air temperature ~1.50C was observed from June of 2018 to 2022 and 0.50C increase in 2019. There is no significant (F-test, P<0.05) variations in temperatures of June month during post installation period compared with the pre-installation period. Location 1, near the desert or part of the desert, shows the maximum temperature during April, May and June from 2015 to 2022.
Air temperature at the PV installed region and buffer region in the different climatic regimes doesn't follow any particular pattern. Although the assessment of air temperature at PV solar parks and buffer regions highlights of cooling effect of PV plants during April and June months in Bhadla, and May month in Pavagada. There is a slight increase during March and April in Pavagada, and May in Bhadla, but variations are not significant compared to the land feature other than solar panels.


Figure 6.10 (and 6.11). Location wise
and year wise temporal variation of 2-m
Air Temperature for April at Bhadla
(Rajasthan)PV region and 5 km buffer.
Note: Green box indicates the location
were PV plant is installed. Dotted line
bifurcate years as pre/post PV panel
installation year.


Figure 6.12 (and 6.13). Location wise
and year wise temporal variation in the
2-m Air Temperature for May at Bhadla
(Rajasthan) PV region and 5 km buffer.
Note: Green box indicates the location
were PV plant is installed. Dotted line
bifurcate years as pre/post PV panel
installation year.
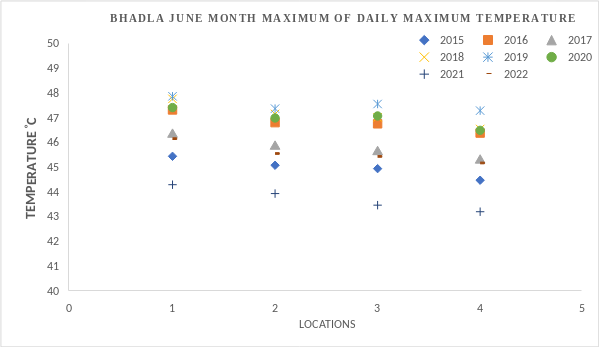
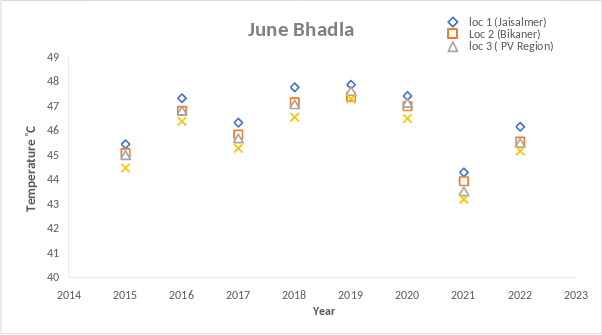
Figure 6.14 (and 6.15). Location wise
and year wise temporal variation in the
2-m Air Temperature for June at Bhadla
(Rajasthan)PV and 5 km buffer.
Note: Green box indicates the location were PV plant is installed and Dotted line bifurcate years as pre/post PV panel installation year.
|
Pre-Installation |
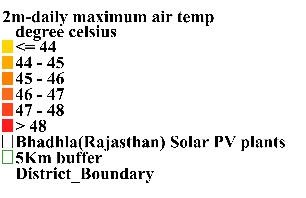

|
|||
2015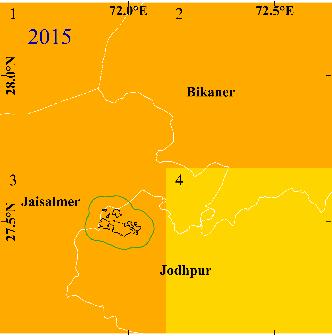
|
2016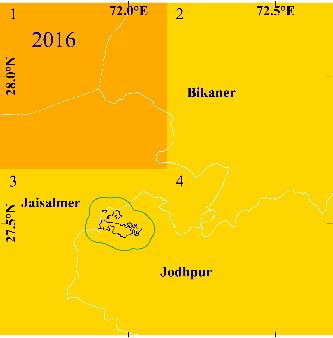
|
2017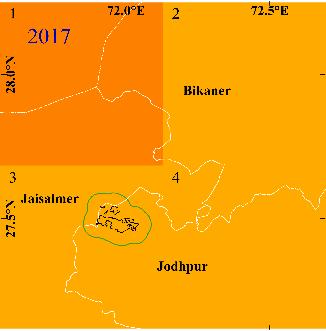
|
2018
|
|
|
Post-Installation |
||||
2019
|
2020
|
2021
|
2022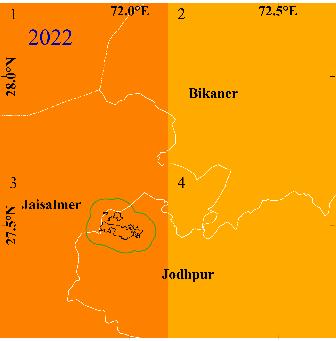
|
|
Figure 6.16. maximum daily maximum 2m Air temperature for April at Bhadla PV plant and buffer region
|
Pre-Installation |
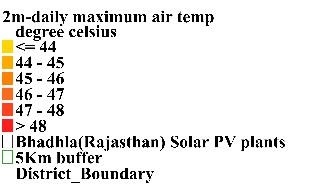

|
|||
2015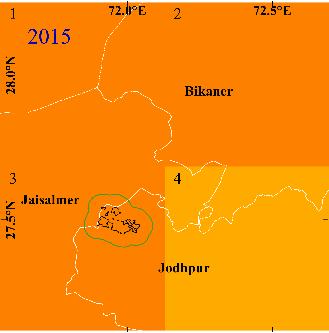
|
2016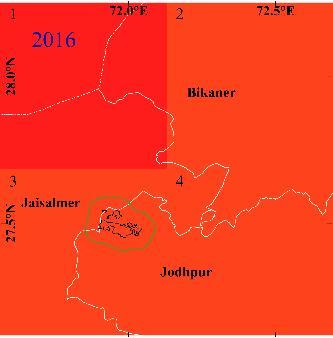
|
2017
|
2018
|
|
|
Post-Installation |
||||
2019
|
2020
|
2021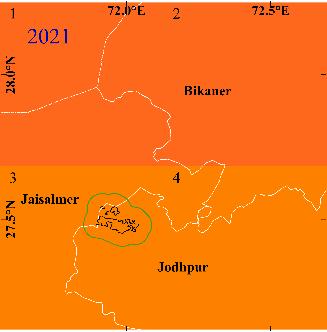
|
2022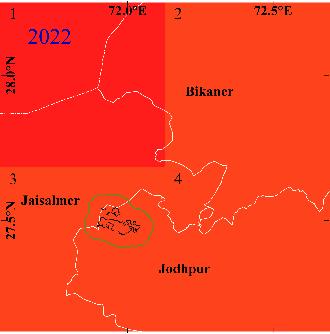
|
|
Figure 6.17. maximum daily maximum 2-m Air temperature for May at Bhadla PV and Surrounding area
|
Pre-Installation |

|
|||
2015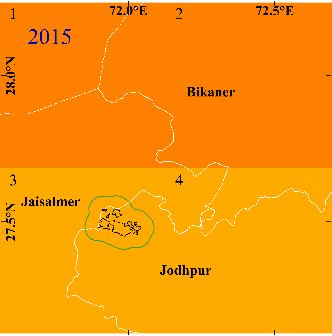
|
2016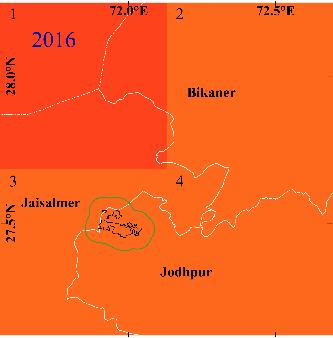
|
2017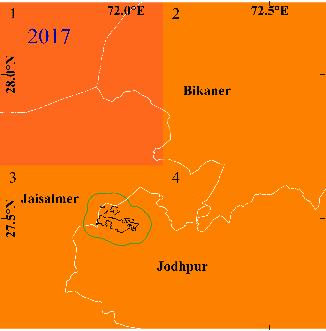
|
2018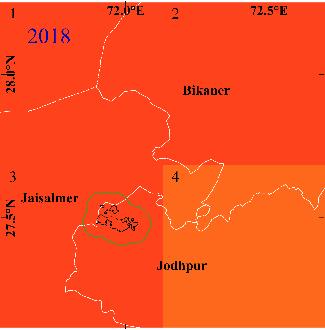
|
|
|
Post-Installation |
||||
2019
|
2020
|
2021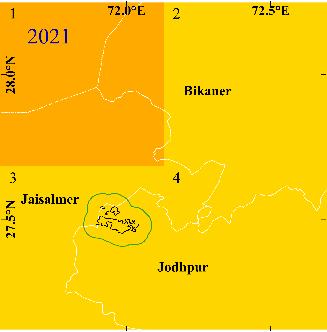
|
2022
|
|
Figure 6.18. maximum daily maximum 2-m Air temperature for June at Bhadla PV and the Surrounding area
Challenges of Solar Energy
- Weather – Dependent. Although solar energy can still be collected during cloudy and rainy days, the efficiency of the solar system drops.
- Solar energy storage is expensive.
- Uses a lot of space.
- Associated with pollution
- Environmental impacts
Opportunities of Solar Energy
Socio- Economic
- Boost the local, rural Industries
- Acceleration of electrification in rural area
- 24/7 electricity for the Industries
- Energy independency
- Job opportunities
Environmental positive impacts
- Reduction of the emissions of the greenhouse gases
- Absence of any air emissions or waste products during their operation
- Reclamation of degraded land
- Reduction of the required transmission lines of the electricity grids
Conclusion
Study shows that nearly 58% of the country receives annual average Global insolation of 5 kWh/m2/day with 4.16 to 5.04 kWh/kWp (Rajasthan) Photovoltaic Power Potential. LST and 2-m Air temperature during the pre and post-installation period at Bhadhla and Pavagada reveals, there is no significant variations, cooling effect observed in the LST, no variation in air temperature because of PV plant. 6475ha (~16000 acres) of land identified for the solar plant in Rajasthan without disturbing the ecology and biodiversity of the region.
References
Conservation of Wetlands: Ecosystem-based Adaptation of Climate change
- Anshumali and Ramanathan A L. 2007. Seasonal variation in the major ion chemistry of Pandoh lake, Mandi district, Himachal Pradesh, India. Applied Geochemistry 22(8): 1736-1747.
- Barbier E B. 2013. Valuing ecosystem services for coastal wetland protection and restoration: Progress and challenges. Resources 2(3): 213-230.
- Bengani R, Ujjania N C, Sangani K. et al 2020. Idol Immersion and its consequences on water quality of Tapi River, Surat (Gujarat). International Journal of Advanced Research in Biological Sciences 7(10): 137-144.
- Bhattacharya S, Bera A, Dutta A. et al 2014. Effects of idol immersion on the water quality parameters of Indian water bodies: Environmental health perspectives. International Letters of Chemistry, Physics and Astronomy 39: 234-263.
- Branco-Vieira M, Mata T M, Martins A A. et al 2020. Economic analysis of microalgae biodiesel production in a small-scale facility. Energy Reports 6: 325-332.
- Burman P D, Cajee L and Laloo D D. 2007. Potential for cultural and eco-tourism in North East India: A community-based approach. WIT Transactions on Ecology and the Environment 102: 715 - 724.
- Chaudhry P, Bhargava R, Sharma M P. et al 2013. Conserving urban lakes for tourism and recreation in developing countries: A case from Chandigarh, India. International Journal of Leisure and Tourism Marketing 3(3): 267-281.
- Chisti Y. 2008. Biodiesel from microalgae beats bioethanol. Trends in Biotechnology 26: 126-131.
- CICES. Available at <https://www.cices.eu > last accessed on 13 July 2021.
- Costanza R, d'Arge R, de Groot R. et al 1997. The value of the world's ecosystem services and natural capital. Nature, 387(6630): 253-260.
- Dasgupta S and Panigrahi A K R. 2014. Studies on the effect of aquatic pollution on ichthyofaunal diversity of the East Kolkata wetlands. International Journal of Research in Applied, Natural and Social Sciences 2(4): 145-152.
- de Groot R, Brander L and Solomonides S. 2020. Update of global ecosystem service valuation database (ESVD). FSD report No 2020-06 Wageningen, pp. 1-58. The Netherlands.
- de Groot R, Brander L, Van Der Ploeg S. et al 2012. Global estimates of the value of ecosystems and their services in monetary units. Ecosystem Services 1(1): 50-61.
- Ecosystem Services Valuation Database (ESVD) Available at <https://esvd.net >, last accessed on 21 January 2022.
- Elaigwu A M, Oladele A H and Umaru J. 2019. Protein, energy and micronutrient of five different fishes from Tiga reservoir, Nigeria. Asian Journal of Fisheries and Aquatic Research 3(2): 1-9.
- Griffiths D. 2006. The direct contribution of fish to lake phosphorus cycles. Ecology of Freshwater Fish 15: 86-95.
- Islam M M and Hossain M M. 2017. Community dependency on the ecosystem services from the Sundarbans mangrove wetland in Bangladesh. In Wetland Science Springer, pp. 301-316.
- Khan M I, Shin J H and Kim J D. 2018a. The promising future of microalgae: Current status, challenges, and optimization of a sustainable and renewable industry for biofuels, feed, and other products. Microbial Cell Factories 17(1): 1-21.
- Khan Z R, Chowdhury N S, Sharmin S. et al 2018b. Medicinal values of aquatic plant genus Nymphoides grown in Asia: A review. Asian Pacific Journal of Tropical Biomedicine 8(2): 113 - 119.
- Kulkarni V and Ramachandra T V. 2006. Environmental Management. The Energy and Resources Institute (TERI).
- Najar I A and Khan A B. 2012. Assessment of water quality and identification of pollution sources of three lakes in Kashmir, India, using multivariate analysis. Environmental Earth Sciences 66(8): 2367-2378.
- Pandey J S, Joseph V and Kaul S N. 2004. A zone-wise ecological-economic analysis of Indian wetlands. Environmental Monitoring and Assessment 98(1): 261-273.
- Peel R A, Hill J M, Taylor G C. et al 2019. Food web structure and trophic dynamics of a fish community in an ephemeral floodplain lake. Frontiers in Environmental Science 7: 192.
- Ramachandra T V and Sreekantha R. 2006. Conservation values of wetlands in Sharavathi River Basin. Pollution Research 25(1): 61-66.
- Ramachandra T V, Alakananda B, Ali Rani. et al 2011. Ecological and socio-economic assessment of Varthur wetland, Bengaluru (India). Journal of Environmental Science and Engineering 53(1): 101-108.
- Ramachandra T V, Asulabha K S and Lone A A. 2014. Nutrient enrichment and proliferation of invasive macrophytes in urban lakes. Journal of Biodiversity 5(1-2): 33-44.
- Ramachandra T V, Asulabha K S and Sincy V. 2021. Phosphate loading and foam formation in urban lakes. G P Globalize Research Journal of Chemistry 5(1): 33-52.
- Ramachandra T V, Asulabha K S, Sincy V. et al. 2016. Wetlands: Treasure of Bangalore. ENVIS Technical Report 101, EWRG, CES, Indian Institute of Science, Bangalore.
- Ramachandra T V, Raj R K, and Aithal B H. 2019. Valuation of Aghanashini estuarine ecosystem goods and services. Journal of Biodiversity 10(1-2): 45-58.
- Ramachandra T V, Rajinikanth R and Ranjini V G. 2005. Economic valuation of wetlands. Journal of Environmental Biology 26(2): 439-447.
- Ramachandra T V, Sincy V and Asulabha K S. 2020a. Efficacy of rejuvenation of lakes in Bengaluru, India. Green Chemistry & Technology Letters 6(1): 14-26.
- Ramachandra T V, Sincy V, Asulabha K S. et al 2018. Optimal treatment of domestic wastewater through constructed wetlands. Journal of Biodiversity 9(1-2): 81-102.
- Ramachandra T V, Sudarshan P, Vinay S. et al 2020b. Nutrient and heavy metal composition in select biotic and abiotic components of Varthur wetlands, Bangalore, India. SN Applied Sciences 2(8): 1-14.
- Ramachandra T V. 2016. Valuation of goods and services from forests ecosystem of Uttara Kannada, Central Western Ghats. ENVIS Bulletin Himalayan Ecology 24: 1-25.
- Rao G R, Mesta D K, Chandran M S. et al 2008. Wetland flora of Uttara Kannada. Environmental Education for Ecosystem Conservation. New Delhi: Capital Publishing Company, pp. 140-152.
- Roebeling P, Abrantes N, Ribeiro S. et al 2016. Estimating cultural benefits from surface water status improvements in freshwater wetland ecosystems. Science of the Total Environment 545: 219-226.
- Sánchez‐Baracaldo P and Cardona T. 2020. On the origin of oxygenic photosynthesis and cyanobacteria. New Phytologist 225(4): 1440-1446.
- SEEA EEA. 2014. System of Environmental-Economic Accounting 2012: Experimental Ecosystem Accounting, pp. 1-198. United Nations, New York.
- SEEA EEA. 2021. System of Environmental-Economic Accounting: Ecosystem accounting, Final draft, pp. 1-362. United Nations, New York.
- Sharma B, Rasul G and Chettri N. 2015. The economic value of wetland ecosystem services: Evidence from the KoshiTappu Wildlife Reserve, Nepal. Ecosystem Services 12: 84-93.
- Sincy V, Asulabha K S, Jaishanker R. et al 2018. Ichthyo-diversity in sewage fed lentic ecosystems of Bangalore. Paper presented at the Conference on ICWR-2018, Dept. of Environmental Sciences & Dept. of Geology University of Kerala, Trivandrum, India.
- Sincy V, Jaishanker R, Asulabha K S. et al 2022. Ichthyofauna diversity in relation to water quality of lakes of Bangalore, Karnataka. Biodiversity Challenges – A Way Forward, pp. 115-146. Daya Publishing House, New Delhi.
- TEEB (The Economics of Ecosystems and Biodiversity) Ecological and Economic Foundations Earthscan London. 2010.
- Tursi A, Maiorano P, Sion L. et al 2015. Fishery resources: Between ecology and economy. Rendiconti Lincei 26(1): 73-79.
- Vanni M J. 2002. Nutrient cycling by animals in freshwater ecosystems. Annual Review of Ecology, Evolution, and Systematics 33: 341–370.
- Yang F, Hanna M A and Sun R. 2012. Value-added uses for crude glycerol - A byproduct of biodiesel production. Biotechnology for Biofuels 5(1): 1-10.
- Zarandi M T P, Abesht A, Abedi S. et al 2019. The estimation of economic value of wetland ecosystem protection and recreational services: Case study of the Kanibrazan international wetland. Journal of Materials and Environmental Sciences 10(11): 1172-1184.
- Zhang Y, Xu H, Chen H. et al 2014. Diversity of wetland plants used traditionally in China: A literature review. Journal of Ethnobiology and Ethnomedicine 10(1): 1-19.
Environment Education at all levels to enhance environmental literacy for environmentally sound development
- https://www.encyclopedia.com/science/encyclopedias-almanacs-transcripts-and-maps/rise-environmental-science
- Environmental Literacy In America- What Ten Years of NEETF/Roper Research and Related Studies Say About Environmental Literacy in the US
- The History And Philosophy Of Environmental Education, Robert L Carter and Bora Simmons
- Environmental Education in Schools: The Indian Scenario: CJ Sonowal
- Learning Outcomes for Environmental Literacy: A Guide for Textbook Writers, Teachers and Researchers
- Role of Public Participation in Protection of Environment, Sonia Bharadwaj
- Challenges of Environmental Education in the Context ofIndian Education System: K.Sherpa 2022
- All Answers ltd, Role of Communities in Environmental Decisions
- Scientists’ warnings and the need to reimagine, recreate and restore environmental education- Reid et al (2021)
- Ecological Systems Thinking, D.W Orr, 2008
- The United Nations Environmental Education Initiatives: the Green Education Failure and the Way Forward, Dr. Choy Yee Keong (2021)
- UNEP portal, https://www.unep.org
- CEE portal, https://www.ceeindia.org
Spatial Decision Support System for managing fish resources in Bangalore
- Adhikari, S., Ghosh, L., Giri, B. S., & Ayyappan, S. (2009). Distributions of metals in the food web of fish ponds of Kolleru Lake, India. Ecotoxicology and Environmental Safety, 72(4), 1242-1248. doi:10.1016/j.ecoenv.2008.10.011
- Ali, D., Almarzoug, M. H., Al Ali, H., Samdani, M. S., Hussain, S. A., & Alarifi, S. (2020). Fish as bio indicators to determine the effects of pollution in river by using the micronucleus and alkaline single cell gel electrophoresis assay. Journal of King Saud University-Science, 32(6), 2880-2885. https://doi.org/10.1016/j.jksus.2020.07.012
- APHA, AWWA, WEF. (2005). Standard methods for the examination of water and wastewater. 21st Edition. D.C., Washington: American Public Health Association.
- Barik, N.K. (2017). Freshwater fish for nutrition security in India: Evidence from FAO data. Aquaculture Reports, 7, 1-6. http://dx.doi.org/10.1016/j.aqrep.2017.04.001
- Choi, J. Y., Engel, B. A., & Farnsworth, R. L. (2005). Web-based GIS and spatial decision support system for watershed management. Journal of Hydroinformatics, 7(3), 165-174.
- Fu, F., & Wang, Q. (2011). Removal of heavy metal ions from wastewaters: A review. Journal of Environmental Management, 92(3), 407-418. https://doi.org/10.1016/j.jenvman.2010.11.011
- Gupta, N., Sivakumar, K., Mathur, V.B., & Chadwick, M.A. (2015). Terrestrial protected areas and managed reaches conserve threatened freshwater fish in Uttarakhand, India. Parks, 21(1), 89-101.
- http://fishbase.org
- Jarupathirun, S. (2007). Exploring the influence of perceptual factors in the success of web-based spatial DSS. Decision Support Systems, 43(3), 933-951.
- Jayaram, K.C. (1999). The freshwater fishes of the Indian Region. Narendra Publishing House, Delhi- 551.
- Keenan, P. B. (2006). Spatial decision support systems: A coming of age. Control and Cybernetics, 35(1), 9–27.
- Lan, Y., Tang, W., Dye, S., & Delmelle, E. (2020). A web-based spatial decision support system for monitoring the risk of water contamination in private wells. Annals of GIS, 26(3), 293-309. https://doi.org/10.1080/19475683.2020.1798508
- Okoliegbe, I.L., Ariole, C.N., & Okpokwasili, G.C. (2020). Physicochemical properties of concrete pond water used for Clariasgariepinus aquaculture. Nature and Science, 18(7), 48-55. doi:10.7537/mars nsj180720.07.
- Plessl, C., Otachi, E. O., Körner, W., Avenant-Oldewage, A., &Jirsa, F. (2017). Fish as bioindicators for trace element pollution from two contrasting lakes in the Eastern Rift Valley, Kenya: spatial and temporal aspects. Environmental Science and Pollution Research, 24(24), 19767-19776. doi: 10.1007/s11356-017-9518-z
- Ramachandra T V, Sincy V, Asulabha K S, Sudarshan Bhat and Rahaman M F, 2016. Recurring fish mortality episodes in Bangalore Lakes: Sign of irresponsible and fragmented governance, ENVIS Technical Report 105, Energy & Wetlands Research Group, CES, IISc, Bangalore, India
- Ramachandra T.V, Tara N.M., & Setturu, B. (2017). Web based spatial decision support system for sustenance of Western Ghats biodiversity, ecology and hydrology. Creation and Cognition in Art and Design, Edited by Aneesha Sharma and Jamuna Rajeshwaran, 58-70.
- Ramachandra T.V., Sincy V., & Asulabha K.S. (2020a). Efficacy of rejuvenation of lakes in Bengaluru, India. Green Chemistry & Technology Letters, 6(1), 14-26. doi.org/10.18510/gctl.2020.613
- Ramachandra T.V., Sincy V., & Asulabha K.S. (2021a). Accounting of Ecosystem Services of Wetlands in Karnataka State, India. Journal of Resources, Energy, and Development, 18(1&2), 1-26.
- Ramachandra, T. V., & Kumar, U. (2008). Wetlands of Greater Bangalore, India: Automatic delineation through pattern classifiers, The Greendisk Environmental Journal. Issue 26 (http://egj.lib.uidaho.edu/index.php/egj/article/view/3171).
- Ramachandra, T.V., Asulabha, K.S., & Sincy, V. (2021b). Phosphate loading and foam formation in urban lakes. G P Globalize Research Journal of Chemistry, 5(1), 33 – 52.
- Ramachandra, T.V., George, V., Vamsee, K.S., & Purnima, G.B. (2006). Decision support system for regional electricity planning. Energy Education Science and Technology, 17(1/2), 7-25.
- Ramachandra, T.V., Jha, R.K., Krishna, S.V., & Shruthi, B.V. (2004). Spatial decision support system for assessing micro, mini and small hydel potential. Journal of Applied Sciences, 4(4), 596-604.
- Ramachandra, T.V., Krishna, S.V., & Shruthi, B.V. (2005). Decision support system to assess regional biomass energy potential. International Journal of Green Energy, 1(4), 407-428.
- Ramachandra, T.V., Sudarshan, P., Vinay, S., Asulabha, K.S., & Varghese, S., (2020b). Nutrient and heavy metal composition in select biotic and abiotic components of Varthur wetlands, Bangalore, India. SN Applied Sciences, 2(8), 1-14.
- SEEA, EEA (2021). System of Environmental-Economic Accounting: Ecosystem accounting, Final draft. United Nations, New York, 1-362.
- Sincy, V., Jaishanker, R., Asulabha, K.S., & Ramachandra, T.V. (2022). Ichthyofauna diversity in relation to water quality of lakes of Bangalore, Karnataka. Biodiversity Challenges – A Way Forward (pp. 115-146). Daya Publishing House, New Delhi.
- Talwar, P.K. & Jhingran, A.G. (1991). Inland fishes of India and adjacent countries. Oxford and IBH Publishing Co. Pvt. Ltd., New Delhi.
- Terribile, F., Agrillo, A., Bonfante, A., Buscemi, G., Colandrea, M., D'Antonio, A., De Mascellis, R., De Michele, C., Langella, G., Manna, P., & Marotta, L. (2015). A Web-based spatial decision supporting system for land management and soil conservation. Solid Earth, 6(3), pp.903-928. doi:10.5194/se-6-903-2015
- Zhang, D., Chen, X., & Yao, H. (2015). Development of a prototype web-based decision support system for watershed management. Water, 7(2), 780-793. doi:10.3390/w7020780
- Zhang, Y., McBroom, M. W., Degroote, J., Kauten, R. L., & Barten, P. K. (2011). Web-based spatial decision support system and watershed management with a case study. International Journal of Geosciences, 2, 195-203. doi:10.4236/ijg.2011.23021
Microalgal SDSS for sustainable management of lakes
- AlgaeBase, (2021). https://www.algaebase.org/
- APHA, AWWA, WEF. (2005). Standard methods for the examination of water and wastewater. 21st Edition. D.C., Washington: American Public Health Association.
- Asulabha, K.S., Jaishanker, R., Sincy, V., & Ramachandra, T.V. (2022). Diversity of phytoplankton in lakes of Bangalore, Karnataka, India. Biodiversity Challenges – A Way Forward (pp. 147-178). Daya Publishing House, New Delhi.
- Blondeel, H., Landuyt, D., Vangansbeke, P., De Frenne, P., Verheyen, K., & Perring, M. P. (2021). The need for an understory decision support system for temperate deciduous forest management. Forest Ecology and Management, 480, 118634. https://doi.org/10.1016/j.foreco.2020.118634
- Desikachary, T.V. (1959). Cyanophyta. Indian Council for Agricultural Research, New Delhi.
- Geneletti, D. (2004). A GIS-based decision support system to identify nature conservation priorities in an alpine valley. Land Use Policy, 21(2), 149-160. https://doi.org/10.1016/j.landusepol.2003.09.005
- Greco, M., Martino, G., Guariglia, A., Trivigno, L., Sansanelli, V., & Losurdo, A. (2017). Development of an integrated SDSS for coastal risks monitoring and assessment. Journal of Coastal Zone Management, 20, 446. DOI: 10.4172/2473-3350.1000446
- Guillet, A., Malatesta, L., Falcetta, M., & Attorre, F. (2012). Systemic Spatial Decision Support Systems: An integrated, computer‐aided tool for biodiversity conservation. Plant Biosystems - An International Journal Dealing with all Aspects of Plant Biology, 146(4), 814-826.
- Hilton, J., O'Hare, M., Bowes, M. J., & Jones, J. I. (2006). How green is my river? A new paradigm of eutrophication in rivers. Science of the Total Environment, 365(1-3), 66-83. https://doi.org/10.1016/j.scitotenv.2006.02.055
- Jafary, P., Sarab, A. A., & Tehrani, N. A. (2018). Ecosystem health assessment using a fuzzy spatial decision support system in Taleghan watershed before and after dam construction. Environmental Processes, 5, 807-831. https://doi.org/10.1007/s40710-018-0341-4
- Janssen, R., Goosen, H., Verhoeven, M. L., Verhoeven, J. T., Omtzigt, A. Q. A., & Maltby, E. (2005). Decision support for integrated wetland management. Environmental Modelling and Software, 20(2), 215-229. https://doi.org/10.1016/j.envsoft.2003.12.020
- Jarupathirun, S. (2007). Exploring the influence of perceptual factors in the success of web-based spatial DSS. Decision Support Systems, 43(3), 933-951.
- Kaloudas, D., Pavlova, N., & Penchovsky, R. (2021). Phycoremediation of wastewater by microalgae: a review. Environmental Chemistry Letters, 19, 2905-2920. https://doi.org/10.1007/s10311-021-01203-0
- Keenan, P. B. 2006. Spatial decision support systems: A coming of age. Control and Cybernetics, 35(1), 9–27.
- Kock, A., Taylor, J. C., & Malherbe, W. (2019). Diatom community structure and relationship with water quality in Lake Sibaya, KwaZulu-Natal, South Africa. South African Journal of Botany, 123, 161-169. https://doi.org/10.1016/j.sajb.2019.03.013
- Kolli, M. K., Opp, C., Karthe, D., & Kumar, N. M. (2022). Web-Based Decision Support System for Managing the Food–Water–Soil–Ecosystem Nexus in the Kolleru Freshwater Lake of Andhra Pradesh in South India. Sustainability, 14(4), 2044. https://doi.org/10.3390/su14042044
- Mansourian, A., Taleai, M., & Fasihi, A. (2011). A web-based spatial decision support system to enhance public participation in urban planning processes. Journal of Spatial Science, 56(2), 269-282. https://doi.org/10.1080/14498596.2011.623347
- Prescott, G.W. (1970). How to Know Freshwater Algae.2nd ed., W.C. Brown. Dubuque, Iowa.
- Ramachandra T.V, Tara N.M., & Setturu, B. (2017). Web based spatial decision support system for sustenance of Western Ghats biodiversity, ecology and hydrology. Creation and Cognition in Art and Design, Edited by Aneesha Sharma and Jamuna Rajeshwaran, 58-70.
- Ramachandra T.V., Sincy V., &Asulabha K.S. (2020a). Efficacy of rejuvenation of lakes in Bengaluru, India. Green Chemistry & Technology Letters, 6(1), 14-26. doi.org/10.18510/gctl.2020.613.
- Ramachandra, T.V., & Aithal, B.H. (2016). Bengaluru's reality: Towards unlivable status with unplanned urban trajectory. Current Science, 110(12), 2207-2208.
- Ramachandra, T.V., Asulabha, K.S., & Sincy, V. (2021). Phosphate loading and foam formation in urban lakes. G P Globalize Research Journal of Chemistry, 5(1), 33 – 52.
- Ramachandra, T.V., Asulabha, K.S., Sincy V., Bhat, S.P., & Aithal, B.H. (2016) Wetlands: Treasure of Bangalore, ENVIS Technical Report 101, EWRG, CES, Indian Institute of Science, Bangalore - 560012.
- Ramachandra, T.V., Jha, R.K., Krishna, S.V., & Shruthi, B.V. (2004). Spatial decision support system for assessing micro, mini and small hydel potential. Journal of Applied Sciences, 4(4), 596-604.
- Ramachandra, T.V., Krishna, S.V., & Shruthi, B.V. (2005). Decision support system to assess regional biomass energy potential. International Journal of Green Energy, 1(4), 407-428.
- Ramachandra, T.V., Sudarshan, P., Vinay, S., Asulabha, K.S., & Varghese, S., (2020b). Nutrient and heavy metal composition in select biotic and abiotic components of Varthur wetlands, Bangalore, India. SN Applied Sciences, 2(8), 1-14.
- Ravan, S. (2002). Spatial decision support system for biodiversity conservation. GIS @ Development, 6(4), 33-34.
- Vacik, H., & Lexer, M. J. (2001). Application of a spatial decision support system in managing the protection forests of Vienna for sustained yield of water resources. Forest Ecology and Management, 143(1-3), 65-76. https://doi.org/10.1016/S0378-1127(00)00506-5
- Wang, S., Gao, Y., Li, Q., Gao, J., Zhai, S., Zhou, Y., & Cheng, Y. (2019). Long-term and inter-monthly dynamics of aquatic vegetation and its relation with environmental factors in Taihu Lake, China. Science of the Total Environment, 651, 367-380. https://doi.org/10.1016/j.scitotenv.2018.09.216
- Yen, H. W., Hu, I. C., Chen, C. Y., Ho, S. H., Lee, D. J., & Chang, J. S. (2013). Microalgae-based biorefinery–from biofuels to natural products. Bioresource Technology, 135, 166-174. http://dx.doi.org/10.1016/j.biortech.2012.10.099
Conservation and Sustainable Management of Sambhar Lake, a Ramsar Site of International Importance
- Criteria for identifying wetlands of international importance, Ramsar Information Paper 5, Ramsar Convention, Iran, 1971 (Revised 10/10/14)
- BirdLife International (2022): Important Bird Areas factsheet http://datazone.birdlife.org/
- KBA, “About Key Biodiversity Area” (https://www.keybiodiversityareas.org/home) , http://www.wiienvis.nic.in/Database/Key_Biodiversity_Areas_8647.aspx
- “The Wildlife (Protection) Act” Act no. 53 of 1972, Ministry of Environment and Forests
- Ramsar Secretariat 2016, Ramsar Handbooks 5th edition, “Introduction to the Ramsar Convention on Wetlands” – Subseries I: Handbook 1, International Cooperation on Wetlands. (Ramsar Subseries 1: Handbook 1, 2016)
- Bohra D. L., (Rajasthan Biodiversity), Some aspects related to Sambhar Jheel and its conservation, April 28, 2020 https://rajasthanbiodiversity.org/sambhar-lake-salt-extraction-migratory-birds/
- Aggarwal, S.C., The Sambhar Lake Salt Source, Government of India Press, 1951
- Ramsar Site Information Sheet – IN464(RIS), 1990 https://rsis.ramsar.org/ris/464
- ENVIS Centre on Wildlife & Protected Areas Database (wiienvis.nic.in)
- Imperial Gazetteer of India, Vol. XXII, Oxford at the Clarendon Press, 1908
- Interim 17.03.2020 compliance report by Goswami R. titled "Sambhar's ecology among worst" Management Plan for Sambhar Lake, Government of Rajasthan (GOR). (2021) https://greentribunal.gov.in
- Sangha, H. S. 2009. The birds of Sambhar Lake and its environs. Indian Birds 4 (3): 82-97 (2008)
- Gopal, B. & Sharma, K. P. 1994. Sambhar Lake, Rajasthan. New Delhi: WWF-India.
- SoIB 2020. State of India’s Birds factsheet: Lesser Flamingo Phoeniconaias minor https://www.stateofindiasbirds.in/species/lesfla1/. Accessed on 12/10/22
- SoIB 2020. State of India’s Birds factsheet: Greater Flamingo Phoenicopterus roseus https://www.stateofindiasbirds.in/species/grefla3/ Accessed on 12/10/22
- Kulshreshtha S., Kulshreshtha M., and Sharma B. K, Ecology and present status of flamingos at Sambhar Salt Lake, Rajasthan, India: A critical comparison with past records, IUCN bulletin – Species Survival Commission for International Wetlands, Flamingo Specialist Group, 2011
- Director. 2005. Fauna of Sambhar Lake (Rajasthan), Wetland Ecosystem Series, 6 :1-200. (Published Director, 2001. Surv. India, Kolkata)
- Kulshreshtha, S., Sharma, B. K., & Sharma, S. (2013). The Ramsar sites of Rajasthan: ecology and conservation of Sambhar Salt Lake, Jaipur and Keoladeo National Park, Bharatpur. In Faunal Heritage of Rajasthan, India (pp. 173-219). Springer, Cham.
- Meena N.K. (2005). Anthropogenic impact on hydrological balance and water quality in Sambhar Lake Rajasthan. National Institute of Hydrology.
- Sharma, B. K., Kulshreshtha, S., and Rahmani, A. R. (Eds.). (2013). Faunal heritage of Rajasthan, India: conservation and management of vertebrates. Springer Science & Business Media.
- Handbook of utilization of aquatic plants, FAO, http://www.fao.org/docrep/003/x6862e/X6862E11.htm
- Kadlec, R.H., Knight, R.L., Vymazal, J., Brix, H., Cooper, P. F., Haberl, R., (2000). Constructed Wetlands for Water Pollution Control: Processes, Performance, Design and Operation, IWA Scientific and Technical Report No. 8, London
- Ramachandra, T. V., Mahapatra, D. M., Sudarshan P. B Asulabha, K. S., Sincy, V., and Bharath, H. A., (2014). Integrated Wetlands Ecosystem: Sustainable Model to Mitigate Water Crisis in Bangalore, ENVIS Technical Report 76, Environmental Information System, CES, Indian Institute of Science, Bangalore 560012.
- Ramachandra, T.V., Mahapatra, D.M., Vinay, S., Sincy, V., Asulabha, K.S., Bhat, S.P., Aithal, B.H., 2017. Bellandur and varthur Lakes Rejuvination Blueprint, ENVIS Technical Report 116, Environment Information System, CES, Indian Institute of Science, Bangalore
- UN-HABITAT, (2008). Constructed Wetlands Manual, UN-HABITAT Water for Asian Cities Programme Nepal, Kathmandu.
- Ramachandra T V, Sudarshan Bhat and Vinay S, 2017. Constructed Wetlands for Tertiary treatment of Wastewater, ENVIS Technical Report 124, Energy & Wetlands Research Group, CES, Indian Institute of Science, Bangalore 560012
- Prefeasibility Report for setting up of Ultra megawatt solar PV power plant at surplus salt pan lands at sambhar Rajasthan., 2013.
- surveyofindia.gov.in
- Adam, R. M. 1873. Notes on the birds of the Sambhar Lake and its vicinity. Stray Feathers.1: 361-404.
- Adam, R. M. 1874. Additional note on the birds of the Sambhar Lake and its vicinity. Stray Feathers. 2: 337-441.
- Hume, A. O. 1878. The birds of a drought. Stray Feathers, 7: 52-68.
- MacCann, C. 1939. The Flamingo (Phoenicopterus ruber antiquoram Temm.). J. Bomb. Nat. Hist. Soc., 41(1):12-38.
- Mukherjee, RN, 1968. Visit to Sambhar Lake area for Flamingos in November. NLBW, 8(4): 9.
- Rahmani, A. R. 1997. The effect of Indira Gandhi Nahar Project on the avifauna of Thar desert. J. Bomb. Nat. Hist. Soc., 94(2): 233-26
- Roonwal, M. L. 1969. Fauna of Rajasthan, India. Part I: General introduction with a list of collecting localities and bibliography of Rajasthan Zoology: Zool. Surv. Ind. Rec., 61(3-4): 291-376.
- Fleming, A., Wise, R.M., Hansen, H. and Sams, L., 2017. The sustainable development goals: A case study. Marine Policy, 86, pp.94-103.
Decentralized Solar power generation: Challenges and opportunities
- Ramachandra T V, Rishabh Jain, Gautham Krishnadas,2011. Hotspots of solar potential in India, Renewable and Sustainable Energy Reviews,15(6): 3178-3186,https://doi.org/10.1016/j.rser.2011.04.007.
