


RESEARCH HIGHLIGHTS
- Aghanashini Estuary: Aghanashini River joins the Arabian Sea in Aghanashini village of Kumta taluk, Uttara Kannada district, Karnataka State, India (West Coast) forming a productive ecosystem - estuary,
- Aghanashini estuary is about48sq km and located at lat. 14.3910-14.5850oN, long 74.3040-74.5160 oE.
- Aghanashini estuary is the tidal portion, towards the river mouth is a flat expanse of water dotted with small islands and narrow creeks. This portion is a highly productive and biologically rich waterscape of coastal Karnataka.
- Estuary contains representative, rare, or unique example of natural or near-natural wetland type supports diverse biota including human livelihood, evident from 6500-7000 families dependence on the ecosystem for natural resources apart from aiding as filters, shoreline protection, diverse habitats (mudflats, sand flats, etc.) and diverse micro and macro biota
- Aghanashini estuary provides livelihood for large number of individuals residing along the estuary. The provisioning services provided by this estuary is about 11,35,847 Rs/hectare/year, which highlights the significance of an estuarine ecosystem in sustaining livelihood of 6000 - 7500 families.
- The total economic value (TEV: provisioning, regulating, supporting and information services) of Aghanashini is 50,05,035 Rs/hectare/year. This highlights the contributions by estuarine ecosystems in sustaining the economy of the district while providing jobs to thousands of ecosystem people in the region.
- Most of the communities residing in and around estuary are dependent on the resources such as; crabs, fishes, bivalves, mangroves, sand, salt, etc. available in the estuary.
- 40% migratory birds visit this estuary during winter seasons contributing to the rich nutrient cycling in the estuary by castings.
- The filtering capacity or retention factor of an estuary is a measure of the contaminants removed during their transport through the estuary to the sea.
- The constant churning and circulation of waters due to flow of fresh water from one side and the tidal influx from the Arabian Sea oxygenates the water and circulates nutrients.
- Estuaries are sinks for suspended particles carried down into them by rivers, sedimentation in them can account for a substantial reduction of the contaminant load transported to the sea. Biodegradation and volatization are also estuarine processes involved in removing especially organic micropollutants.
- The rich mangrove vegetation has significant role in food supply for the diverse faunal community. The mangrove swamp acts as food rich and protective nurseries even for many species of marine fishes and prawns, which lay eggs in the swamp. Mangroves cover almost 120 ha of mangroves with 12 species, including a mangrove grass, Porteresiacoarctata.Also recorded were 45 mangrove-associate species
- The microhabitats especially mudflats, mangroves, shallow marshes with reeds and grasses, deep open water, gazni rice fields etc. supports diverse bird fauna, evident from the presence of about 130 species and about 40 per cent are winter migrants. January was noted as being the peak time for birds of the estuary, when the largest congregations happen. Aghanashini merits the status of a conservation reserve for birds for their sheer numbers and the ease with which they can be observed. The rich bird community associated with the estuarine ecosystem contributes substantially to the nutrient cycling through their potash and nitrogen rich castings.
- The bivalve-based economy had an estimated turnover of Rs.57.8 million per year (the market prices had escalated over 10-fold due to bivalve depletion caused by unregulated market forces and habitat degradation by agencies beyond the control of bivalve collectors). It had generated direct employment for 2347 people and provided nutritional security to scores more along the Karnataka coast and in neighbouring states. Of these, 638 were women. The bivalve production was in surplus, being estimated at 22,000 tons, a good portion being sent to Goa and other distant markets.
- The edible bivalves Meretrix meretrix, M. casta, Paphiamalabarica, Perna viridis and Crassostera spp. Katelsya opimaandTegillariagranosaoccur in high to medium salinity conditions and Villoritacyprinoides in medium to low salinity conditions, which emphasizes the ecosystem management implications of these high value economic species
- The brachyuran crab crabs belong to 23 genera from 11 families. Out of these 10 species are commercially important. It may be that the natural conditions are an important factor for this high diversity in Aghanashini, in terms of the survival of a mosaic of crab habitats with the salinity gradients. These crabs are mainly associated with habitats like mangroves, marshy areas, sandy and rocky shores and subtidal areas.
- Naturalness of Aghanashini with the diverse habitats and micro-habitats supports species composition evident from the reporting of 77 fish species, with 13 species are basically marine, which entered during the pre-monsoon period, when the estuarine mouth had a salt concentration nearly equaling that of seawater; 43 species keep freely moving between the estuary and the marine areas. About 18 species are highly euryhaline in nature, their range extending from the marine region to the fresh water. Only two species were nearly confined to estuarine areas.
- The estuary, being one of the most natural ones, is rich in indigenous livelihood activities. Fishing is a major activity, and about 6000 native fishermen, from different communities, such as Ambigas, Harikantras and Daljis, are engaged in fishery.
- Cultivation of the salt-tolerant rice Kagga in the estuarine rice fields has been a major occupation in the estuarine villages for generations. Salt making, water transport, sand and shell mining, mat and basket weaving, boat making, etc. are other livelihood options in the estuary.
- Eco-tourism is emerging as an additional source of livelihood in some of the villages of Aghanashini.
- Estuaries, more specifically mangrove areas, have the highest quantities of organic carbon storage in the soil to an extent of 1000 tonse of organic arbon in every hectare, which emphasies the role played by this estuary in mitigating climatic changes and consequent impact of a sea level rise. The entire estuary, therefore, has over a million tons of soil organic carbon, which highlights the conservation significance of this biodiversity-rich estuary.
-
Threats: Various threat factors are
emerging, of late, causing
degradation of the estuary, its
diverse ecosystems and associated
traditional livelihoods.
- Overfishingis a major issue that has not only affected estuary-based livelihoods but is also causing upsets in the marine fishery sector as the nursery function of the estuary for marine organisms is getting undermined in the absence of any sustainable management strategies.
- Abandoning rice cultivationin several gaznis due to introduction of prawn farming has its own adverse effects on the estuarine ecology and fishery as well as on organic carbon sequestration in the gazni systems.
- The digging out of shells on a large scale, several thousand tons every year, has been an almost unchecked activity, with adverse consequences on the ecosystem, nutrient cycles and the estuarine productivity feared.
- Pressure from sand mining on the estuaryhas been mounting over the last several years.
Designation of Ramsar wetlands status to Aghanashini estuary would aid towards comprehensive management of the estuary, in relation to coastal environmental integrity and protection of dependent biota and people’s livelihoods. Also, protection would help migratory species during their annual cycle of movement.
Aghanashini estuary contains representative, rare, or unique example of natural or near-natural wetland type supports diverse biota including human livelihood, evident from 6500-7000 families’ dependence on the ecosystem for natural resources apart from aiding as filters, shoreline protection, diverse habitats (mudflats, sand flats, etc.) and diverse micro and macro biota.
INTRODUCTION
The Aghanashini, also known as Tadri River has a total length of 181 km. It originates as Bakurhole at Manjuguni near Sirsi in the Western Ghats of Uttara Kannada district. Another source, closer to Sirsi is Donihalla. The streams meet near Mutthalli about 16 km south of Sirsi. The river, winding its westerly way through the Western Ghats leaps down the Ghats at Unchalli as Lushington Falls. Further down, six km from Bilgi it has another smaller fall namely Burde Jog. The river meets the tide at Uppinpatana in Kumta taluk, 24 km upstream in the River. The river in the coastal zone has two towns, Kumta to its south and the ancient temple town town of Gokarna to the north. At Mirjan it widens into an estuarine expanse for the next 13 km length to Aghanashini village in the south towards south of the river mouth and Tadri, a small fishing port to in the north. This backwater expanse is 2-6 km wide and joins the Arabian Sea between two hills one 91 m in height and the other about 122 km high (Kamath, 1985). Aghanashini and Gangavali are two ancient rivers of the planet, springing from the Western Ghats, descending rapidly towards the west coast and meeting the Arabian Sea towards their confluence forming two important estuaries, rich in diversity and endowed with tremendous capacity to support human livelihoods. The Western Ghats of India (along with the west coast obviously, as the Ghats intrude into the Arabian Sea in many places), one of the 34 Global Biodiversity Hotspots along with Sri Lanka, , constitute an important ecological region. Springing from the Sea coast to the montane heights exceeding 2500 m, especially in southern parts, and having rainfall ranging from barely 1,000 mm, along its rain-shadow eastern parts to well over 6,000 mm in the western portions, the landscapes of Western Ghats-west coast are very heterogeneous. Clad in a range of forests from the tropical evergreen to dry deciduous, and its colder heights of rolling grasslands and stunted evergreen shola woods often enveloped by mists and clouds the mountain remained untrammeled by humans, in its pristine glory, until the early beginnings of agriculture in the region, around 3500 years ago. Everything about the region would have been primary until then as the vegetation and landscapes remained unaltered, although the human influence began some 15-20 thousand years ago with the colonization of hunter gatherers along the hilly terrain and fishing people along the coast. Such late colonization is in contrast to human arrival in the South Indian plains over 1.2 million years ago (Chandran, 1997; Chandran and Ramachandra, 2011).
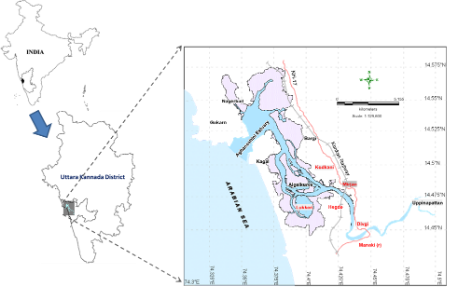
Figure 1: Aghanashini River and estuary
The estuary: At Uppinpatan village in Kumta (Figure 1), Aghanashini River meets the tide from the Arabian Sea. From thereon for 21 km length is the estuarine area. At Mirjan it flattens into a wider estuary, which has few small islands mainly Aigalkurve (inhabited) and Masurkurve (uninhabited). The estuary proper lies between lat. 14.391° to 14.585° N and long. 74.304° to 74.516° E in the Kumta taluk. The main water-spread area (including the floodplain) of the estuary is aligned parallel to the sea coast, leaving a narrow strip of land 1-1.5 km wide constituted of sand and alluvium, between Arabian Sea and the estuary. This strip of land with several villages is a densely populated tract. Substantial portion of the population are traditionally engaged in fishing, bivalve collection, fish and shrimp culturing, salinity tolerant rice cultivation in in gajni rice fields, salt making etc. In the recent decades mining sand and bivalve shells have emerged as major activities too. The main body of estuary is 13 km long and 2-6 km wide (Figure 2).
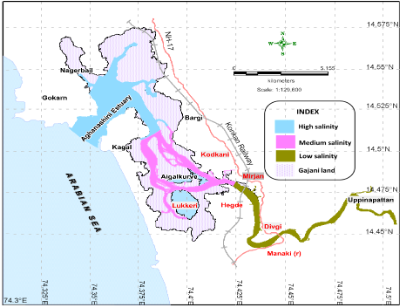
Figure 2: salinity zones and gajani fields cum aquaculture areas in Aghanashini estuary
The total water spread area is 4940 ha which excludes estuarine rice fields and aquaculture farms. About 2800 ha is under high salinity in the pre-monsoon times, 1900 ha under medium salinity, and the rest, towards the narrower part upstream, merging with the fresh water portion within the bounds of Uppinpatan village, experiences low salinity (<10 ppt). This last mentioned portion, mostly bounded by low hills and plateaus covered with indurated laterite, sloping towards the river, contributes hardly any silt laden water to the river, as the runoff water during rains, from this inner coastal zone is clear, unless the hills are dug exposing the clayey soil beneath. This low (5-10 ppt) and medium (10-20 ppt) salinity portions, where the flow of water, both of rains and of tides, is faster due to the narrowness of the river, is the main portion allotted for sand mining. The wider part of the estuary, its main body, has no sand extraction blocks allotted . Between the villages Gokarna in the north and Aghanashini in the south the estuary turns to the west towards the Arabian Sea. The river mouth, situated between two laterite hills bordering the sea, is very stable. The Tadri fishery port is situated towards the north bank of the river mouth bordering Gokarna village. Before the road networks came the estuary was a major route for transportation of pilgrims to Gokarna. The picturesque estuary with flourishing mangrove vegetation (Figure 2), its rich birdlife, and traditional way of life of the people need to be protected as a cultural heritage and draw for tourism.
Gazni farming system: survival of an ancient cooperative: Vast stretches of shallow, intertidal portions, alongside Aghanashini estuary have been embanked and converted to rice fields or gaznis where the salt tolerant, indigenous, Kagga rice has been grown from ancient times. In the recent decades many of these gaznis have been diverted towards shrimp farming after flooding them with tidal waters. The gaznirice fields of Aghanashini are instances of traditional co-operative farming, of several families together owning a single field, of few to few hundred hectares, and cultivating it collectively and sharing the product. When many of these gaznis were utilized for fish/prawn farming the collective system of sharing the benefits continued (Figure 2).
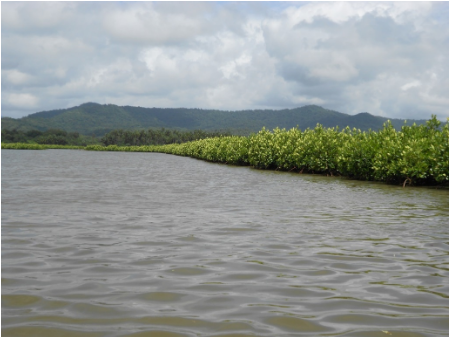
Photo 1. Aghanashini estuary fringed with mangroves blending with the foothills of the Western Ghats
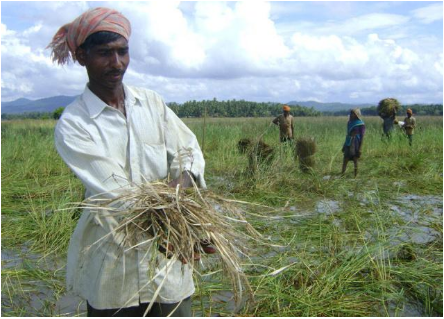
Photo 2. Harvesting Kagga rice in Aghanashini estuary
EVALUATION CRITERIA
|
Group A: Sites containing representative, rare or unique wetlands types |
|||
|
Criteria 1 |
A wetland contains representative, rare, or unique example of natural or near-natural wetland type |
||
|
Group B: Sites of International importance for conserving biological diversity |
|||
|
Criteria 2 |
A wetland should supports vulnerable, endangered, or critically endangered species or threatened ecological communities. |
||
|
Criteria 3 |
A wetland should support populations of plant and /or animal species important for maintaining the biological diversity of a particular biogeographic region |
||
|
Criteria 4 |
A wetland should support plant and/or animal species at a critical stage in their life cycles, or provide refuge during adverse conditions |
||
|
Specific criteria based on water birds |
|||
|
Criteria 5 |
A wetland should support 20000 or more water birds |
||
|
Criteria 6 |
A wetland should support 1% of the individuals in a population of one species or subspecies of water bird |
||
|
Specific criteria based on fish |
|||
|
Criteria 7 |
A wetland should support a significant proportion of indigenous fish subspecies, species of families, life-history stages, species interactions and/ or populations that are representative of wetland benefits and/or values and thereby contributes to global biological diversity |
||
|
Criteria 8 |
A wetland should be an important source of food for fishes, spawning ground, nursery and/or migration path on which fish stocks, either within the wetland or elsewhere, depend |
||
|
Specific criteria based on other taxa |
|||
|
Criteria 9 |
A wetland should support 1% of the individuals in population of one species or subspecies of wetland-dependent non-avian animal species. |
||
|
Group A: Sites containing representative, rare or unique wetlands types |
|
|
Criteria 1 |
Aghanashini estuary contains representative, rare, or unique example of natural or near-natural wetland type supports diverse biota including human livelihood, evident from 6500-7000 families dependence on the ecosystem for natural resources apart from aiding as filters, shoreline protection, diverse habitats (mudflats, sand flats, etc.) and diverse micro and macro biota |
Aghanshini estuary: Aghanashini River originates in Western Ghats flowing westwards into Arabian Sea. The river joins the sea in Aghanashini village of Kumta taluk forming a productive ecosystem- estuary, about 48sq km (lat. 14.3910-14.5850oN, long 74.3040-74.5160 oE). Aghanashini estuary provides livelihood for large number of individuals residing along the estuary. The provisioning services provided by this estuary is about 11,35,847 Rs/hectare/year, which highlights the significance of an estuarine ecosystem in sustaining livelihood of 6000 - 7500 families. The total economic value (provisioning, regulating, supporting and information services) of Aghanashini is 50,05,035 Rs/hectare/year. This highlights the contributions by estuarine ecosystems in sustaining the economy of the district while providing jobs to thousands of ecosystem people in the region. Quantification of all benefits associated with the ecosystem goods and services, would help in arriving at an appropriate policy and managerial decisions. This also emphasizes the need for green GDP (Gross domestic product) through incorporation of ecosystem goods and services in the national and regional accounting to ensure the sustainability of natural resources (water, energy, land, etc.). In the absence of such accounting, decisions are skewed in favor of environmentally degrading practices by neglecting the diffuse social interests that benefit from the use and non-use values and benefits of fragile ecosystems. Most of the communities residing in and around estuary are dependent on the resources such as; crabs, fishes, bivalves, and mangroves available in the estuary (Table 1). 40% migratory birds visit this estuary during winter seasons contributing to the rich nutrient cycling in the estuary by castings.
|
Table 1. Aghanshini estuary resources |
||
|
Resources |
Total number of species |
References |
|
Mangroves |
13 |
Chandran et al., (2012a) |
|
Bivalves |
6 |
Ramachandra et al., (2012) |
|
Crabs |
33 |
Ganesh et al., (2017) |
|
Fishes |
77 |
Bhat et al., (2014) |
|
Birds |
108 |
Chandran et al., (2012b) |
Aghanashini estuarine landforms not only accommodate diverse ecosystem functions and human activities but also mediate flood and erosion risks that are expected to increase with climate change. The daily mixing of fresh water and saltwater in estuaries is the most important phenomenon leading to variable and dynamic chemical conditions, especially salinity. High tides create saltwater currents and move seawater up into the estuary. Low tides reverse these currents.
Sedimentation is a very characteristic process associated with estuaries. Waves and tides bring marine sediments from the seabed offshore and build sandy barriers and spits at estuary entrances, from where sand is brought into the estuary by the high tides. From the land side, rivers carry finer sediments into the estuary. Upstream deforestation and construction activities lead to soil erosion and sedimentation in estuaries.
Estuaries are unique places, strongly affected by tidal action, where land, river and sea merge into a dynamic natural complex. Fishes, birds and animals congregate to feed, find refuge, grow to adulthood and stage migrations. This estuary is ranked among other estuaries in the West coast as the biologically richest ecosystems with the mean annual primary production rate at > 1500 g/m2 of dry matter. This estuary is a mosaic of various habitats typical of tropical estuaries - mangrove forests, saltmarshes, shallow open waters, mudflats, shell beds, sea grass meadows, sandy, muddy and rocky shores etc.
The filtering capacity or retention factor of an estuary is a measure of the contaminants removed during their transport through the estuary to the sea. Estuaries are sinks for suspended particles carried down into them by rivers, sedimentation in them can account for a substantial reduction of the contaminant load transported to the sea. Biodegradation and volatization are also estuarine processes involved in removing especially organic micropollutants. As water flows through a saltmarsh, marsh grasses filter pollutants out of the water, as well as excess sediments and nutrients (USEPA 1993).
‘Living shorelines’ based on natural and nature-based features are viable approach to conserving coastal habitats (marshes, beaches, shallows, sea grasses) along eroding shorelines. Living shorelines typically involve the use of coastal habitats, such as wetlands, that have a natural capacity to stabilize the shore, restore or conserve habitats and maintain coastal processes.
The mangrove community, apart from having woody mangrove trees and mangrove-associate shrubs, trees and climbers, also harbours a great complex of organisms, organized into complex ecosystems that function within the bounds of estuaries and in the marine regions. These organisms include microbes (bacteria, protozoa, fungi, cyanobacteria), meio-organisms (nematodes, copepods, polychaetes, oligocheates, etc.) and macro-organisms (polychaetes, molluscs, crustaceans, holothurians, etc.).
Tidal flats are found in intertidal areas, at the conjunction of fresh water, marine and land environments. Tidal flats are areas where sediments from river runoff, or inflow from tides, deposit mud or sand. If the energy of the waves beating on these shores is low, then small-grained sediment or mud is deposited in this area and form mudflats. Mudflats are some of the most productive marine habitats. They are nutrient traps because of their shallowness and slow-moving water. Mudflats are intertidal areas made up of fine silts and clays or mud. The gentle movement of saltwater inland brings fine sediments, and the slow movement of the river also brings fine sediments. The organisms living in these habitats can withstand the changing environmental conditions, especially salinity and hypoxic and anoxic conditions; but there is plenty of food and a relative lack of competition. Tidal flats, especially mudflats, are highly productive and therefore of high conservation importance. Among the fishes of mudflats, in general, are the predatory eels, which often remain partly burrowed in sandy/muddy bottoms, ambushing small fishes, decapods, invertebrates and also feeding on detritus.
The coastal zone, being a complex of closely interacting ecosystems involving, land, river, estuary and the sea, has been favoured for human settlements from time immemorial, compared with interior landscapes. As anthropogenic pressures mounted on the coastal zone with a flush of developmental interventions, with deleterious consequences, coastal zones the world over are getting threatened most.
The estuarine system is ever fluctuating, the most decisive physical factors being freshwater input, salinity regimes and the tides and currents, creating significant seasonal changes in the faunal communities. The dynamic changes in salinity are found as the most influential. This is unlike the marine regime, where the ocean maintains its stability especially in salinity. There are informal and formal governance structures at the grassroot level such as the self-help groups, the Village Forest Committees, the mangrove committees, the several groups of gazni (estuarine rice fields) farmers, fishing communities, bivalve collectors, the Biodiversity Management Committees, the Gram Panchayats etc. and these groups actively participate in the management of estuary.
Aghanashini estuary is the tidal portion, towards the river mouth is a flat expanse of water dotted with small islands and narrow creeks. This portion is a highly productive and biologically rich waterscape of coastal Karnataka. Whereas hundreds of families in the shore villages have direct dependence on it for their livelihoods through activities related to fishing, agriculture, collection of edible bivalves and crabs, shrimp aquaculture, traditional fish farming in the gazni rice fields, bivalve shell mining, salt production, sand removal, water transportation etc. scores of consumers in the estuarine villages and in places far away are benefited by the productivity of the estuary, of which the mangroves constitute the heart. The high productivity of the estuary is due to the following reasons:
- Through millennia the estuary and its environs formed the lifeline of the people and constitute a major cultural and historical heritage of the west coast. It was known as a rice bowl in the historical times and rice surplus was transported through water crafts to other regions. The Mirjan fort on the bank of the estuary built by Bijapur Sultans and the ruins of Aghanashini fort on a hill towards the river mouth giving a commanding view of the sea, the estuary and the Western Ghats are testimonials for the historical and cultural importance of the region. Spices grown in the hinterlands of Western Ghats were traded through the estuary during the European period and earlier to it. Gokarna on its shores has been, from time immemorial, a great place of pilgrimage. Before the road networks came the estuary was a major route for transportation of pilgrims. The beaches dotting the coastline of Gokarna are today well known places of tourism. The picturesque estuary with flourishing mangrove vegetation, its rich birdlife, and traditional way of life of the people need to be protected as a cultural heritage and draw for tourism.
- The river water carries large quantity of organic materials from the forests in the catchment area of the Western Ghats and deposits the same in the estuary. The debris becomes important base for food chains operating in the estuary and beyond in the offshore waters of the sea
- The rich mangrove vegetation has significant role in food supply for the diverse faunal community. The mangrove swamp acts as food rich and protective nurseries even for many species of marine fishes and prawns, which lay eggs in the swamp.
- The rich bird community (over 120 species, about half of them winter visitors) associated with the estuarine ecosystem contributes substantially to the nutrient cycling through their potash and nitrogen rich castings
- The constant churning and circulation of waters due to flow of fresh water from one side and the tidal influx from the Arabian Sea oxygenates the water and circulates nutrients.
Further, designation of Ramsar Site status to Aghanashini estuary would aid towards comprehensive management of the estuary, in relation to coastal environmental integrity and protection of dependent livelihoods. Also, protection would help migratory species during their annual cycle of movement.
Mangroves constitute the core of estuarine ecosystems. One of the most productive features of coastal ecosystems, mangroves produce nutritionally important detritus used by fishes, prawns, crabs, oysters, etc. Many birds, reptiles and mammals depend on mangroves for shelter/food or both. Mangroves provide protective, productive and economic benefits to coastal communities. They contribute towards the protection and building of shorelines and act as barriers against storm surges and cyclonic destruction. Mangroves are sinks of carbon as well as contain various pollutants of anthropogenic origin. A detailed survey of mangroves in the Aghanashini estuary show that almost 120 ha of mangroves with 12 species, including a mangrove grass, Porteresia coarctata. Also recorded were 45 mangrove-associate species (Chandran et al., 2012).
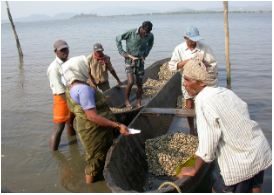
The estuary provides diverse kinds of habitats (in terms of water depth, salinity, soil nature and rockiness) for different bivalve species. Harvests were higher during the postmonsoon period (November–May) compared with the monsoon (June–October). The bivalve-based economy had an estimated turnover of Rs.57.8 million per year (the market prices had escalated over 10-fold due to bivalve depletion caused by unregulated market forces and habitat degradation by agencies beyond the control of bivalve collectors). It had generated direct employment for 2347 people and provided nutritional security to scores more along the Karnataka coast and in neighbouring states.
The edible bivalves Meretrix meretrix, M. casta, Paphia malabarica, Perna viridis and Crassostera spp. Katelsya opima and Tegillaria granosa occur in high to medium salinity conditions and Villorita cyprinoides in medium to low salinity conditions, which emphasizes the ecosystem management implications of these high value economic species (Boominathan et al. 2012, 2014; Ramachandra et al., 2012).
Brachyuran crabs and other crustaceans: With 30 species reported by our team, the brachyuran crab diversity of Aghanashini estuary is the highest among the west coast estuary
The Aghanashini crabs belong to 23 genera from 11 families (Shet et al., 2016). Out of these 10 species are commercially important. It may be that the natural conditions are an important factor for this high diversity in Aghanashini, in terms of the survival of a mosaic of crab habitats with the salinity gradients. These crabs are mainly associated with habitats like mangroves, marshy areas, sandy and rocky shores and subtidal areas.
The prawn resources from the region belong to mainly Metapenaeus dobsoni, M. monoceros, M. affinis, Penaeus monodon, P. merguiensis and P. indicus. The parent populations breed in the sea. The larvae, in different stages, move along with water currents into the estuarine areas. Once the larvae reach the backwaters, they settle towards the bottom, and post-larval juvenile prawns emerge. They move in the estuary and seek suitable habitats, especially the gazni rice fields and marshes, and contribute to the local fishery.
Naturalness of Aghanashini with the diverse habitats and micro-habitats supports species composition evident from the reporting of 77 fish species (Bhat et al. 2014a).
Aghanashini estuary with microhabitats especially mudflats, mangroves, shallow marshes with reeds and grasses, deep open water, gazni rice fields etc. supports diverse bird fauna, evident from the presence of about 130 species and about 40 per cent are winter migrants. January was noted as being the peak time for birds of the estuary, when the largest congregations happen. Aghanashini merits the status of a conservation reserve for birds for their sheer numbers and the ease with which they can be observed. The birds can be grouped into six categories:
- Large wading birds like herons, egrets, ibises and spoonbills: Two-thirds of them feed exclusively on fishes.
- Probing shorebirds: This big group includes plovers, curlews, whimbrels, sandpipers, godwits, stints, ruffs, sanderlings, shanks, waterhens, jacanas, lapwings, stilts, moorhens, pratincoles, turnstones, avocets and curlews. In the Aghanashini estuarine area, 32 species were found, of which only 10 are resident birds.
- Floating and diving birds: Ducks, grebes, cormorants, darters and teals of 11 species. Of these, four are residents and the rest migrants during winter. Whereas cormorants and darters are piscivorous, pintails, ducks and teals are herbivorous.
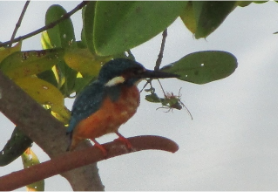
- Aerially searching but water-dependent birds: Gulls, terns and kingfishers belong to this category. Of the 17 species noted, 10 are residents and the rest migrants.
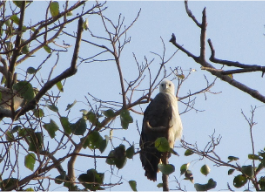
- Birds of prey: Kites, eagles, shikras, ospreys, owls and kestrels are birds of prey. Among the nine species found, five are residents and four are visitors.
- Arboreal birds: Probably the largest group of diverse kinds, such as doves, cuckoos, robins, warblers, woodpeckers, flycatchers, parakeets, swallows, thrushes, orioles, sparrows, flowerpeckers, bush larks, shrikes, mynas, babblers, bulbuls, pipits, sunbirds, munias, coucals, wagtails, hoopoes, larks and ioras. Of the 49 species, four are migrants, and the rest are local.
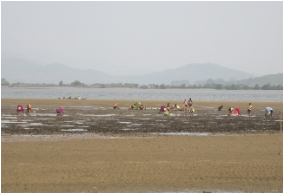
The estuary, being one of the most natural ones, without any major developmental pressures, is rich in livelihood activities. Fishing is a major activity, and about 6000 fishermen, from different communities, such as Ambigas, Harikantras and Daljis, are engaged in fishery. In bivalve collection and crab capture are engaged still more people. The Ambiga fishermen traditionally fished in rivers and estuaries. They are also presently engaged in marine fishing. They are more residents of mid and upstream villages of the estuary. The Harikantras basically are marine fishermen. They usually fish in mid and downstream estuary. The Dalji fishermen are more sea-going and also use high salinity downstream areas. Almost every half hectare of waterspread has one dependent fisherman. The traditional estuarine fishery never caused any depletion, as the fish trade was limited and a larger fishing area was available to the local fishing communities (Ramachandra and Chandran, 2013).
As regards bivalves collection for a livelihood, the survey reveals that about 2347 persons were engaged in bivalve collection. Of these, 638 were women. The bivalve production was in surplus, being estimated at 22,000 tons, a good portion being sent to Goa and other distant markets (Boominathan et al. 2008).
The crab fishery has been an important subsistence fishery for generations. Crabs mainly constituted the poor man’s food until almost a decade ago. The national and international demand for estuarine crabs has been escalating, and increasing numbers of persons from fishing and non-fishing communities are engaged in crab catching for their livelihoods. As regards Aghanashini estuary the intensification of mangrove plantation by the forest department has substantially increased the crab populations and the employment related to the crab fishery.
Cultivation of the salt-tolerant rice Kagga in the estuarine rice fields has been a major occupation in the estuarine villages for generations. Salt making, water transport, sand and shell mining, mat and basket weaving, boat making, etc. are other livelihood options in the estuary. In recent times, tourism is emerging as an additional source of livelihood in some of the villages of Aghanashini.
Estuaries, more specifically mangrove areas, have the highest quantities of organic carbon storage in the soil to an extent of 1000 tonse of organic arbon in every hectare, which emphasies the role played by this estuary in mitigating climatic changes and consequent impact of a sea level rise. The entire estuary, therefore, has over a million tons of soil organic carbon, which highlights the conservation significance of this biodiversity-rich estuary.
Various threat factors are emerging, of late, causing degradation of the estuary, its diverse ecosystems and associated traditional livelihoods. Overfishing is a major issue that has not only affected estuary-based livelihoods but is also causing upsets in the marine fishery sector as the nursery function of the estuary for marine organisms is getting undermined in the absence of any sustainable management strategies. Abandoning rice cultivation in several gaznis due to introduction of prawn farming has its own adverse effects on the estuarine ecology and fishery as well as on organic carbon sequestration in the gazni systems. The digging out of shells on a large scale, several thousand tons every year, has been an almost unchecked activity, with adverse consequences on the ecosystem, nutrient cycles and the estuarine productivity feared. Pressure from sand mining on the estuary has been mounting over the last several years. Although the government has realized the need for restricting the sand extraction from the river, it is yet unclear to what extent sand extraction can be permitted without notable adverse consequences on the estuarine ecosystems (Ramachandra et al., 2016).
In the traditional system, resources were exploited or used mostly for family consumption, sale within a limited region and not for any notable commercial gains, whether they be agricultural output or fishery-related products. It is therefore not surprising that the concept of sustainability was not consciously practiced but was inherent in the system itself, as resources were used year after year in a routine fashion without facing any depletion. The exhaustible resource use patterns emerged with introduction of new formulas related to fishery exploitation for large-scale commercial gains and conversion of many traditional rice-cum-fishery estuarine fields into prawn aquaculture ponds (Ramachandra and Chandran 2013).
Traditionally, the estuarine fishing communities of Aghanashini, like the Ambigas, fished mostly in the estuary; the Harikantras fished in the estuary and the sea; the Daljis fished more in the sea and less in the estuary. All of them used only traditional fishing gadgets, and a sense of competition hardly existed. The Patgars and Naiks mainly raised salt-tolerant rice in estuarine rice fields, namely gaznis, during the rainy season, and thereafter used the rice fields for fishery purposes. In the estuarine villages, Halkar and Holangadde, community-based forest conservation and management system prevailed. This system perished in Holangadde under governmental intervention, with the community being asked to surrender the village forest; in contrast, the Halkar community, which approached the Karnataka High Court, succeeded in retaining the control of the community over the village forest (Ramachandra and Chandran 2013).
All these communities have sound traditional knowledge in their respective fields. The fishers knew much about the fish species, their locations and timings and the importance of limiting the catches to the bigger sizes. The agriculturists knew about the technique of raising salt-tolerant rice in specially prepared estuarine rice fields, where the effort was mainly on building and maintenance of embankments fitted with sluice gates and also knew the gazni rice field fishery; however they allowed the local fishers to fish in these gaznis. The Agers were experts in making salt from estuarine water, as they are to this day.
The near-shore estuarine and marine ecosystems function as nurseries, highlights interconnectedness of fishery habitats and underscores the need for protection and conservation of these areas. Therefore, improvement of the quality of these habitats is bound to favour their nursery functions. Mangrove ecosystem provides an ideal nursery and breeding ground to most of the marine and brackish water fish and shell fish. Some marine fishes also spawn in the high-salinity portions of the estuaries.
Aghanashini estuary is one of the richest in finfish diversity evident from the report of 77 species (Bhat et al. 2014a) with 13 species are basically marine, which entered during the pre-monsoon period, when the estuarine mouth had a salt concentration nearly equaling that of seawater; 43 species keep freely moving between the estuary and the marine areas. About 18 species are highly euryhaline in nature, their range extending from the marine region to the fresh water. Only two species were nearly confined to estuarine areas. Many fishes have their own preferable salinity regimes, necessitating their constant movement within the estuary according to the dynamic salinity conditions. It is critical therefore that for an estuary to be rich in fish diversity it have dynamic salinity gradients within itself, caused by differential mixing of fresh water and seawater, which necessitates an appropriate fishery management strategy (Bhat et al. 2014b).
Supporting Publications:
-
Bhat, M., Nayak, V.N., Chandran, M.D.S. and Ramachandra, T.V. 2014a. Fish distribution dynamics in the Aghanashini estuary of Uttara Kannada, west coast of India. Current Science 106(12): 1739–1744.
-
Bhat, M., Nayak, V.N., Chandran, M.D.S. and Ramachandra, T.V. 2014b. Impact of hydroelectric projects on the finfish diversity in the Sharavathi estuary of Uttara Kannada district, central west coast of India. International Journal of Environmental Sciences 5(1): 58–66.
-
Boominathan, M., Chandran, M.D.S. and Ramachandra, T.V. 2008. Economic Valuation of Bivalves in the Aghanashini Estuary, West Coast, Karnataka. ENVIS Technical Report, 30, Centre for Ecological Sciences, Indian Institute of Science, Bangalore.
-
Boominathan, M., Ravikumar, G., Chandran, M.D.S. and Ramachandra, T.V. 2012. The impact of dams on the edible bivalves: A comparative study of Kali and Aghanashini estuaries of Uttara Kannada District, Karnataka, India. In National Conference on Mangrove Wetlands and Near Shore Marine Ecosystems from Sustainability Issues to Management & Restoration, 5–6 March 2012, ed. Ramanathan, A.L. et al., School of Environmental Sciences, Jawaharlal Nehru University, New Delhi, India.
-
Boominathan, M., Ravikumar, G., Chandran, M.D.S. and Ramachandra, T.V. 2014. Impact of hydroelectric projects on bivalve clams in the Sharavathi estuary of Indian west coast. The Open Ecology Journal 7:52-58.
-
Chandran, M.D.S.,Ramachandra, T.V., Joshi, N.V., Mesta, N.M., Settur, B. and Vishnu, D.M. 2012. Conservation and Management of Mangroves in Uttara Kannada, Central West Coast. ENVIS Tech. Report, 50. Centre for Ecological Sciences, Indian Institute of Science, Bangalore.
-
Ramachandra, T.V. and Chandran, M.D.S. 2013. Traditional Knowledge of the Communities of Aghanashini and Gangavali Estuaries in Uttara Kannada District, Karnataka State. Indo-German Biodiversity Programme. Conservation and Sustainable Management of Existing and Potential Coastal and Marine Protected Areas. CSM-CMPA.
-
Ramachandra, T.V., Chandran, M.D.S., Joshi, N.V. and Boominathan, M. 2012. Edible bivalves of Uttara Kannada district, Karnataka, India. ENVIS Technical Report 48. Centre for Ecological Sciences, Indian Institute of Science, Bangalore.
-
Ramachandra, T.V., Chandran, M.D.S., Naik, S. and Mesta, P. 2016. Sand mining and its impact on ecology of Aghanashini estuary, Uttara Kannada district, Karnataka. ENVIS Technical Report 92. Centre for Ecological Sciences, Indian Institute of Science, Bangalore.
-
Shet, G.N., Chandran, M.D.S. and Ramachandra, T.V. 2016. Brachyuran crabs of Aghanashini estuary, south Indian west coast, Karnataka. Paper presented during Lake 2016: Conference on Conservation and Sustainable Management of Ecologically Sensitive Regions in Western Ghats, 28–30 December, Moodbidri, Dakshina Kannada.
-
US Environmental Protection Agency (USEPA). 1993. National Estuary Program: Challenges facing our estuaries—Key management issues. National Estuary Program.
|
Group B: Sites of International importance for conserving biological diversity |
|
|
Criteria 2 |
A wetland should supports vulnerable, endangered, or critically endangered species or threatened ecological communities. |
|
Criteria 3 |
A wetland should support populations of plant and /or animal species important for maintaining the biological diversity of a particular biogeographic region |
|
Criteria 4 |
A wetland should support plant and/or animal species at a critical stage in their life cycles, or provide refuge during adverse conditions |
Aghanashini Estuarine Ecosystem: Wetland of International importance for conserving biological diversity
Aghanashini River originates in Western Ghats flowing westwards into Arabian Sea. The river joins the sea in Aghanashini village of Kumta taluk forming a productive ecosystem- estuary, about 48sq km (lat. 14.3910-14.5850oN, long 74.3040-74.5160 oE). Aghanashini estuary provides livelihood for large number of individuals residing along the estuary. Total annual production from estuary is estimated at 22,006 tons valuing about Rs. 57.8 million per annum. Most of the communities residing in and around estuary are dependent on the resources such as; crabs, fishes, bivalves, and mangroves available in the estuary (Table i). Many migratory birds visit this estuary during winter seasons contributing to the rich nutrient cycling in the estuary by castings.
|
Table i : Aghanshini estuary resources |
||
|
Resources |
Total number of species |
References |
|
Mangroves |
13 |
Chandran et al., (2012a) |
|
Bivalves |
6 |
Ramachandra et al., (2012) |
|
Crabs |
33 |
Ganesh et al., (2017) |
|
Fishes |
77 |
Bhat et al., (2014) |
|
Birds |
108 |
Chandran et al., (2012b) |
Economic valuation of an ecosystem aids in the wise use and prudent management of natural resources through the quantification and comparison of various benefits of ecosystem services. The present study focusses on the valuation of ecosystem goods and services from an estuary at Aghanashini, Uttara Kannada district, Karnataka. The provisioning services provided by this estuary is about 11,35,847 Rs/hectare/year, which highlights the significance of an estuarine ecosystem in sustaining livelihood of 6000 - 7500 families. The total economic value (provisioning, regulating, supporting and information services) of Aghanashini is 50,05,035 Rs/hectare/year. This highlights the contributions by estuarine ecosystems in sustaining the economy of the district while providing jobs to thousands of ecosystem people in the region. Quantification of all benefits associated with the ecosystem goods and services, would help in arriving at an appropriate policy and managerial decisions. This also emphasizes the need for green GDP (Gross domestic product) through incorporation of ecosystem goods and services in the national and regional accounting to ensure the sustainability of natural resources (water, energy, land, etc.). In the absence of such accounting, decisions are skewed in favor of environmentally degrading practices by neglecting the diffuse social interests that benefit from the use and non-use values and benefits of fragile ecosystems.
Keywords: estuarine ecosystem, provisioning services, Aghanashini, total economic valuation
Aghanashini Estuarine Ecosystem:
Wetland of International
importance for conserving biological
diversity
1.0 INTRODUCTION
Ecosystems consist of biotic and abiotic resources with complex interactions among a fabric of plant, animal, and other microscopic life with the non-living environment (Ramachandra, Vinay, Bharath, et al., 2018; Ramachandra, Bharath, Vinay, 2018; Ramachandra, Sincy, Asulabha, et al., 2018). The ecosystem provides various vital benefits such as food; soil production, erosion and control; climate regulation; water purification; bioenergy, etc. These benefits and services are referred to as ‘Ecosystem services’ and are very crucial for the survival of humans and other organisms on the earth (Ramachandra, Bharath, Subashchandran, et al., 2018; Ramachandra, Vinay, Subashchandran, 2018). The structural components of the ecosystem include physical features (such as land cover, water, sediment and soil profile, the gradient of conditions in water body), biotic compositions (like species, number of individuals and their biomass), etc. Interactions between these elements, i.e., the flow of nutrients, energy, etc. between different ecosystems constitute the functional aspects of an ecosystem. The ecosystem can be broadly categorized as aquatic and terrestrial ecosystem, on the basis of their major source and sink of nutrient, i.e., water or land (Ramachandra, Vinay, Bharath, et al., 2018; Ramachandra, Bharath, Vinay, 2018). Aquatic ecosystem with rich nutrient contents is substantially different from terrestrial ecosystem. Both these ecosystems are dependent upon each other, as there is an overlap of the functional boundary between the two, irrespective of the physical boundaries (Ramachandra, Sincy, Asulabha, et al., 2018).
An estuary is a partially enclosed body of water where the rivers meet sea and the salinity is intermediary to that of marine and fresh water. This makes the estuarine ecosystems unique in their ecological and biological functions (Anoop, Suryaprakash, Umesh, et al., 2008). Forming a dynamic zone of convergence between land and sea, the coastal regions of the earth serve as unique geological, ecological and biological domains of vital importance to a vast array of terrestrial and aquatic life (Wilson, Farber, 2005). These are major specialized ecosystems where organic matter is built up in large quantities and offers ideal biotic conditions to sustain considerable aquatic population (Boominathan, Subhash chandran, Ramachandra, 2008; Rao, Suresh, 2002). Estuaries and surrounding areas are transitory places where the landscapes change from land to sea and water quality from fresh to salty. Although influenced by the tides estuaries are protected from the ocean waves, winds and storms by reefs , barrier islands and land, mud or sand that define an estuaries seaward boundary (Ramachandra, Bharath, Vinay, 2018; Ramachandra, Bharath, Vinay, 2018). More than 200 rivers flow towards the west coast and develop as estuaries before joining the Arabian Sea.
Fresh water influx and density difference between the two merging water entities, a constant replenishment of nutrients and versatility in their structure make it a nursery ground for many marine organisms (Ramachandra, Vinay, Subashchandran, 2018). Diverse habitats that are found in and around estuaries can be grouped as shallow open waters, fresh water and salt marshes, sandy beaches, mud and sand flats, rocky shores, mangrove forests, river deltas, tidal ponds and sea grass beds. The estuarine ecosystem is essential for the survival of birds, mammals, fish, etc., which depend on the ecosystem for living, feed and reproduction. Many marine organisms, including commercially valuable fish species depend on estuaries at some stage during their development (Bhat, Subhashchandran, Ramachandra, 2010; Ramachandra, Bharath, Vinay, 2018; Ramachandra, Bharath, Subashchandran, et al., 2018; Wilson, Farber, 2005). Estuaries are the year round home for many species (oysters), while other species (salmon and shrimp) move in and out of estuaries on a seasonal basis for reproduction and growth (Wilson, Farber, 2005).
Estuaries and inlets serve as places of relative shelter that also provided staging areas for harvesting food and fiber (Wilson, Farber, 2005). Estuaries supports the livelihood to rural communities with the provision of a variety of living and non-living resources, which offer opportunities for employment, income, amenities and pleasure to the local people (Boominathan, Subhash chandran, Ramachandra, 2008; Thomson, 2003). Fishing is one of the major economic activities of the rural coastal communities (Anoop, Suryaprakash, Umesh, et al., 2008; Bhat, Subhashchandran, Ramachandra, 2010; Thomson, 2003). Apart from these direct tangible flows of economic benefits, estuaries also provide a variety of indirect services to local communities and to the rest of the world which enhance the economic significance of these systems manifold. The capacity of estuaries to regulate various gases, climate, water currents and flow, soil erosion and sedimentation, retention and soil formation, nutrient cycling, waste treatment, pollination and thereby control the various biological processes is well recognized. Moreover, estuaries supply various kinds of recreation services and act as the primary pool of genetic resources. In fact, these diverse ecosystem functions along with the direct flow of benefits through the supply of various goods and services make these systems valuable to humanity. These services are enjoyed by human users almost free of cost or at a price much below the cost of acquiring alternate but similar services (Boominathan, Subhash chandran, Ramachandra, 2008; Ramachandra, Soman, Ashwath, et al., 2017; Thomson, 2003).
The estuaries are also the repositories of mangroves biodiversity which serve as a wall for the coastline apart from providing numerous other benefits. Mangroves are salt tolerant forest ecosystems found mainly in tropical and sub-tropical intertidal regions (Hirway, Goswami, 2007; Kathiresan, Narayanasamy, 2005; Bhat, Subhashchandran, Ramachandra, 2010) where they may receive organic materials from estuarine or oceanic ecosystems. The presence of mangroves enriches various forms of living organisms and ensures smooth delivery of various ecosystem services to humanity at large. These rich ecosystems provide a wide range of ecological and economic products and services, and also support a variety of other coastal and marine ecosystems, which again provide several economic and ecological benefits (Hirway, Goswami, 2007; Kathiresan, Narayanasamy, 2005; Prakash, Subhashchandran, Ramachandra, 2010). Mangroves supply forestry products (firewood, charcoal, timber, honey etc.) and fishery products (fish, prawn, crab, mollusk etc.). Due to high calorific values, mangrove twigs are used for making charcoal and firewood. Mangrove swamps act as traps for the sediments, and sink for the nutrients. The root systems of the plants keep the substrate firm, and thus contribute to a lasting stability of the coast (Kathiresan, Narayanasamy, 2005).
The economic valuation of ecosystem goods and services (Costanza, d’Arge, de Groot, 1997; Costanza, Folke, 1997) highlights the annual value of the ecosystem services of the terrestrial and aquatic biomes of the world in the range of US$16–54 trillion with an estimated average of US$33 trillion. This value was found to be 1.8 times higher than the current gross national product (GNP) value for the world. About 62% of the estimated values of ecosystem services were found to be contributed by the marine ecosystems, while about 38% of the estimated values were found to be contributed by the terrestrial ecosystems, mainly from the forests and wetlands. A detailed socio-economic valuation of various direct, indirect and non-use values of Kali estuary in Karnataka and Cochin estuary in Kerala (Thomson, 2003) revealed aggregate value from the traditional, modern, recreational and non-use values was found to be Rs. 44380 lakhs (ten lakhs is equivalent to one million) for Cochin estuary while for Kali estuary it was found to be Rs. 1163.56 lakhs.
The mangrove vegetation also plays a vital role in the coastal resources, thereby contributing an important part towards our socio-economic development. Mangroves are sources of highly valued commercial products and fishery resources and also as sites for developing a burgeoning eco-tourism (Kathiresan, Narayanasamy, 2005; Prakash, Subhashchandran, Ramachandra, 2010). The biodiversity protected and supported by mangroves include a wide range of creatures, ranging from bacteria, and fungi, insects, a variety of fish, prawns, shrimps, etc., to a variety of birds along with a variety of flora – sea weeds, small plants and creepers (Hirway, Goswami, 2007). The damage cost avoided due to mangroves in villages was estimated as 116.28 US$/household while the land accretion function was estimated to be 983795.7 US$ over a period of 111 years. The overall value of benefits (use and non-us values) generated by mangroves in Gujarat was about Rs 2246.93 crores per year (Hirway, Goswami, 2007). The total economic value of the mangrove ecosystem in Rekawa lagoon, Srilanka show the value generated per hectare per year ass 18570 Rs/ha/year (lagoon fishery), 34,500 Rs/ha/year (coastal fishery) and 1500 Rs/ha/year respectively (Gunawardena, Rowan, 2004). The services such as buffer against storm and erosion control of mangroves was calculated using replacement cost approach and reached the value of 21000 Rs/ha/year. The existence bequest and option value to local community was estimated as 181.2 Rs/ha/year. The Net Present Value of 400 ha mangrove area of Tha Po village by calculating the direct benefit through wood and non-timber forest products and indirect benefits like off-shore fishery linkages and coastline protection. Based on the estimated net income from mangrove products, the total annual value of the 400 ha of mangrove forest was $88 per ha. and the annualized value of coastline protection was estimated using replacement coast method and the value was $3697 /ha. The net present value for 20 year period with 15 % discount rate was obtained as US $ 632.27 /ha and including indirect use values it was US$ 27,264 - 21,610 /ha. (Sathirathai, Barbier, 2001). Economic analysis of twelve year mangrove plantation had carried out in the Gazy bay in Kenya show the net value of extractable wood products from the plantation at US$ 379.17/ha/yr. For non-extractable products, the net value ranged from US$ 44.42/ha/yr in carbon sequestration to US$ 770.23/ha/yr for research and education. The total economic value of 12 yrs old Rhizophora plantation is therefore US$2902.87/ha/yr. An economic valuation mangrove resource utilization study of Gaz and Hara delta located in South Iran computed the total economic value as 10000-20000 US$/ha/year (Ghasemi, Mola-Hoveizeh, Zakaria, et al., 2012).
The economic valuation of Aghanashini estuary based on bivalve production (Boominathan, Subhash chandran, Ramachandra, 2008) reveals the revenue generation of 57.8 million per year, fishing in open estuary generates 497990 man days of work and the per capita income was 56695 Rs annually (Bhat, Subhashchandran, Ramachandra, 2010). The integrated value of goods - tangible goods like fish, salt, shrimp culture, bivalve food, mangrove fodder, lime and sand mining estimated for the estuary from 4801 ha was Rs.142.98 Crore/year (Note: One crore: 10 million). The tangible goods value Rs /ha/year was 2,97,813 (Prakash, Subhashchandran, Ramachandra, 2010). The NPV of total direct benefit of Ashtamudi estuary was about 1928 million Rs (Anoop, Suryaprakash, Umesh, et al., 2008). The clam bed is located in the Aghanashini estuary at Tadri and this bed comprises of Meretrix meretrix and Mretrix casta. The adjacent bed is about 5 kms from the barmouth and extends from opp. Betkuli to near Mirjan and covers an area of 225 ha. Meretrix casta and Villorita cyprinoides occur in this bed. A third bed is located in the centre of the estuary in Mirjan-Hegde area and it contains only V. cyprinoides. Meretrix casta and Villorita cyprinoides occur in this bed. The total annual production is 755 t and M.casta constitutes more than 60%. The production of V. cyprinoides is only 5 t. The estimated annual effort in man days is 23000 and fishing is by handpicking. Shell deposits are exploited about 7600 tons annually from the Tadri area and utilized for industrial purposes. Mining of mollusc shells is a flourishing business in Tadadi village, where shells worth about Rs.40-50 million are gathered and transported to far away cities for making poultry feed and for many other industrial uses (Bhat, Subhashchandran, Ramachandra, 2010).
1.1 Ecosystem goods and services: Ecosystem provides various vital benefits such as food; soil production, erosion and control; climate regulation; water purification; bioenergy, etc. these benefits and services are referred to as ‘ecosystem services’ and are very crucial for the survival of humans and other organisms on the earth. The ecosystems, if in a good condition perform functions which are of bio-geophysical in nature. These functions result in the flow of various services and benefits for humans and their society (Ramachandra, Soman, Ashwath, et al., 2017; MEA, 2005). Ecosystem functions can be defined as ‘the capacity of natural processes and components to provide goods and services that satisfy human needs, directly or indirectly’ (de Groot, Vander Meer, 2010; MEA, 2005). Millennium Ecosystem Assessment defines ecosystem services as the benefits people obtain from ecosystems. It includes provisioning services such as food and water, regulating services such as flood and disease control, cultural services such as spiritual, recreational and cultural benefits, and supporting services such as nutrient cycling that maintains the conditions for life on earth (MEA, 2005). The ecosystem goods and services are distributed (Fischlin, Midgley, Price, et al., 2007; Hassan, Scholes, Ash, 2005; MEA, 2005; Ramachandra, Soman, Ashwath, et al., 2017; Wilson, Farber, 2005) into four different categories as (i) provisioning services (Table 1), (ii) regulating services (Table 2), (iii) supporting services (Table 3) and (iv) cultural services (Table 4).
Table 1: Provisioning services provided by the estuaries
|
Provisioning Services |
Provision of natural resources and raw materials |
|
|
Water supply |
Filtering, retention, and storage of water |
Provision of potable water and water purification Medium for transportation and ports Provision for irrigation and industrial use |
|
Food |
Edible plants and animals Arable land |
Hunting, fishing, crops, grazing, and aquaculture |
|
Raw materials |
Building and manufacturing |
Lumber, skins, plant fibers, oils, dyes, etc. |
|
Fuel and energy |
Fuel wood and organic matter |
|
|
Fodder and fertilizer |
Leaf litter, salt hay, excrements, etc. |
|
|
Genetic resources |
Genetic resources |
Variety of gene pools in fish species |
|
Medicinal and plant resources |
Biological and chemical substances for use in agriculture and human treatment |
Medicines and pest control chemicals obtained from estuarine dependent species |
|
Ornamental resources |
Resources for fashion, handicraft, jewelry, pets, worship, decoration, and souvenirs |
Shells used as jewelry Dried grasses |
Table 2: Regulating services provided by the estuaries
|
Regulating services |
Maintenance of essential ecological processes and life support systems |
|
|
Gas regulation |
Regulation of the chemical composition of the atmosphere and oceans |
Biotic sequestration of CO2 Vegetative absorption of VOCs |
|
Climate regulation |
Regulation of local and global energy balance and hydrological cycle, and other biologically mediated climate processes |
Direct influence of land cover on temperature, precipitation, wind, humidity, etc. |
|
Disturbance regulation |
Dampening of environmental fluctuations/disturbance |
Storm protection (e.g., by barrier islands) Flood protection (e.g., by wetlands and forests) |
|
Soil retention |
Erosion control and sediment retention |
Prevention of soil loss by wind, wave action, runoff, or other removal processes from wetlands and barrier islands |
|
Waste Assimilation |
Removal or breakdown of nutrients and compounds |
Pollution detoxification and sequestration Water purification |
Table 3: Supporting services provided by the estuaries
|
Supporting services |
Ecosystem structures and functions that are essential to the delivery of ecosystem services |
|
|
Nutrient cycling |
Storage, processing, and acquisition of nutrients |
Net Primary Productivity |
|
Soil formation |
Capture of sediments and accumulation of organic matter |
Formation of wetlands substrate and soils |
|
Biological regulation and Biodiversity |
Species interactions, including pollination |
Control of pests and diseases, Reduction of herbivory, Pollination of wetlands plants |
|
Habitat |
The physical place where organisms reside |
Refugium for resident and migratory species, Spawning and nursery grounds for shrimp and other fish |
|
Hydrological cycle |
Movement and storage of H2O through the biosphere |
Aquifer recharge Maintain salinity gradients |
Table 4 : Cultural services provided by the estuaries
|
Cultural Services |
Enhance emotional, psychological and cognitive well being |
|
|
Recreation |
Opportunities for rest and enjoyment |
Ecotourism, bird watching, outdoor sports, beach going, fishing, etc. |
|
Aesthetic |
Enjoyment of landscape and its elements |
Coastal beaches and wetlands, added value to coastal housing Clean water |
|
Science and education |
Development of knowledge |
A “natural field laboratory” for understanding coastal biological and physical processes |
|
Spiritual and historic |
Spiritual or historic information |
Use of estuaries as motif in books, film, painting, folklore, national symbols, architecture, advertising, etc. |
|
Natural features with religious or historic |
||
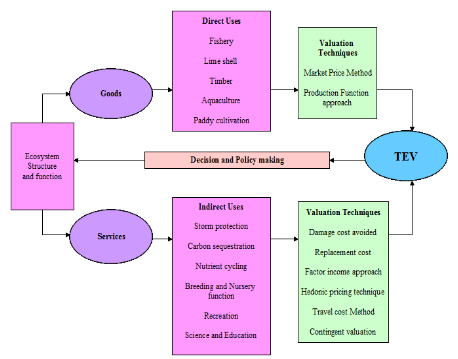
Estuarine and coastal ecosystems are the vulnerable natural systems globally (Barbier, Hacker, Kennedy, 2011) with the intense anthropogenic stress. The population and development pressures that estuarine areas are now experiencing raise significant challenges for planners and decision makers (Wilson, Farber, 2005). The deterioration due to human activities is severe and increasing; 50% of salt marshes, 35% of mangroves, 30% of coral reefs, and 29% of sea grasses are either lost or degraded worldwide (MEA, 2005). The loss of biodiversity, ecosystem functions, and coastal vegetation in estuarine and coastal ecosystems have contributed to biological invasions, declining water quality, and decreased coastal protection from flooding and storm events (Barbier, Hacker, Kennedy, 2011). There are numerous alternative uses of ecosystem functions and services. To choose from among these competing options, it is important to know not only what ecosystem goods and services will be affected but also what they are actually worth to different members of society (Barbier, Hacker, Kennedy, 2011; Costanza, d’Arge, de Groot, 1997; Costanza, Folke, 1997). Efforts to assess and quantify all the benefits associated with coastal ecosystem goods and services, would aid in the policy and managerial decisions in favor of environmentally prudent practices (Barbier, Hacker, Kennedy, 2011). Economic valuation helps to compare the real costs and benefits of ecosystem use and degradation, and allows more balanced decision-making concerning the protection and renovation versus degradation of wetlands. This facilitates optimal decision-making which maximizes societal welfare (Turpie, Lannas, Scovronik, et al., 2010; Ramachandra, Setturu, Rajan, 2017; Ramachandra, Rajinikanth, 2003; Ramachandra, Kiran, Ahalya, 2002). Figure 1 illustrate an integrated framework for assessing the ecosystem goods and services considering a limited number of ecosystem functions which, in turn provide the goods and services that are valued by humans (Costanza, d’Arge, de Groot, 1997; Costanza, Folke, 1997; MEA, 2005; Ramachandra, Soman, Ashwath, et al., 2017). The ecosystem functions can be broadly classified into four different functions namely – regulation, production, habitat and information. The value of the ecosystem functions, goods and services can be roughly divided into three types – ecological (determined by the integrity of the regulation and habitat functions), socio-cultural (identifies vital environmental functions, physical and mental health, education, cultural diversity and identity (heritage value), freedom and spiritual values) (Costanza, d’Arge, de Groot, 1997; Costanza, Folke, 1997; MEA, 2005; Ramachandra, Soman, Ashwath, et al., 2017) and economic values (willing to give up in other goods and services in order to obtain a good, service, or state of the world) (Ramachandra, Rajinikanth, 2003; Ramachandra, Kiran, Ahalya, 2002; Ramachandra, Setturu, Rajan, 2017; Ramachandra, Soman, Ashwath, et al., 2017; Turpie, Lannas, Scovronik, et al., 2010).
Figure 1: Assessment of ecosystem goods and services
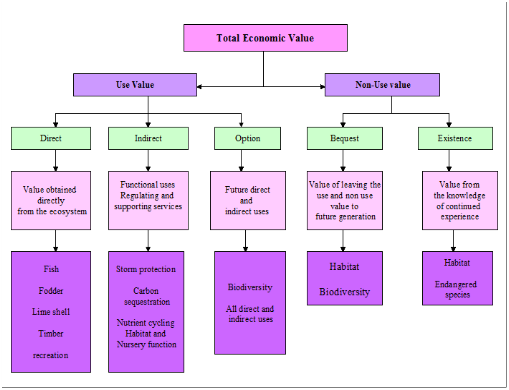
1.2 Total Economic Value (TEV) Framework: Figure 2 outlines the framework for valuation of the total economic values (TEV), which is the sum of all the benefits that are attributable to the estuarine ecosystem (UNEP/GEF, 2007; UNEP, 2013; TEEB, 2011). The total economic value is composed of (i) use value (UV) and (ii) non-use value (NUV). Use value to humans consists of direct (the tangible or physical aspects of such resources, which can either undergo physical processing or provide direct (personal) utility or satisfaction and which have direct market prices for quantification (Ramachandra, Soman, Ashwath, et al., 2017; UNEP/GEF, 2007; UNEP, 2013; TEEB, 2011), indirect (consist of the various functions that a natural system may provide, such as shoreline protection functions, carbon sequestration, and nutrient or contaminant retention (UNEP/GEF, 2007; UNEP, 2013; TEEB, 2011).This is related to the change in the value of production or consumption of the activity or property that it is protecting or supporting) and option value (a special category of value, which arises because of an individual’s uncertainty about his or her future demand for a specific resource, or the availability of this resource in the future (UNEP/GEF, 2007; UNEP, 2013; TEEB, 2011) and often considered as a “use” value since it still relates to future direct or indirect use of the resource (Barbier, Hacker, Kennedy, 2011; Ramachandra, Soman, Ashwath, et al., 2017). Quasi-option value is related to option value such that there is still willingness to pay by the individual for the preservation of the resource, but instead of worrying about its future use, the preservation is for the value that it can presently provide (UNEP/GEF, 2007; UNEP, 2013; TEEB, 2011). Direct-use values can be consumptive or non-consumptive and are commonly derived from goods and services by the inhabitants of the ecosystem whereas Indirect-use values are those that are more functional, the benefits of which often extend away from the ecosystem itself and are not consumed. Figure 2 outlines an economic valuation approach to valuing estuarine ecosystems. Non-use values of an ecosystem are bequest subset of non-use value that results from an individuals’ willingness to pay for the preservation or conservation of a resource so that future generations will still be able to reap its benefits (Ramachandra, Soman, Ashwath, et al., 2017; UNEP/GEF, 2007; UNEP, 2013; TEEB, 2011) and existence values related to aesthetic, cultural, and moral aspects that a resource may have in that it is the value that an individual places on the resource because of the satisfaction that he or she derives from merely knowing that the resource, ecosystem or species exists, regardless of whether it will be used or not (UNEP/GEF, 2007; UNEP, 2013; TEEB, 2011).
Figure 2: Framework for economic valuation of estuarine ecosystems
1.3 Techniques for quantification of ecosystem goods and services: The economic valuation methods for ecosystem goods and services are broadly grouped into four basic types – (i) direct market valuation (use of market price to value the resources that are marketed and can be used directly and indirectly (UNEP/GEF, 2007; UNEP, 2013; TEEB, 2011). The values of both extractive and non-extractive uses are based on market price (accounting price), which can be quantified and monetized from the direct use of the coastal ecosystem (ii) Indirect market valuation (assessing the values can be used to establish the Willingness To Pay (WTP) or Willingness To Accept compensation (WTA) for the availability or loss of these services (Barbier, Hacker, Kennedy, 2011; Ramachandra, Soman, Ashwath, et al., 2017). This includes various techniques like Avoided Cost (AC) method, Replacement Cost (RC) method, Factor Income (FI) method, Hedonic Pricing (HP) method and Travel Cost (TC) method (Barbier, Hacker, Kennedy, 2011; Costanza, Folke, 1997; Costanza, d’Arge, de Groot, 1997; Ramachandra, Soman, Ashwath, et al., 2017), (iii) Contingent valuation (economic values for non–marketed goods, such as environmental assets, amenities, and services are estimated through surveys to ascertain respondents’ preferences regarding an increase or decrease in the level of environmental quality (UNEP/GEF, 2007; UNEP, 2013; TEEB, 2011). The preferences are valued through surveys to ascertain willing to pay for the preservation or improvement of a certain resource or environment or to accept payment for doing away with said resources or environment, (iv) group valuation (based on principles of deliberative democracy and the assumption that public decision making should result, not from the aggregation of separately measured individual preferences, but from open public debate) (Barbier, Hacker, Kennedy, 2011; Costanza, Folke, 1997; Costanza, d’Arge, de Groot, 1997; Ramachandra, Soman, Ashwath, et al., 2017) and Benefit transfer method (of using values estimated for an alternative policy context or site as a basis for estimating a value for the policy context or site in question (Barbier, Hacker, Kennedy, 2011; Ramachandra, Soman, Ashwath, et al., 2017) Benefit transfer technique is an easy approach involving (i) identifying resources or services to be valued, (ii) identifying relevant existing studies, (iii) evaluating applicability and (iv) conducting the benefit transfer. This method is used for damage assessment, where there is a need of existing estimate of value of the natural resource or services provided by the resource. The main objective of the current communication is to estimate the total economic value of Aghnashini estuarine ecosystem of Uttara Kannada in order to enhance natural resource productivity through prudent managment. This includes (i) estimating value of provisioning services; and (ii) estimating the value of indirect products and services of the estuarine ecosystem such as regulating, supporting and information services.
2.0 MATERIALS AND METHOD
2.1 Study Area: The Uttara Kannada district lies in the mid-western part of Karnataka state between 7409' to 75010' E and 13055' to 15031' N extending over an area of 10,291 sq.km (figure 3). It extends from north south to a maximum of 180 km, and from west to east a maximum width of 110 km. It is surrounded by Belgaum district and Goa territory in the north, Dharwad in the east, Shimoga and parts of Daskshina Kannada in the south and the Arabian Sea to the west. Uttara Kannada district is one of the northernmost districts in Karnataka State (Ramachandra, Vinay, Bharath, et al., 2018; Ramachandra, Bharath, Vinay, 2018; Ramachandra, Sincy, Asulabha, et al., 2018). The topography of the region can be divided into three distinct zones. The coastal zone, comprising of a narrow strip of the coastline, is relatively flat and starts sloping gently upwards towards the east (Deepthi, Subashchandran, Joshi, et al., 2017). The ridge zone abruptly rises from the coastal strip, is much more rugged and is a part of the main range of the Western Ghats. The coastal Uttara Kannada consists of five taluks namely Karwar, Ankola, Kumta, Honnavar and Bhatkal from north to south and has a total area of 3300 sq.km. This study describes the ecological goods and services obtained from the Aghanashini estuary in Uttara Kannada district (Ramachandra, Bharath, Subashchandran, et al., 2018; Ramachandra, Vinay, Subashchandran, 2018).
Figure 3: Aghanashini estuary, Uttara Kannada district, Karnataka, India
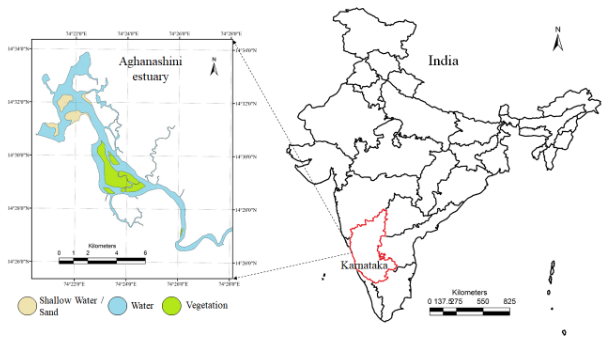
Aghanashini Estuary - Aghanashini River has its source in the forest clad village Manjguni situated at an altitude of about 600 m in the central Western Ghats. Running its course of about 121 km, winding through gorges flanked with evergreen forests and valleys lush with spice gardens and rice fields, the river widens into an estuary covering about 4801 ha before its confluence with the Arabian Sea in the west coast between the villages Aghanashini in the south and Tadadi in the north, lies between 14.391° to 14.585° N and 74.304° to 74.516° E of Kumta taluk (Deepthi, Subashchandran, Joshi, et al., 2017) in the Uttara Kannada district of central west coast in the Karnataka State of India (Figure 3). All along its estuarine banks and few of the tiny islands are villages whose inhabitants mainly are traditionally dependent on agriculture and fisheries. There are about 21 villages of Kumta taluk situated on the estuarine banks.
2.2 Methods: The secondary data was obtained from various sources for assessing the resource availability and consumption scenarios in the five estuaries. Field survey were carried out regarding the fish resources, sand mining and salt production in the estuaries. This involved actual measurements (quantifications) and discussions with the local people. The secondary data regarding the ecological functions of the estuaries was collected from Central Marine Fisheries Research Institute (CMFRI) centres of Cochin and Karwar; Department of Marine Biology, Karnatak University, Karwar; Cochin University of Science and Technology, Biodiversity portal (Sahyadri, 2018). The socio-economic data related to the coastal taluks including the villages around the estuaries were obtained from 2001 Census Report, Govt. of India; District Administrative Reports, Govt. of Karnataka. The data regarding the production of Gazani paddy and Coconut in the estuarine region was obtained from Karnataka State Horticulture Department. The direct and indirect values obtained from the estuaries were calculated.
Table 5: Economic values assigned to different indirect ecosystem services
|
FUNCTION |
COUNTRY/ REGION |
TECHNIQUE USED |
UNIT (Rs/Hectare) |
References |
|
Regulating services |
||||
|
Erosion control |
Gujarat |
Damage cost avoided |
137606
|
Hirway, Goswami, 2007; Prakash, Subhashchandran, Ramachandra, 2010 |
|
Flood control |
Srilanka |
Replacement cost |
158249.67 |
Barbier, Hacker, Kennedy, 2011; Gunawardena, Rowan, 2004; Sathirathai, Barbier, 2001; |
|
Storm protection |
Srilanka |
Replacement cost |
45000 |
Kathiresan, Narayanasamy, 2005; de Groot, Vander Meer, 2010 |
|
Nutrient retention |
Orissa |
Replacement cost |
11034.5 |
Costanza, d’Arge, de Groot, 1997; Costanza, Folke, 1997; de Groot, Vander Meer, 2010 |
|
Disturbance regulation |
Global |
Benefit transfer |
25515 |
Costanza, d’Arge, de Groot, 1997; Costanza, Folke, 1997; de Groot, Vander Meer, 2010 |
|
Waste treatment |
Global |
Benefit transfer |
301320 |
Costanza, d’Arge, de Groot, 1997; Costanza, Folke, 1997 |
|
Nutrient cycling |
Global |
Benefit transfer |
949500 |
Barbier, Hacker, Kennedy, 2011; Costanza, d’Arge, de Groot, 1997; Costanza, Folke, 1997; de Groot, Vander Meer, 2010 |
|
Carbon sequestration |
Ashtamudi estuary, Kerala |
Damage cost avoided |
9110.2
|
Anoop, Suryaprakash, Umesh, et al., 2008; Barbier, Hacker, Kennedy, 2011; Costanza, d’Arge, de Groot, 1997; Costanza, Folke, 1997; de Groot, Vander Meer, 2010 |
|
Gas regulation |
Global |
Benefit transfer |
9600 |
Barbier, Hacker, Kennedy, 2011; Costanza, d’Arge, de Groot, 1997; Costanza, Folke, 1997; Fischlin, Midgley, Price, et al., 2007 |
|
Climate regulation |
Global |
Benefit transfer |
4800 |
Barbier, Hacker, Kennedy, 2011; Costanza, d’Arge, de Groot, 1997; Costanza, Folke, 1997; Fischlin, Midgley, Price, et al., 2007 |
|
Oxygen provision |
Global |
Benefit transfer |
5280 |
Barbier, Hacker, Kennedy, 2011; Costanza, d’Arge, de Groot, 1997; Costanza, Folke, 1997; Fischlin, Midgley, Price, et al., 2007 |
|
water regulation |
Global |
Benefit transfer |
209088 |
Barbier, Hacker, Kennedy, 2011; Fischlin, Midgley, Price, et al., 2007 |
|
water supply |
Global |
Benefit transfer |
145920 |
Barbier, Hacker, Kennedy, 2011; Fischlin, Midgley, Price, et al., 2007 |
|
Ground water recharging |
Global |
Benefit transfer |
192000 |
de Groot, Vander Meer, 2010; Fischlin, Midgley, Price, et al., 2007; Barbier, Hacker, Kennedy, 2011; Hassan, Scholes, Ash, 2005; MEA, 2005 |
|
Natural hazard mitigation |
Global |
Benefit transfer |
9600 |
Ramachandra, Kiran, Ahalya, 2002; Ramachandra, Rajinikanth, 2003; UNEP, 2013; UNEP/GEF, 2007 |
|
Supporting functions (Sahyadri, 2018) |
||||
|
Habitat/refugia |
Global |
Benefit transfer |
5895 |
Costanza, d’Arge, de Groot, 1997; Costanza, Folke, 1997; de Groot, Vander Meer, 2010 |
|
Breeding ground and Nursery |
Thailand |
Benefit transfer |
5271.3
|
Costanza, d’Arge, de Groot, 1997; Costanza, Folke, 1997; de Groot, Vander Meer, 2010 |
|
Biodiversity |
Global |
Benefit transfer |
216000 |
Costanza, d’Arge, de Groot, 1997; Costanza, Folke, 1997; de Groot, Vander Meer, 2010 |
|
Information Functions (Sahyadri, 2018) |
||||
|
Recreation |
Global |
Benefit transfer |
17145 |
Barbier, Hacker, Kennedy, 2011; Costanza, d’Arge, de Groot, 1997; Costanza, Folke, 1997; de Groot, Vander Meer, 2010 |
|
Cultural and artistic |
Global |
Benefit transfer |
1305
|
Bann, 2003; Barbier, Hacker, Kennedy, 2011; Costanza, d’Arge, de Groot, 1997; Costanza, Folke, 1997; UNEP, 2013; NEP/GEF, 2007; TEEB, 2011; |
|
Aesthetic |
Global |
Benefit transfer |
100 |
Barbier, Hacker, Kennedy, 2011; Costanza, d’Arge, de Groot, 1997; Costanza, Folke, 1997 |
|
Science and Education |
Kenya |
Research funds |
34660.35
|
Bann, 2003; Barbier, Hacker, Kennedy, 2011; Costanza, d’Arge, de Groot, 1997; Costanza, Folke, 1997; UNEP, 2013; NEP/GEF, 2007; TEEB, 2011 |
Market valuation technique was employed for valuing the goods and services having direct market prices such as fishing, gazani (salt tolerant) paddy cultivation, timber and fodder obtained from the mangrove vegetation, aquaculture, sand and lime shell mining, navigation, ferry services and port activities. The market price values were assigned to these goods based on the interaction with the locals residing in that region. The gross revenues obtained from these resources were obtained as per the equation 1.
Net benefit from the fisheries = Total fish production in the estuary (tons) x Price per ton
Net income from mining/agriculture products = Σ (P Q) ……1
Where, P = price of the product; Q = quantity of the product
Besides providing the direct use value goods, the estuaries also provide various other important benefits such as climate regulation, shoreline stabilization, natural hazard mitigation, habitat and refugia for various organisms, nutrient circulation, recreation and aesthetic benefits, etc. CVM (Contingent Valuation Method) was adapted to survey indirect values obtained from an ecosystem which is based on the people’s Willingness to Pay (WTP) for it. For the current valuation study, the values for the indirect ecosystem services were adapted from the published literatures (Ramachandra, Soman, Ashwath, et al., 2017; Bann, 2003; Barbier, Hacker, Kennedy, 2011; Costanza, d’Arge, de Groot, 1997; Costanza, Folke, 1997; UNEP, 2013; NEP/GEF, 2007; TEEB, 2011). The values were given in US dollars which were converted into Indian Rupees (INR) given in Table.5.
The direct, indirect and recreational benefits obtained from the estuaries were summed up together to obtain the Total Economic Values (TEV) of the ecosystem as per the equation 2. This value is divided by the total geographical area of the estuary to arrive at the per hectare value of the estuary as a natural resource. These economic values can be considered as underestimates as the natural ecosystems are much more worth in terms of the benefits they provide. The valuation of natural resources is useful for policy formulations and decision making.
Total Economic Value = Direct use value +Indirect use Value …..2
3.0 RESULT S AND DISCUSSION
The present study focused on accounting the economic value of Aghanashini estuary located in the Uttara Kannada district of Karnataka State. The estuary has been providing a variety of living and non-living resources to the local communities which offer employment, income, amenities and pleasure. Apart from the direct benefits these ecosystem provides many indirect benefits to surrounding communities. However, the decision makers have not considered the significance of this precious ecosystem evident from the unplanned developmental activities. The current tudy is an attempt to highlight the economic importance of the estuarine ecosystem in Uttara Kannada.
3.1 Demarcation of study area and
characterization of ecosystem goods
and services from the estuarine
ecosystem:
The Aghanashini estuary is the largest
estuary in Uttara Kannada having 4801 ha
of total expanse and it includes the
101.6 ha of mangrove area. Aghanashini
supports 64709 peoples (6000-7500
families). Major goods and services from
the estuaries were compiled through
field investigations, literature survey
and discussion with local persons. These
goods and services are then classified
as per the standard protocol
(Ramachandra, Soman, Ashwath, et al.,
2017; Bann, 2003; Barbier, Hacker,
Kennedy, 2011; Costanza, d’Arge,
de Groot, 1997; Costanza, Folke, 1997;
MEA, 2005) as Provisioning Services,
Regulating Services, Supporting Services
and Information Services.
3.2 Provisioning services from Uttara Kannada estuaries
Provisioning services are estuarine fishery including the fish, finfish, shellfish and aquaculture, mining products, mangrove resources, salt production, agriculture including the saline paddy and coconut and water transport activities like ferry services, navigation and the port activities. In order to calculate the total value, the market price approach was used.
3.2.1 Estuarine fishery: The fishery sector contributes the major livelihood options of the estuarine dependent communities in the coastal villages. It includes the common estuarine fishes, clam, oyster, mussels, bivalves, prawns and aquaculture. The market price of fish and quantity obtained from each category of fish resources are given in the table 6.1. Aghanashini estuary provides the 92.93% of the income from estuarine fisheries in Uttara Kannada. The annual revenue is 4.12 billion Rs. The 94.64 percentage (3.9 billion) revenue comes from aquaculture activities in the estuarine belt. Aghanashini estuary fishes contribute 120.7 million Rs. with 2.93%. Aghanashini estuarine villages have been benefited by the bivalve collection with a total annual income of 57 million Rs. The total revenue from shell fish collection in this estuary is 73.5 million Rs. comprising of bivalves, clams, oyster, mussels and other molluscans.
Table 6.1: Estuarine fisheries value
|
Item |
Total fish catch - ton |
Price Rs /ton |
Income Rs /year |
|---|---|---|---|
|
Fishes |
12076 |
150000 |
120,762,000 |
|
Bivalves |
2851 |
200000 |
57,018,710 |
|
Clam |
76 |
15000 |
11,325,000 |
|
Oyster |
0.642 |
200000 |
128,450 |
|
Mussels |
28 |
120000 |
3,360,000 |
|
Other molluscs |
14 |
120000 |
1,673,700 |
|
Crab |
56 |
325000 |
18,200,000 |
|
Prawns |
38 |
250000 |
7,665,000 |
|
Aquaculture |
8680 |
450000 |
3,906,000,000 |
|
Total – Rs. |
4,126,132,860 |
||
3.2.2 Agriculture products: The estuarine belt of Uttara Kannada support saline tolerant paddy (gazani) and coconut cultivation. Total quantity of production and market price of coconut and paddy is given in the table 6.2. The returns from gazani paddy are highest in the Aghanashini estuarine region with a value of 43.9 million Rs.. The total agricultural production from the estuary is 49.5 million Rs. and it contributes 29.64% of the district total.
Table 6.2: Goods from Estuarine Agriculture
|
Item |
Total production (ton) |
Price Rs/ton |
Income Rs/year |
|
Gazani paddy |
2443 |
18000 |
43,977,600 |
|
Coconut |
62 |
90000 |
5,614,776 |
|
Total– Rs. |
49,592,376 |
||
3.2.3 Mining products: Mining and dredging activities are happening in the estuary of Uttara Kannada in significant level. Amount dredged and the price of unit quantity is given in the table 6.3.and these are the livelihood options for many poor people in this region. This shows it occurs in higher degree in Aghanashini. The net returns from the region are 1.2 billion Rs. annually; out of these 99.26% comes from lime shell collection only.
Table 6.3: Estimation of Revenue from Mining activities
|
Item |
Quantity extracted |
Rate (Rs/unit) |
Income (Rs/year) |
|---|---|---|---|
|
Sand (Cu.m) |
17308 |
400 |
6,923,077 |
|
Lime shell (ton) |
80000 |
15000 |
1,200,000,000 |
|
Silt(Cu.m) |
9855 |
200 |
1,971,000 |
|
Total– Rs. |
1,208,894,077 |
||
3.2.4 Mangrove products: Mangrove forest is being used by the local inhabitants as fodder for live stocks and timber for fire wood needs and construction activities. Table 6.4 lists the mangrove resources with market price and quantity. The Aghanashini contributes 31% of total mangrove product harvest of Uttara Kannada; the income is 5.4 million Rs/ year.
Table 6.4: Estimation of Net income from Mangrove product harvesting
|
Item |
Quantity produced -ton |
Price (Rs/ton) |
Net income (Rs/Yr) |
|---|---|---|---|
|
Fodder |
7200 |
600 |
4,320,000 |
|
Timber |
215 |
150 |
32,199 |
|
Charcoal |
64 |
150 |
9,660 |
|
Thatch |
322 |
2000 |
643,973 |
|
Fish poison |
6 |
1000 |
6,000 |
|
Medicine |
24 |
18000 |
432,000 |
|
Total – Rs. |
5,443,831 |
||
3.2.5 Salt from estuaries: Table 6.5 shows that salt production in the Aghanashini estuary of Uttara Kannada, which is about 5 million Rs. per year. Salt making is a traditional enterprise associated with some of the villages close to Gokarna, Aghanashini where salt pans annually produce Rs.30-40 million Rs. worth of salt (Bhat, Subhashchandran, Ramachandra, 2010).
Table 6.5: Salt production in the estuarine catchment
|
Quantity produced (ton) |
Rate Rs/ton |
Value generated Rs/year |
|---|---|---|
|
10000 |
5000 |
50,000,000 |
3.2.6 Transport: Table 6.6 gives the revenue generated from ferry services, navigation and port activities in the estuarine waters. The net income from water transport activities is highest in Aghanashini (52%). The value from ferry services is about 1.6 million Rs. Per year.
Table 6.6: Revenue from Water transport and Port activities
|
Activity |
Value generated Rs/year |
|
|
Ferry services |
200,000 |
|
|
Navigation |
80,000 |
|
|
Port activities |
1,418,000 |
|
|
Total – Rs. |
1,698,000 |
|
3.2.7 Total provisioning services: Provisioning services quantification through the compilation of all direct benefits for each estuary is given in table 7. Aghanashini make up the 79.5% (5.45 billion Rs. annually) of the district total and the value per hectare of estuary is 11,35,847 Rs. per hectare per year (Aghanashini).
Table 7: Provisioning services from Estuaries, Uttara Kannada
|
Details |
Aghanashini |
|---|---|
|
Area |
4801 ha |
|
Fishery |
4,126,132,860 |
|
Agriculture |
49,592,376 |
|
Mining activities |
1,208,894,077 |
|
Mangrove product harvest |
4,806,298 |
|
Water transport |
1,698,000 |
|
Salt production |
50,000,000 |
|
Total Value (Rs/Year) |
5,453,199,811 |
|
Production (Rs/ha/year) |
1,135,847 |
3.3 Indirect uses
The indirect uses of estuarine ecosystem
consist of the Regulating services,
Supporting services and Information
services Bann, 2003; Barbier, Hacker,
Kennedy, 2011; Costanza, d’Arge,
de Groot, 1997; Costanza, Folke, 1997;
MEA, 2005; Ramachandra, Soman, Ashwath,
et al., 2017; Sahyadri, 2018; TEEB,
2011; UNEP, 2013; NEP/GEF, 2007). Table
5 lists 23 indirect benefits provided by
estuarine ecosystem. All these services
are valued by taking the unit value of
these benefits (Rs/ha/year) from other
studies and adjusted according to the
spatial and environmental conditions of
our study region.
3.3.1 Regulating services: The regulating services of estuary ecosystem are coastal erosion control, Flood control, storm protection, carbon sequestration, disturbance regulation, gas regulation, climate regulation, water supply, waste treatment, nutrient retention and cycling, natural hazard mitigation, ground water recharging and oxygen provision. Table 8 gives the details of regulating services calculated considering the spatial extent of the estuary and unit value (Rs/ha/year). The regulating services value from total estuarine area is 8.81 billion Rs/ Year. This is mainly due to the higher mangrove cover and total area of these two estuaries. The regulating service value per hectare in Aghanashini is Rs. 2,055,250.
Table 8: Services and goods of estuaries
|
Services |
Aghanashini |
|
Coastal erosion control |
13,980,762 |
|
Flood control |
16,078,167 |
|
Storm protection |
4,572,000 |
|
Nutrient retention |
1,121,103 |
|
Disturbance regulation |
2,592,324 |
|
Waste treatment |
1,446,637,320 |
|
Nutrient cycling |
4,558,549,500 |
|
Carbon sequestration |
925,596 |
|
Gas regulation |
46,089,600 |
|
Climate regulation |
23,044,800 |
|
Oxygen provision |
25,349,280 |
|
Water regulation |
1,003,831,488 |
|
Water supply |
700,561,920 |
|
Groundwater recharging |
921,792,000 |
|
Natural hazard mitigation |
46,089,600 |
|
Total Value Rs/Year |
8,811,215,461 |
|
Production Rs/ha/year |
1,835,288 |
3.3.2 Supporting services: The supporting services selected for economic valuation are Habitat/refugium function, Nursery and breeding ground, biodiversity. The estuarine ecosystem support and provide habitat for diverse flora and fauna, serving as a pool of biodiversity. The estuary and associated mangrove ecosystem and salt pans provide the platform and conditions for breeding and spawning of many marine and fresh water fishes. Table 9 reveals that the supporting service value of Aghanashini region, which accounts to the 82.935% with the total value of 9.34 billion/year. The value per hectare from Aghanashini is 1,946,030 Rs. towards supporting services.
Table 9: Supporting services from Estuaries in Uttara Kannada
|
Services |
Aghanashini |
|
Area |
4801 ha |
|
Primary production |
8,252,265,720 |
|
Habitat/refugia |
28,301,895 |
|
Breeding ground and Nursery |
25,307,511 |
|
Biodiversity |
1,037,016,000 |
|
Total Value (Rs/year) |
9,342,891,126 |
|
Production (Rs/ha/year) |
1,946,030 |
3.3.3 Information services: The information services include recreation, cultural and artistic information, science and education and the values are given in table 10.
Table 10: Information services from Estuaries in Uttara Kannada
|
Services |
Aghanashini |
|
Area |
4801 ha |
|
Recreation |
82,313,145 |
|
Aesthetic information |
6,265,305 |
|
Science and Education |
480,100 |
|
Science and Education |
332,808,680.70 |
|
Total value (Rs/year) |
421,867,231 |
|
Production (Rs/ha/year) |
87,871 |
Aghanashini contributes the highest percentage of information services (43%). These salt pans in this region are the visiting place of migratory birds during seasons. It adds to the aesthetic and recreational potential of Aghanashini. The total value of Aghanashini is 421 million Rs/Year with a per hectare value of 87,871 Rs.
3.4 Total economic value
Total economic value is the sum of all the four services given in Table11. Aghanashini estuary is the highly productive and comparatively intact ecosystem; therefore the total economic value is 62% of total district value. The value in Rs/year is 24.03 billion and the productivity per hectare is 5 million Rs/year. Provisioning service makes up the 23% of the total value. Information service share only 2% and regulating and supporting services are 37% and 39% respectively.
Table 11: Total Economic Value of Estuarine Ecosystem in Uttara Kannada
|
Goods and Services |
Details |
Aghanashini |
Total (District) |
|---|---|---|---|
|
Total area (ha) |
4801 |
10,591, 00 |
|
|
Population |
64709 |
14,36,847 |
|
|
Provisioning services |
Total Rs/Year |
5453199811 |
6858828735 |
|
|
Production Rs/ha/year |
1135847 |
1938457 |
|
% contribution |
23 |
17.82 |
|
|
Regulating Services |
Total Rs/Year |
8811215461 |
19390691963 |
|
|
Production Rs/ha/year |
1835288 |
8586037 |
|
% contribution |
37 |
50.37 |
|
|
Supportng services |
Total Rs/Year |
9342891126 |
11264961997 |
|
|
Production Rs/ha/year |
1946030 |
3143402 |
|
% contribution |
39 |
29.27 |
|
|
Information Services |
Total Rs/Year |
421867231 |
978291729 |
|
|
Production Rs/ha/year |
87871 |
371400 |
|
% contribution |
2 |
2.54 |
|
|
Total Economic Value |
Total Rs/Year |
24,029,173,629 |
38,492,774,424 |
|
|
Production Rs/ha/year |
5,005,035 |
3,634,480 |
4. CONCLUSION
Ecological systems play a fundamental role in supporting life and sustaining the natural reources. Most of the natural ecosystems are rapidly disappearing as a result of the pressure of population growth and economic development. In order to formulate sustainable natural resource use policy and measures, valuation of the uses of these ecosystems becomes essential, This will help resource managers deal with the effects of market failures, by measuring their cost to society, which otherwise are generally hidden from the traditional economic accounting. The present study provides an account of the resource potential of Aghanashini estuary of Uttara Kannada district, Karnataka state, India. Aghanashini estuary is the highly productive and comparatively intact ecosystem; the total economic value is 62% of total district value. The total economic value for Aghanashini is 24.02 billion Rs/ year and the annual value per hectare is 5 million Rs/ heactare/year. This highlights that estuaries of Uttara Kannada have been sustaining the economy of the district in a significant manner with the job potential. Majority of people living around the estuary earns livelihood from this estuaries. Decline in the environmental quality of these ecosystems necessitates the concerted effort to conserve the estuary in a sustainable manner with the active participation of native people. This also emphasizes the need for green GDP (Gross domestic product) with the accounting of ecosystem goods and services to ensure the sustainability of natural resources (water, energy, land, etc.).
REFERENCES
- Anoop, P., Suryaprakash, S., Umesh, K.B. & Amjath Babu, T.S. (2008). Economic valuation of use benefits of ashtamudi estuary in south India, In Proceedings of the Taal 2007: The 12th World Lake Conference, edited by M. Sengupta and R. Dalwani, 1822–26. http://moef.nic.in/modules/recent-initiatives/nlcp/Indian%20Case%20Studies/Q-7.pdf.
- Bann, C. (2003). An economic analysis of alternative mangrove management strategies in Koh Kong province, Cambodia. Ecological Monographs, 81(2), 2011, pp. 169–193
- Barbier, E. B., Hacker, S. D., Kennedy, C., Koch, E.W., Stier, A. C. & Silliman, B.R. (2011). The value of estuarine and coastal ecosystem services, Ecological monographs, 81(2): 169-193.
- Bharath, H.A., Vinay, S. & Ramachandra. T.V. (2018). Simulating urban growth by two state modelling and connected network. Modeling Earth Systems and Environment, https://doi.org/10.1007/s40808-018-0506-1
- Bhat, M., Subashchandran, M.D. & Ramachandra, T.V. (2010), Fish diversity and distribution dynamics in relation to salinity gradients and fisheries in Aghanashini estuary, Kumta, Uttara Kannada, Karnataka state, Lake2010: Wetlands, Biodiversity and Climate change. http://wgbis.ces.iisc.ac.in/energy/lake2010/Theme%201/mahima_b.pdf
- Boominathan, M., Subashchandran, M.D. & Ramachandra, T.V. (2008). Economic valuation of bivalves in the Aghanashini estuary West coast, Karnataka, ENVIS Technical report: 30, Centre for Ecological Sciences, Indian Institute of Science, Bangalore, India, 58p.
- Costanza, R. & Folke, C. (1997). Valuing ecosystem services with efficiency, fairness, and sustainability as goals. In G.C. Daily (ed.) Nature’s Services, 49–68. Washington, D.C. Island Press.
- Costanza, R., d’Arge, R., de Groot, R., Farber, S., Grasso, M., Hannen, B., Limbyrge, K., Nacem, S., V.O’Neill, R., Paruelo, J., Raskin, R.G., Raskin, P.G., Sutton, P. & Belt, M.V. (1997). The value of the World’s ecosystem services and natural capital. Ecological Economics, 38: 555-568
- de Groot, R. S. & Vander Meer, P. J. (2010). Quantifying and valuing goods and services provided by plantation forests In: Ecosystem goods and services from plantation forests, Earth scan publishers, London. Pp: 17-19.
- Deepthi Hebbale, Subashchandran, M. D., Joshi, N. V. & Ramachandra T. V. (2017). Energy and food security from macroalgae. J Biodiversity, 8(1): 1-11 DOI: http://10.1080/09766901.2017.1351511
- Fischlin, A., Midgley, G.F., Price, J.T., Leemans, R., Gopal, B., Turley, C., Rounsevell, M.D.A., Dube, O.P., Tarazona, J. & Velichko, A.A. (2007). Ecosystems, their properties, goods, and services. Climate Change 2007: Impacts, Adaptation and Vulnerability. Contribution of Working Group II to the Fourth Assessment Report of the Intergovernmental Panel on Climate Change, Parry, M.L., Canziani, O.F., Palutikof, J.P., vander Linden, P.J., Hanson, C.E. (Eds.), Cambridge University Press, Cambridge, 211-272.
- Ghasemi, S., Mola-Hoveizeh, N., Zakaria, M., Ismail, A. & Tayefeh, F. H. (2012). Relative abundance and diversity of waterbirds in a Persian Gulf mangrove forest, Iran, Tropical Zoology, 25(1): 39-53, DOI: 10.1080/03946975.2012.682800
- Gunawardena, M. & Rowan, J.S. (2004). Economic valuation of a mangrove ecosystem threatened by shrimp aquaculture in Sri Lanka. Environmental Management, 36(4): 535–550
- Hassan, R.M., Scholes, R. & Ash, N. (2005). Ecosystems and Human Well-Being:Current State and Trends: Findings of the Condition and Trends Working Group,Ecosystems and Human Well-being. Island Press, Washington D.C.
- Hirway, I. & Goswami, S. (2007). Valuation of Coastal Resources: The case of mangroves in Gujarat, Academic Foundation, New Delhi, 170p.
- Kathiresan, K. & Narayanasamy, R. (2005). Coastal mangrove forests mitigated tsunami. Estuarine coastal and marine science, 65: 601-606.
- MEA. (2005). Millennium Ecosystem Assessment - Ecosystems and Human Well-being: Synthesis. Island Press, Washington, DC.
- Prakash, N. M., Subashchandran, M.D. & Ramachandra, T.V. (2010). Integrated value assessment of estuarine Tangible Production: A case study of Aghanashini estuary in Uttara Kannada, Lake 2010: Wetland, Biodiversity and climate change. http://wgbis.ces.iisc.ac.in/energy/lake2010/Theme%201/T1_Oral_13_PPT.pdf
- Ramachandra T. V., Bharath Setturu & Vinay, S. (2018). Ecological sustainability of riverine ecosystems in central Western Ghats. J Biodiversity, 9(1-2): 25-42, DOI: 11.258359/KRE-159
- Ramachandra, T. V., Sincy, V., Asulabha, K. S. & Vinay, S. (2018). Assessment of physico-chemical integrity of lotic ecosystems in central Western Ghats through Multivariate Techniques. J Biodiversity, 9(1-2): 69-80, DOI: 11.258359/KRE-179
- Ramachandra, T. V., Soman, D., Ashwath, D. N. & Subashchandran, M. D. (2017). Appraisal of forest ecosystems goods and services: challenges and opportunities for conservation, J Biodiversity, 8(1): 12-33, DOI: http://10.1080/09766901.2017.1346160
- Ramachandra, T.V. & Rajinikanth, R. (2003). Economic valuation of wetlands. ENVIS Technical report:101, Centre for Ecological Sciences, Indian Institute of Science, Bangalore, India.
- Ramachandra, T.V., Bharath, S., Rajan, K.S. & Subashchandran, M.D. (2017). Modelling the forest transition in Central Western Ghats, India. Spatial Information Research, 25(1): 117-130.
- Ramachandra, T.V., Bharath, S., Subashchandran, M.D. & Joshi N. V. (2018). Salient ecological sensitive regions of central Western Ghats, India. Earth Systems and Environment. https://doi.org/10.1007/s41748-018-0040-3
- Ramachandra, T.V., Kiran, R. & Ahalya, N. (2002). Economic valuation. In: Status, Conservation and management of Wetlands, Allied publishers (p) Ltd. pp:118-125.
- Ramachandra, T.V., Vinay, S. & Subashchandran, M.D. (2018). Quantification of annual sediment deposits for sustainable sand management in Aghanashini river estuary. Journal of Environmental Management, 206: 1263-1273, https://doi.org/10.1016/j.jenvman.2017.07.060.
- Ramachandra, T.V., Vinay, S., Bharath, S. & Shashishankar, A. (2018). Eco-Hydrological footprint of a River basin in Western Ghats. YJBM: Yale Journal of Biology and Medicine [Issue Focus: Ecology and Evolution] 91: 431-444, https://www.ncbi.nlm.nih.gov/pmc/articles/PMC6302628/
- Rao, T. A. & Suresh, P.V. (2002). Coastal ecosystems of the Karnataka State, India-part 1: Mangroves, Karnataka. Association for the advancement of Science, Central College, Bangalore. pp.138-202.
- Sahyadri. (2018). Western Ghats Biodiversity Information System, http://ces.iisc.ac.in/biodiversity, accessed on 31 Dec 2018.
- Sathirathai, S. & Barbier, E.B. (2001). Valuing Mangrove Conservation In Southern Thailand, Contemporary Economic Policy, Western Economic Association International, vol. 19(2): 109-122.
- TEEB. (2011). The economics of ecosystems and biodiversity TEEB for National and International Policy Makers. http://www.teebweb.org/wp-content/uploads/2014/04/TEEB-in-national-and-international-Policy-Making2011.pdf, accessed on 31 Dec 2018.
- Thomson, K.T. (2003). Economic and social management of estuarine biodiversity in the West coast of India. EERC working paper series: MES-4, pp: 1-284
- Turpie, J., Lannas, K., Scovronik, N. S. & Louw, A. (2010).Wetland valuation volume 1: Wetland ecosystem services and their valuation: A review of current understanding and practice. Water Research commission Report No: TT440/09.South Africa, Pp:15-51.
- UNEP. (2013). Guidance Manual on Value Transfer Methods for Ecosystem Services. https://www.gwp.org/globalassets/global/toolbox/references/guidance-manual-on-value-transfer-methods-for-ecosystem-services-unep-2013.pdf, accessed on 31 Dec 2018
- UNEP/GEF. (2007). Guidelines for conducting economic valuation of coastal ecosystem goods and services. http://www.ais.unwater.org/ais/aiscm/getprojectdoc.php?docid=3543, accessed on 31 Dec 2018
- Wilson, A. M. & Farber, S. (2005). Accounting for goods and services in coastal estuaries, In: The economic and market value of coasts and estuaries: What’s at stake?, Restore Americas estuaries. pp:14-23.
|
Specific criteria based on water birds : Aghanashini Estuary abode of diverse birds |
|||||
|
Criteria 5 |
A wetland should support 20000 or more water birds |
Aghanashini estuary supports more 45000 birds (40% are migrants) |
|||
|
Criteria 6 |
A wetland should support 1% of the individuals in a population of one species or subspecies of water bird |
About 39 species have population >1% of the total population (of total sighted 130 species) |
|||
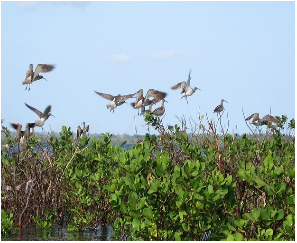
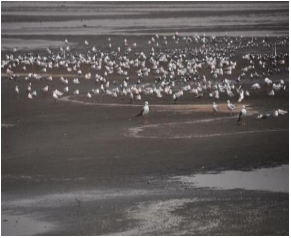
Bird diversity: Aghanashini estuary is remarkable for its bird fauna, with about 130 species recorded. About 40 per cent are migrants during winter. The estuary has several micro-habitats for birds, especially mudflats, mangroves, shallow marshes with reeds and grasses, deep open water, gazni rice fields etc. A bird species may use one or more such micro-habitats. January was noted as being the peak time for birds of the estuary, when the largest congregations happen. Aghanashini merits the status of a conservation reserve for birds for their sheer numbers and the ease with which they can be observed.
The birds can be grouped into six categories:
- Large wading birds like herons, egrets, ibises and spoonbills: Two-thirds of them feed exclusively on fishes.
- Probing shorebirds: This big group includes plovers, curlews, whimbrels, sandpipers, godwits, stints, ruffs, sanderlings, shanks, waterhens, jacanas, lapwings, stilts, moorhens, pratincoles, turnstones, avocets and curlews. In the Aghanashini estuarine area, 32 species were found, of which only 10 are resident birds.
- Floating and diving birds: Ducks, grebes, cormorants, darters and teals of 11 species. Of these, four are residents and the rest migrants during winter. Whereas cormorants and darters are piscivorous, pintails, ducks and teals are herbivorous.
- Aerially searching but water-dependent birds: Gulls, terns and kingfishers belong to this category. Of the 17 species noted, 10 are residents and the rest migrants.
- Birds of prey: Kites, eagles, shikras, ospreys, owls and kestrels are birds of prey. Among the nine species found, five are residents and four are visitors.
- Arboreal birds: Probably the largest group of diverse kinds, such as doves, cuckoos, robins, warblers, woodpeckers, flycatchers, parakeets, swallows, thrushes, orioles, sparrows, flowerpeckers, bush larks, shrikes, mynas, babblers, bulbuls, pipits, sunbirds, munias, coucals, wagtails, hoopoes, larks and ioras. Of the 49 species, only four are migrants, and the rest are local.
Estuary and Bird Diversity: Being meeting places of the land and rivers with the sea, estuaries are tremendously gifted areas with regard to their productivity, habitat diversity and richness of biodiversity. The world over, they are recognized as remarkable places for bird species. One of the important reasons for such recognition has been the variety of food resources available to meet the needs of birds, which require to feed frequently to maintain their high metabolic rates. Birds are known to congregate in places where food is plentiful (Hockey et al. 1992). As estuarine environments are favourable places for human settlements, birds specially adapted to humanized landscapes like crows, mynas, pigeons, parakeets, kites, drongos, flycatchers, bulbuls and babblers are commoner species in these areas. Because estuaries and the seashores are subjected to rising and receding tides, the intertidal areas are very favoured places for characteristic shorebirds. These include plovers, gulls, terns, sandpipers, turnstones, avocets, whimbrels, curlews, etc. They feed on intertidal invertebrates, which are exposed at low tide. Dugan et al. (2003) noted many shorebirds as feeding on insects, amphipods and isopods associated with algal mats deposited by waves on the beaches of California. Beach grooming (the practice of removing debris and seaweeds from sandy beaches) had adverse effects on shorebirds like plovers which feed on these organisms.
Dugan and Hubbard (2006) noticed that coastal armoring against rising sea levels indeed accelerated beach erosion and increased ecological impacts to sandy beach ecosystems on unprecedented scales. Mid- and upper-beach zone widths were reduced, with significant impacts on macro-invertebrates, foraging shorebirds and roosting gulls and seabirds on open beaches. In coastal and estuarine ecosystems, birds are often regarded as top predators, and fishes occupy intermediate trophic levels, both supported by large amounts of intertidal benthic macrofaunal prey. The high benthic biomass reflects extensive intertidal flats and fine sedimentary deposits. Such flats and sedimentary deposits are associated with tidal asymmetry and flocculation (Raffaelli and Hawkins 1996). As fine mud and silts provide a large surface area for accumulation of organic matter and microbial processes, intertidal mudflats are enabled to support a high invertebrate biomass, especially of deposit- and filter-feeding taxa (Fujii 2012). This benthic invertebrate biomass provides food for higher trophic levels, such as epibenthic crustaceans, fishes and shorebirds (ibid.). In north-west Europe, while migratory birds like the Brent goose, shelduck, pintail, oystercatcher, ringed plover, grey plover, bar-tailed and black-tailed godwits, curlew, redshank, knot, dunlin and sanderling are dependent on this habitat for food, the grey geese and whooper swan may utilize it for roosting (Davidson et al. 1991; Rehfisch et al. 2003). Many fishes and crustaceans also utilize the intertidal flats with the flood tide to feed. Flatfish, gobies and many other fishes, crabs and shrimps also move onto these intertidal flats to feed on the mobile epifauna and sedentary infauna (Elliott et al. 1998).
Shorebirds generally forage during the low tide and can be observed on beaches, intertidal mudflats, brackish wetlands, saltmarshes, etc. Water birds are those that entirely depend on wetlands for a variety of activities like foraging, nesting etc. Both shorebirds and water birds are important components of estuarine mudflats (Lane 1987; Norazlimi and Ramli 2015). Many winter migrant populations of shorebirds feed almost exclusively on intertidal benthic invertebrates of estuarine mudflats at low tide. The estuarine mudflats are also vital feeding habitats for resident bird populations (ibid.).
Characteristics of estuarine birds in relation to their feeding areas are of interest. The longer the leg, the deeper the mud or water depth in which the foraging birds stand. The long-legged waders (curlews, oystercatchers, etc.) walk into relatively deeper water compared with the shoter-legged turnstones, ringed plovers etc. Eddington et al. (1973) correlated the different bill lengths of wader groups to the depths of the soft substratum from which they can draw their prey. They found the bill lengths of curlews to be 11.5 cm, oystercatchers 7.3 cm, greenshanks 5.5 cm, redshanks 4.1 cm, dunlins 3.1 cm, turnstones 2.2 cm and ringed plovers 1.1 cm. The ringed plovers, short-legged and short-billed, find prey by surface picking whereas the turnstones, also short-billed, turned algal masses on the shore and turned stones to pick up the prey animals.
As increasing siltation on one side and rising sea level on the other are threatening to affect adversely estuarine mudflats and sandflats, most of the west coast estuaries of Karnataka, including Aghanashini, are being readied with defensive walls for flood protection. Considering the coastal geodynamic processes, the mudflats and sandflats of high biodiversity and bird richness are likely to suffer from more violent wave and tidal action on one side and maybe of high deposits of silt on them—both impacts likely to destroy the tidal flats and reduce the numbers of dependent birds. The study of estuarine birds, therefore, in relation to the dynamism of their habitats, rising human impacts, climatic change and conservation, requires greater efforts.
The bird diversity in Indian estuaries: Nisture and Pejaver (2002) recorded 205 species of bird from the 26 km long Thane Creek, an important bird area of the Mumbai coast. Recent station-wise detailed observations in the same creek covering only a 6 km stretch revealed 95 species (Chaudhari-Pachpande and Pejaver 2016). Of the nine IUCN Red Listed species from Aghanashini, only the black-headed ibis Threskiornis melanocephalus was common to both. Of these, 86 per cent were dependent on mangroves and mudflats. Verma et al. (2004) recorded 149 species of bird from the Mahul creek of Mumbai which is near the estuarine area of Bhayander and Naigaon (Ulhas estuary). Lad and Patil (2015) reported 131 bird species from the Ulhas estuary of Thane. Out of them 32 per cent were migratory and the rest residents. In the Bhatye estuary of Ratnagiri district in Maharashtra 113 species of bird were recorded. Of these only 16 species (14 per cent) were migratory and the rest residents or local migrants (Taware et al. 2012). Samant (1985) listed 121 species of bird occurring in the mangroves around Ratnagiri, Maharashtra. Pawar (2011) recorded 56 species of bird associated with the mangroves in the Uran estuary of Raigad district of Maharashtra coast.
THE BIRDS OF AGHANASHINI ESTUARY
Despite its avian diversity there has never been any exclusive study devoted to the birds of Aghanashini estuary. As part of a comprehensive study of the birds of Uttara Kannada district, Daniels (1988) studied the estuarine and coastal birds of the district. However, Daniels had personally communicated a list of 108 birds associated with Aghanashini estuary. We also referred to the Ph.D. thesis related to Aghanashini estuarine birds prepared by Roshmon, (2016) who also assisted in preparing the list of birds for the present work (Table 5.1). Other relevant information about these birds has been gathered from diverse sources and through field observations for the sake of this chapter. Annexure I lists the species wise number of birds sighted in the study region during the monthly survey for the period of 36 months and Annexure II lists the habitat wise sighting of species.
Table 5.1. Birds of Aghanashini estuary
|
S. N. |
Scientific Name |
Common Name |
Habitat |
Food |
IUCN |
IW Act-73 |
Migratory/ |
|
|
Foraging |
Roosting/Nesting |
|||||||
|
1 |
Phalacrocorax niger |
Little |
Waterbodies |
Mangroves |
Fish |
|
Sc IV |
Resident |
|
2 |
Phalacrocorax fuscicollis |
Indian shag |
Waterbodies |
Mangroves |
Fish |
|
Sc IV |
Resident |
|
3 |
Anhinga melanogaster |
Oriental darter |
Waterbodies |
Mangroves |
Fish, large invertebrates |
NT |
Sc IV |
Migratory |
|
4 |
Ardea cinerea |
Grey heron |
Shallow water; marshes, mangroves |
Mangroves |
Fish, molluscs, crustaceans, insects, juvenile birds |
|
Sc IV |
Resident |
|
5 |
Ardea alba |
Great egret |
Shallow water; marshes, mangroves, saltpans |
Mangroves |
Fish, crustaceans, insects |
|
Sc IV |
Resident |
|
6 |
Egretta garzetta |
Little egret |
Shallow water, marshes, meadow, reeds |
Mangroves |
Small fish, crustaceans, bivalves, insects, chicks |
|
Sc IV |
Resident |
|
7 |
Egretta intermedia |
Intermediate egret |
Shallow water, marshes, meadows, reeds |
Mangroves |
Fish, crustaceans, insects |
|
Sc IV |
Resident |
|
8 |
Egretta gularis |
Western reef egret |
Shallow water |
Mangroves |
Fish, crustaceans, molluscs |
|
Sc IV |
Resident |
|
9 |
Ardea purpurea |
Purple heron |
Reeds, marshes, mudflats, mangroves |
Mangroves |
Fish, nestling birds, crusta-ceans, snails |
|
Sc IV |
Migratory |
|
10 |
Nycticorax nycticorax |
Black- crowned night heron |
Shallow water, marshes |
Mangroves/reed beds |
Fish, crustaceans, insects |
|
Sc IV |
Resident |
|
11 |
Ardeola grayii |
Indian pond heron |
Marshy lands, shallow water |
Mangroves |
Fish, crustaceans, insects |
|
Sc IV |
Resident |
|
12 |
Bubulcus ibis |
Cattle egret |
Marshy lands, shallow water, meadows |
Mangroves |
Insects, worms, eggs and chicks |
|
Sc IV |
Resident |
|
13 |
Anastomus oscitans |
Asian openbill |
Shallow water, marshy areas |
Mangroves |
Bivalves, snails, insects, water snakes |
|
Sc IV |
Migratory |
|
14 |
Leptoptilos javanicus |
Lesser adjutant stork |
Mangroves, saltpans, mudflats |
Mangroves |
Fish, large invertebrates |
Vu |
Sc IV |
Resident |
|
15 |
Threskiornis melanocephalus |
Black-headed ibis |
Marshes, shallow water |
Mangroves |
Fish, insects |
NT |
Sc IV |
Resident/Migratory |
|
16 |
Platalea leucorodia |
Eurasian spoonbill (white spoonbill) |
Shallow to deeper water; marshes, mangroves |
Mangroves, reeds |
Small fish, molluscs, crustaceans, worms, algae |
|
Sc I |
Migratory |
|
17 |
Amaurornis phoenicurus |
Whitebreasted waterhen |
Shore, shall-ow water, reed beds |
|
Insects, small fish, molluscs, worms, seeds |
|
Sc IV |
Resident |
|
18 |
Hydrophasianus chirurgus |
Pheasant-tailed jacana |
Shallow water, reed marshes |
On shallow water plants |
Insects, invertebrates |
|
Sc IV |
Resident |
|
19 |
Metopidius indicus |
Bronze-winged jacana |
Shallow water, reed marshes |
On shallow water plants |
Insects, snails and other invertebrates |
|
Sc IV |
Resident |
|
20 |
Porphyrio porphyrio |
Purple swamp-hen |
Shallow water, reed marshes |
On shallow water plants |
Plant parts, seeds; also fish, molluscs, crustaceans, larvae, insects |
|
Sc IV |
Resident |
|
21 |
Charadrius dubius |
Little ringed plover |
Intertidal zone, mudflats, fields, marshes |
|
Shrimps, crustaceans, mussels, worms, insects |
|
Sc IV |
Migratory |
|
22 |
Charadrius hiaticula |
Common ringed plover |
Mudflats, sandflats |
|
|
|
Sc IV |
Migratory |
|
23 |
Pluvialis fulva |
Pacific golden plover |
Coastal fields, saltmarshes,sandflats, mudflats |
Same as feeding areas |
Insects, molluscs, crustaceans, worms |
|
Sc IV |
Migratory |
|
24 |
Charadrius mongolus |
Lesser sand plover |
Sandy shores, mudflats, mangroves |
|
Insects, crustaceans, worms |
|
Sc IV |
Migratory |
|
25 |
Charadrius leschenaultii |
Greater sand plover |
Shores, brackish water, mudflats/sandflats |
|
Molluscs, snails, curstaceans |
|
Sc IV |
Migratory |
|
26 |
Charadrius alexandrinus |
Kentish plover |
Open flats, nearby fields, saltpans |
|
Polychaetes, crabs and other crustaceans, insects, molluscs |
|
Sc IV |
Migratory |
|
27 |
Vanellus indicus |
Red-wattled lapwing |
Open areas near water |
On ground, amid pebbles |
Insects, snails, crustaceans, other invertebrates, grains |
|
Sc IV |
Resident |
|
28 |
Limosa limosa |
Black-tailed godwit |
Saltmarsh, mudflats |
|
Polychaetes, crustaceans, insect larvae, fish eggs |
NT |
Sc IV |
Migratory |
|
29 |
Limosa lapponica |
Bar-tailed godwit |
Intertidal muddy shores, man-groves, tidal mudflats, sandbars |
|
Annelids, bivalves, crustaceans, small fish |
NT |
Sc IV |
Migratory |
|
30 |
Numenius arquata |
Eurasian curlew |
Mudflats/sandflats, man-groves, saltmarshes, meadows |
|
Annelids, insects, crustaceans, molluscs |
NT |
Sc IV |
Migratory |
|
31 |
Numenius phaeopus |
Whimbrel |
Mudflats/sandflats, mangroves, marshes |
|
Small crabs, other crustaceans, polychaetes |
|
Sc IV |
Migratory |
|
32 |
Philomachus pugnax |
Ruff |
|
|
Crustaceans, molluscs, small fish, insects |
|
Sc IV |
Migratory |
|
33 |
Calidris ferruginea |
Curlew sandpiper |
Mudflats, clam beds, oyster beds, shallow water |
|
Polychaetes, molluscs, crustaceans, small seeds |
NT |
Sc IV |
Migratory |
|
34 |
Tringa glareola |
Wood sandpiper |
Mudflats, marshes, estuarine shores |
|
Crustaceans, molluscs, small fish |
|
Sc IV |
Migratory |
|
35 |
Tringa erythropus |
Common greenshank |
|
|
|
|
Sc IV |
Migratory |
|
36 |
Tringa totanus |
Common redshank |
Saltmarshes, tidal mudflats |
|
Molluscs, crusta-ceans, small fish, insects |
|
Sc IV |
Migratory |
|
37 |
Tringa ochropus |
Green sandpiper |
Saltmarshes, tidal mudflats |
|
Crustaceans, insects, worms, Neries, annelids |
|
Sc IV |
Migratory |
|
38 |
Actitis hypoleucos |
Common sandpiper |
Mangroves, marshes |
|
Molluscs, snails, crustaceans, annelids, small fish, plant seeds |
|
Sc IV |
Migratory |
|
39 |
Tringa stagnatilis |
Green sandpiper |
Swamps, salt-pans, saltmarshes, mudflats |
|
small fish, crustaceans, molluscs, insects |
|
Sc IV |
Migratory |
|
40 |
Arenaria interpres |
Ruddy turnstone |
Mangroves, swamps, mudflats, saltmarshes |
|
Insects, crustaceans, molluscs, annelids, echinoderms, small fish |
|
Sc IV |
Migratory |
|
41 |
Calidris minuta |
Little stint |
Mudflats/sandflats, saltpans |
|
Annelids, small molluscs, crustaceans, insects, plant materials |
|
Sc IV |
Migratory |
|
42 |
Calidris alpina |
Dunlin |
Mudflats, saltpans, flooded areas |
|
Polychaetes, crustaceans, insects, bivalves, gastropods, small fish |
|
Sc IV |
Migratory |
|
43 |
Calidris alba |
Sanderling |
Rocky, muddy estuarine shores, mudflats, beaches of estuarine mouths |
|
Molluscs, crustaceans, polychaete worms, fish |
|
Sc IV |
Migratory |
|
44 |
Haematopus ostralegus |
Eurasian oystercatcher |
Saltmarshes, estuarine shores |
|
Polychaetes, molluscs, crustaceans |
NT |
Sc IV |
Migratory |
|
45 |
Himantopus himantopus |
Black-winged stilt |
Sand and water |
Among reeds and grasses |
Insects, molluscs, crustaceans, small fish, seeds |
|
Sc IV |
Migratory/resident |
|
46 |
Recurvirostra avosetta |
Pied avocet |
Mudflats, saltpans, saltmarshes |
|
Polychaetes, molluscs, small fish, plant matter |
|
Sc IV |
Migratory |
|
47 |
Larus brunnicephalus |
Brown-headed gull |
Mudflats |
|
Fish, shrimps, also scavenging |
|
Sc IV |
Migratory |
|
48 |
Larus ridibundus |
Black-headed gull |
Estuary |
|
Fish, shrimps, insects, worms; scavenging |
|
Sc IV |
Migratory |
|
49 |
Larus genei |
Slender-billed gull |
Estuaries and inshore waters |
|
Fish, crustaceans, insects, other invertebrates |
|
Sc IV |
Migratory |
|
50 |
Gelochelidon nilotica |
Gull-billed tern |
Marshes, mudflats, saltpans, adjoining wetlands |
|
Insects in all stages, small invertebrates |
|
Sc IV |
Migratory |
|
51 |
Hydroprogne caspia |
Caspian tern |
Marshes, open water, mudflats, sandy areas |
|
Fish, eggs and young of other birds, aquatic invertebrates |
|
Sc IV |
Migratory |
|
52 |
Sterna aurantia |
River tern |
Marshes, open water, mudflats, sandy areas |
|
Fish, small crustaceans and insects |
NT |
Sc IV |
Migratory |
|
53 |
Thalasseus bengalensis |
Lesser crested tern |
Estuary |
|
Fish, shrimps |
|
Sc IV |
Migratory |
|
54 |
Sterna hirundo |
Common tern |
Estuaries, shores, saltpans |
|
Small fish, planktonic crustaceans, insects |
|
Sc IV |
Migratory |
|
55 |
Chlidonias hybrida |
Whiskered tern |
Estuaries, mudflats, mangroves |
|
Crabs, shrimps, fish, insects |
|
Sc IV |
Migratory |
|
56 |
Dendrocygna javanica |
Lesser whistling duck |
Estuaries |
Mangroves |
Plant parts, grains, fish, molluscs, worms |
|
Sc IV |
Resident |
|
57 |
Tachybaptus ruficollis |
Little grebe |
Estuaries, mangroves, marshes |
|
Small fish, crustaceans, molluscs, insects |
|
Sc IV |
Migratory |
|
58 |
Anas poecilorhyncha |
Spot-billed duck |
Estuaries |
Nesting at ground level |
Seeds and other plant parts, insects, molluscs |
|
Sc IV |
Resident |
|
59 |
Anas acuta |
Northern pintail |
Estuaries |
|
Algae, plant parts, fish, molluscs, crustaceans |
|
Sc IV |
Migratory |
|
60 |
Spatula clypeata |
Northern shoveller |
Estuaries, mudflats, shoreline, marshes |
|
Vegetative parts of plants, fish, crustaceans, insects |
|
Sc IV |
Migratory |
|
61 |
Anas querquedula |
Garganey |
Estuaries |
Sighting only |
|
|
Sc IV |
Migratory |
|
62 |
Mareca strepera (Anas strepera) |
Gadwall |
|
|
Plant parts, insects, crustaceans, molluscs |
|
Sc IV |
Migratory |
|
63 |
Anas crecca |
Common teal |
Estuaries, shallow marshes with thick cover |
|
Seeds of aquatic plants, invertebrates |
|
Sc IV |
Migratory |
|
64 |
Elanus caeruleus |
Black-shouldered kite |
Sandy, rocky parts, salt pans, marshes |
|
Invertebrates, including insects, fish eggs, small fishes |
|
Sc I |
Migratory |
|
65 |
Haliastur indus |
Brahminy kite |
Various habitats |
Large trees |
Feeds on fish, dead and alive, crabs, carrion, rodents, small birds, chicks |
|
Sc I |
Resident |
|
66 |
Circus aeruginosus |
Eurasian marsh harrier |
Reed marshes. |
|
Small mammals, small birds, insects, reptiles |
|
Sc I |
Migratory |
|
67 |
Milvus migrans |
Black kite |
|
|
Rodents, lizards, injured birds, eggs and chicks |
|
Sc I |
Resident/locally migratory |
|
68 |
Haliaeetus leucogaster |
Whitebellied sea eagle |
Estuarine and marine areas |
Large trees |
Fishes, eels, crustaceans, turtles, sea snakes, birds, small mammals |
|
Sc I |
Resident |
|
69 |
Spilornis cheela |
Crested serpent eagle |
|
Large trees |
Lizards, snakes, small birds, fishes, crabs |
|
Sc I |
Resident |
|
70 |
Pandion haliaetus |
Osprey |
Mangroves |
Locations near water |
Mainly fishes; occasionally other animals |
|
Sc I |
Resident/locally migratory |
|
71 |
Falco tinnunculus |
Common kestrel |
Marshlands |
Nearby rocky places |
Rodents and small birds |
|
Sc I |
Resident/locally migratory |
|
72 |
Halcyon smyrnensis |
White-breasted kingfisher |
. |
|
Fishes, crustaceans,, snails, etc |
|
Sc IV |
Resident |
|
73 |
Halcyon capensis |
Stork-billed kingfisher |
|
|
Fishes, crabs, rodents, chicks |
|
Sc IV |
Resident |
|
74 |
Halcyon pileata |
Black-capped kingfisher |
Mangroves |
|
Fishes, large insects |
|
Sc IV |
Resident/locally migratory |
|
75 |
Alcedo meninting |
Blue-eared kingfisher |
Mangroves; |
|
Fishes, crustaceans, insects, larvae |
|
Sc IV |
Resident |
|
76 |
Ceyx erithacus |
Oriental dwarf |
|
|
Insects, small lizards |
|
Sc IV |
Resident/locally migratory |
|
77 |
Ceryle rudis |
Lesser pied kingfisher |
|
|
Fishes, aquatic insects, molluscs |
|
Sc IV |
Resident |
|
78 |
Pavo cristatus |
Indian peafowl |
Vagrant in estuarine peripheral fields |
|
Various |
|
Sc I |
Resident |
|
79 |
Corvus splendens |
House crow |
Generalist |
Mangroves |
Various animals, carrion |
|
|
Resident |
|
80 |
Corvus macrorhyncos |
Jungle crow |
Generalist, rare in estuary |
|
|
|
|
Resident |
|
90 |
Dendrocitta vagabunda |
Rufous treepie |
Occasional in estuarine villages |
|
|
|
Sc IV |
Resident |
|
91 |
Centropus sinensis |
Indian coucal |
Frequent in estuarine villages |
|
|
|
Sc IV |
Resident |
|
92 |
Cypsiurus balasiensis |
Asian palm-swift |
|
|
Mostly insects |
|
Sc IV |
Resident |
|
93 |
Apus affinis |
Little swift |
|
|
Insects |
|
Sc IV |
Resident |
|
94 |
Columba livia |
Blue rock pigeon |
|
|
Grains, seeds |
|
Sc IV |
Resident |
|
95 |
Streptopelia chinensis |
Spotted dove |
|
|
Seeds, grains, fruits, insects |
|
Sc IV |
Resident |
|
96 |
Treron phoenicoptera |
Yellow-legged green pigeon |
|
Mangroves and bushes |
Fruits, berries, grains |
|
Sc IV |
Resident |
|
97 |
Psittaculacyanocephala |
Plum-headed parakeet |
|
|
Grains, fruits, the fleshy petals of flowers |
|
Sc IV |
Resident |
|
98 |
Psittacula krameri |
Rose-ringed parakeet |
|
|
|
|
Sc IV |
Resident |
|
99 |
Eudynamys scolopacea |
Asian koel |
Mangroves |
|
Omnivorous |
|
Sc IV |
Resident |
|
100 |
Tyto alba |
Barn owl |
Mangroves |
|
Birds, small mammals, rodents, lizards, snakes |
|
Sc IV |
Resident |
|
101 |
Athene brama |
Spotted owlet |
|
Hollows of trees; |
Rodents, molluscs, small birds, insects |
|
Sc IV |
Resident |
|
102 |
Merops orientalis |
Small bee-eater |
|
|
Insectivorous |
|
Sc IV |
Resident |
|
103 |
Coracias benghalensis |
Indian roller |
|
|
Insects, small reptiles |
|
Sc IV |
Resident |
|
104 |
Dinopium benghalense |
Blackrumped wood-pecker |
|
|
Beetle larvae, termites, nectar |
|
Sc IV |
Resident |
|
105 |
Celeus brachyurus |
Rufous wood-pecker |
|
|
|
|
Sc IV |
Resident |
|
106 |
Picus xantho-pygaeus |
Streak-throatedwood-pecker |
|
|
|
|
Sc IV |
Resident |
|
107 |
Dendro-copos mahrattensis |
Yellow-crowned woodpecker |
|
|
|
|
Sc IV |
Resident |
|
108 |
Hemicircus canente |
Heart-spotted woodpecker |
|
Nesting in tree holes; |
Insects from tree bark |
|
Sc IV |
Resident |
|
109 |
Galerida cristata |
Crested lark |
Mangroves, estuary |
|
Grains, seeds, insects |
|
Sc IV |
Locally migratory |
|
110 |
Hirundo daurica |
Red-rumped swallow |
|
|
Insectivorous |
|
Sc IV |
Resident |
|
111 |
Hirundo rustica |
Barn swallow |
|
|
Insectivorous |
|
Sc IV |
Resident |
|
112 |
Lanius cristatus |
Brown shrike |
|
|
Insectivorous |
|
Sc IV |
Migratory |
|
113 |
Dicrurus macrocercus |
Black drongo |
|
|
Insectivorous, seeds |
|
Sc IV |
Resident |
|
114 |
Dicrurus paradiseus |
Greater racket-tailed drongo |
|
|
Insectivorous, seeds |
|
Sc IV |
Resident |
|
115 |
Dicrurus caerulescens |
White-bellied drongo |
|
|
Insectivorous, seeds |
|
Sc IV |
Resident |
|
116 |
Acridotheres tristis |
Common myna |
|
|
Omnnivorous |
|
Sc IV |
Resident |
|
117 |
Pericrocotus flammeus |
Scarlet minivet |
|
|
Insectivorous |
|
Sc IV |
Locally migratory |
|
118 |
Aegithina tiphia |
Iora |
|
|
Insectivoros |
|
Sc IV |
Resident |
|
119 |
Zosterops palpebrosus |
Oriental white-eye |
Mangroves |
|
Insectivorous |
|
Sc IV |
Resident |
|
120 |
Pycnonotus jocosus |
Redwhiskered bulbul |
|
|
Fruits |
|
Sc IV |
Resident |
|
121 |
Pycnonotus cafer |
Red-vented bulbul |
|
|
Fruits |
|
Sc IV |
Resident |
|
122 |
Turdoides striatus |
Jungle babbler |
|
|
Insects, grains, nectar, berries |
|
Sc IV |
Resident |
|
123 |
Acro-cephalus dumetorum |
Blyth’s reed-warbler |
|
|
Insects, snails, seeds |
|
Sc IV |
Migratory |
|
124 |
Phyllo-scopus trochiloides |
Greenish warbler |
|
|
|
|
Sc IV |
Resident |
|
125 |
Orthotomus sutorius |
Common tailorbird |
Mangroves. |
|
Insects, larvae, tiny fruits and seeds |
|
Sc IV |
Resident |
|
126 |
Copsychus saularis |
Magpie robin |
for nesting; |
Tree hollows |
Insects, worms, fishes |
|
Sc IV |
Resident |
|
127 |
Parus major |
Great tit |
; |
Cavity nester |
Insects |
|
Sc IV |
Resident |
|
128 |
Motacilla alba |
White wagtail |
|
|
Insects, crustaceans, worms, small fishes |
|
Sc IV |
Resident |
|
129 |
Motacilla maderaspatensis |
Large pied wagtail |
|
|
Insects, caterpillars |
|
Sc IV |
Resident |
|
130 |
Anthus rufulus |
Paddyfield pipit |
Fields and and open dry areas; |
|
Insects, snails |
|
Sc IV |
Resident |
|
131 |
Dicaeum erythrorhynchos |
Tickell’s flowerpecker |
|
|
Berries |
|
Sc IV |
Resident |
|
132 |
Nectarinia asiatica |
Purple sunbird |
|
|
Visits Acanthus ilicifolius for nectar |
|
Sc IV |
Resident |
|
133 |
Nectarinia zeylonica |
Purple-rumped sunbird |
|
|
Visits Acanthus ilicifolius for nectar |
|
Sc IV |
Resident |
|
134 |
Passer domesticus |
House sparrow |
Open, dry spots |
|
Grains, seeds, insects |
|
Sc IV |
Resident |
|
135 |
Lonchuramalacca |
Blackheaded munia |
Amidst sedges and grasses in marshes |
|
|
|
Sc IV |
Resident |
|
136 |
Ploceus philippinus |
Baya weaver |
|
Nesting on trees, rare |
|
|
Sc IV |
|
|
137 |
Terpsiphone paradisi |
Asian paradise flycatcher |
In dense mangroves |
|
Feeds on insects in air; |
|
Sc IV |
Migratory |
|
138 |
Pitta brachyura |
Indian pitta |
|
Nesting on low trees |
Insects and small gastropods |
|
Sc IV |
Resident |
ESTUARINE BIRDS
A general discussion on estuarine birds, especially of the Indian west coast, is included as the estuarine ecosystems are similar in their underlying processes. Borges and Shanbhag (2007) identified in the Mandovi estuarine wetlands (including the Salim Ali Bird Sanctuary of Chorao Island) of Goa 151 species of birds. Borges and Shanbhag’s (2008) work on the food resource partitioning among waterbirds wintering in the Diwar wetland in Mandovi brings to light the immense importance of the wetlands in the feeding of water birds, especially waders. The wetland had 52 species of waterbird, most of them migrants. The waders, notably plovers, stints, redshanks, culews and whimbrels, used sandflats as feeding grounds. The increase in waterbird densities, especially in winter, paralleled the densities of benthic invertebrates. Waders were significantly dependent on polychaetes. Larger waders also consumed hermit crabs. Large flocks of pintail ducks foraged on the Nereis inhabiting silty sand underneath macrophytic mats, while gulls fed on the Cerethidia flava inhabiting the sandflats. These feeding patterns showed how the food resources of the wetland were partitioned, thereby minimizing competition between consumer birds.
In Kerala Mohandas et al. (1994) reported 57 species of bird occurring in the Asramam mangroves at Kollam, and Jayson (2002) recorded 182 taxa of birds from the Kole wetlands of Thrissur in Kerala. The Kadalundi–Vallikunnu Community Reserve in Kerala, the first of the five community reserves in India and the smallest, having an area of 1.5 km2, had 110 species of bird (Kanagavel et al. 2013). The Kuttanad wetland system, towards the southern portion of the Vembanad-Kole Ramsar site with an estimated extent of 53,639 ha, in southern Kerala, having fresh water in the upper Kuttanad and growing increasingly saline down the estuarine system, was rich in bird diversity (225 species). Of these birds, 38 per cent were migrants, 38 per cent residents, 16 per cent local migrants and the rest belonging to miscellaneous groups (Narayanan et al. 2011). The Mangalavanam Wildlife Sanctuary, Kochi, a mangrove sanctuary covering just 2.74 ha, had 49 species of bird according to a study conducted in 1998–1999 (Jayson 2001). Spread across 3 km2, the Kadalundi–Vallikunnu estuary, located in Kozhikode (Calicut) and Malappuram districts of Kerala, is the first community reserve of India. It was declared in 2007. The reserve is managed by a committee jointly set up by the Kadalundi and Vallikunnu panchayats. The reserve had 109 species of bird, 65 of them (60 per cent) migratory, including all the five species of gull found in Kerala (Aarif et al. 2015).
Migrant birds: Three migratory flyways for birds cross Asia: these are the West Pacific Flyway, East-Asian Australasian Flyway, and the Central Asian Flyway. The CAF comprises several important migration routes of water birds, most of which extend from the northernmost breeding grounds in Siberia and covers 30 countries of North, Central and South Asia and Trans-Caucasus. India is the core country of the CAF and supports 257 species of water birds. Of these, 81 species are migratory birds of CAF conservation concern, including three critically endangered species, six endangered species and 13 near threatened species. The Western Flyway of CAF covers Rann of Kutch and progresses southwards along the Western Ghats-west coast of India (Bird Life International, Data zone, 2009). The Indian west coast is rich in the estuaries of numerous small and medium rivers playing vital role in the lives of migratory birds along the Western Flyway of CAF.
Of the 56 species of birds associated with the mangroves of the Uran estuary in the Raigad coast of Maharashtra, Pawar (2011) noted 20 (36 per cent) were winter migrants. Of the 9 IUCN threatened species found in Aghanashini estuary, only Limosa limosa (Black-tailed Godwit) was found in Uran estuary. Aarif et al. (2015) recorded 65 migratory bird species in the 3 km2 area Kadalundi-Vallikunnu Community Reserve of. Chandrakasan and Jayson (2001) noted that of the 167 species of birds recorded from the Kole wetlands of Thrissur district in Kerala 53 species (32 per cent) were winter visitors.
On estuarine habitats and food diversity: The waders, or shorebirds, constitute a very important group of estuarine birds with long legs which frequent shallow water and intertidal mudflats, where they search for food. Herons, egrets, ibises, bitterns, spoonbills and storks are among the waders. Rails are small-sized waders with very long toes that enable them to run on soft mud. Various quail-like birds, characterized by the missing hind toe, are waders inhabiting grassy plains. Waders are important groups of mangrove and mudflat birds (Oswin 1999; Chaudhary-Pachpande and Pejavar 2016). The probing shorebirds are associated with intertidal and shallow water habitats. Plovers, snipes, curlews, whimbrel, sandpipers, godwit, turnstone, stilts, waterfowls, lapwings, moorhens, etc. feed on fishes and invertebrates (Oswin 1999). Gulls and terns are expert divers and mainly forage by diving with force where fishes are available. Gulls also feed on discarded and dead fishes in fishing areas.
Terminal consumers of detritus food chains: Several species of bird are dependent on the detritivorous benthic organisms of the estuary. Whereas in the open ocean the source of detritus is only plankton, in coastal waters and estuaries, in addition to planktonic material, benthic plants and animals and other types of material brought down by the rivers, outfalls and run-off form a rich source of detritus (Darnell 1967). Suspended detritus consists of particles of fine silt and sand, around which organic matter and bacteria adhere and form aggregates of different shapes and sizes. Settled detritus is a heterogenous mixture of animal and plant remains, silt and sand particles coated with decaying (organic) matter and large colonies of bacteria and infusorians. Often the importance of settled detritus as food of adult fishes is much greater than that of all the other food groups combined. Since estuaries are shallow, a large fallout of plant and animal materials as organic detritus takes place (Sathiyamurthy and Purushothaman 1992).
The mangroves, marshes, mudflats and gazni rice fields are extremely rich in organic detritus, on which many invertebrates depend. The gastropods feed on fallen leaves of mangroves and may consume mud (mainly formed by mangrove litter and other organic detritus from upstream areas of the Western Ghats, brought down by the river). Molluscan bivalves feed on suspended organic food particles by filtering them. Oysters and mussels also carry out similar filter feeding in detritus-rich areas. Birds which feed on molluscs (bivalves, gastropods, etc.), prawns and crabs, polychaetes, amphipods, nematodes, etc. are therefore almost terminal consumers in short, detritus-based food chains operating in the estuary. In the Mandovi estuary of Goa, Borges and Shanbhag (2008) found that the waterbird (ducks, gulls and wading birds) population increased concomitantly with the collective population of the benthic invertebrates. Whereas the ducks foraged for these detritivores under algal mats, the storks were found feeding on gastropods and other invertebrates on exposed sandflats or on shallow bivalve beds. The gulls were observed feeding on hermit crabs on sandflats, after breaking the shells of the gastropods covering the bodies of crabs on exposed rocks. The waders had a significant dependence on the polychaetes in the mudflats. They fed mostly on nereids (Nereis, etc.) from the top 5 cm of the mudflats. The larger waders fed on hermit crabs from exposed sandflats. All the waterbirds and waders (their numbers are highest in winter) feed on estuarine benthic invertebrates. The wetlands were important stopovers for the waders migrating along the Central Asian Migratory Flyway (Bird Life International, Data Zone, 2009). The investigators found the densities of crustaceans and other soft-bodied invertebrates to be highest during the post-monsoon period, declining sharply in winter.
The detritus feeders graze upon the floor, swallowing larger aggregates of detritus with mud or scraping adhered material from submerged objects such as rocks, shells, pilings and wooden or metal structures. The detritus food chain through the fishes to the birds is very important in estuaries. Many species of fish combine detritus with the other food materials. Liza parsia stomach content contained plant food and detritus. Mugil cephalus and Gerres filamentosus had plant and animal material and detritus (Jeyaseelan and Krishnamurthy 1980). As a large number of fish species feed on benthic detritus-feeding organisms, the birds eating such fishes are the ultimate beneficiaries of the detritus food chains operating in the estuaries. The fish species found in Aghanashini which are known to have varied degrees of dependence on organisms feeding on detritus (e.g. crustaceans, molluscs, polychaete worms and other invertebrates) include Arius arius, Crossorhombus azureus, Cyanoglossus macrostomus, Nemepterus japonicus, Pseudorhombus javanicus, Scatophagus argus, Otolithes ruber, Sillago sihama and Terapon jarbua (details of detritus dependence from http://www.fishbase.org/summary/785).
In fact the large congregations of birds in the Aghanashini estuary can be explained by their dependence on organisms which in turn are directly feeding on detritus or other detritus-feeding organisms lower in the estuarine food web. The presence seasonally or year-round of darters, herons, egrets, storks, spoonbills, waterhens, jacanas, swamp hens, plovers, lapwings, godwits, sandpipers, shanks, turnstones, stints, sanderlings, stilts, avocets, gulls, terns, ducks, etc, highlights the rich presence of detritus-feeding organisms on which these birds depend directly and indirectly through more links.
Shrimp aquaculture impacts on mangroves, detritus and bird fauna: Mangroves are an integral part of tropical estuaries and play a prime role in sustaining the rich bird communities of estuaries. The enormous amount of organic matter associated with mangrove forests contributes substantially to the detritus-based food web which is most important in sustaining fisheries as well as bird diversity. Hong and Tri (1986) estimated the annual output of leaves (dry weight) from a Rhizophora apiculata forest to be 8000–12,000 kg/ha. During decomposition, the mangrove litter becomes progressively enriched in protein and serves as a food source for a wide variety of filter, particulate and deposit feeders such as molluscs, crabs and polychaete worms. These primary consumers in turn form the food of a secondary consumer population (Hamilton and Snedaker 1984).
Threatened species: The estuary is noted for the rare presence of some IUCN Red Listed birds.
Anhinga melanogaster Pennant (Oriental darter): Threat category: Near Threatened
A rapid decline of the population globally was noticed. It occurs in South and Southeast Asia. It may be resident to local migrant in Aghanashini estuary. It inhabits shallow portions of wetlands. Habitat loss (both degradation of foraging areas and felling of trees used for breeding), disturbance (at feeding grounds and colonies), hunting, egg collection and pollution were reported as threats (http://www.iucnredlist.org/details/22696712/0).
Leptoptilos javanicus Horsfield (lesser adjutant): Threat category: Vulnerable
It is a very large stork, dark grey-black above, white below, with naked head and neck. Its distribution is in South and Southeast Asia. The population is suspected to be rapidly declining due to a variety of threats such as hunting pressure, loss of nesting habitat, cutting down of nesting trees, conversion and degradation of wetlands and agricultural changes and intensification. In estuaries the species is associated with mangroves and intertidal flats as well as adjacent wetlands (http://www.iucnredlist.org/details/22697713/0).
Threskiornis melanocephalus Latham (black-headed ibis): Threat category: Near Threatened
A large bird of east, South and Southeast Asia. The population is suspected to be in a moderately rapid decline owing to hunting, egg collection, disturbance at breeding colonies, drainage and agricultural conversion (http://www.iucnredlist.org/details/22697516/0).
Limosa limosa Linnaeus (black-tailed godwit): Threat category: Near Threatened
Large, rather graceful wader, with long bill on a relatively small head, long neck and long legs. Colour of fore-body is dull pink-chestnut in summer, paler grey-brown in winter. In flight has a striking white wing-bar and rump. It is native to the sub-Arctic north. Its migration southwards is to escape the northern winter. Over the past 25 years, up to 2015, the population is estimated to have declined by 23 per cent. Along the coast it winters in estuaries, lagoons, mudflats, saltmarshes, sandy beaches, etc. Pollution, human disturbance, habitat reclamation for tidal energy plants, aquaculture ponds, land conversion for agriculture, urban expansion and agricultural intensification are considered notable threats (http://www.iucnredlist.org/details/22693150/0).
Limosa lapponica Linnaeus (bar-tailed godwit): Threat category: Near Threatened
A winter migrant to the south. Medium-sized godwit with slightly upcurved bill and barred tail, in flight lacks white wing bar and has white underwing. Non-breeding adults have pale grey-brown upperparts, partly edged whitish. Breast turns grey with fine dark streaking. Underparts white. Wintering birds come to India. Loss of tidal flats and various developmental activities affecting bird habitats are among the reasons for the decline of the population (http://www.iucnredlist.org/details/22693158/0).
Numenius arquata Linnaeus (Eurasian curlew): Threat category: Near Threatened
A winter migrant to the south. Breeding populations in Europe, Russia and Siberian region. Large wader with long down-curved bill. Mottled or streaked brown plumage with whiter belly and undertail. In flight shows pointed whitish rump and barred tail as well as mottled whitish underwings. The wintering birds along the southern coasts are associated with muddy coasts, bays, tidal mudflats and sandflats, rocky and sandy beaches with many pools, mangroves, saltmarshes, coastal meadows, etc. Habitat loss in breeding areas, agricultural intensification, drainage, increased use of inorganic fertilizers and high predation rates on eggs and chicks as well as hunting pressures are among the major threats listed (http://www.iucnredlist.org/details/22693190/0).
Calidris ferruginea Pontoppidan (curlew sandpiper): Threat category: Near Threatened
Medium-sized sandpiper. Longish neck and legs and long, decurved bill. Head, neck and all upperparts rusty rufous to deep chestnut-red, with dark streaks on crown. Mantle and scapulars dark brown with chestnut and whitish fringes. Female has longer bill, paler and more likely to have white barring on underparts. Non-breeding adult plain grey above, white below, white supercilium and sides of breast washed grey. Breeding ground is Arctic Siberia. In winter, along the coast, the species chiefly occurs in brackish lagoons, tidal mudflats and sandflats, estuaries, saltmarshes and sandy beaches and saltpans. Loss and degradation of stopover habitats, rising pollution and unsustainable harvests of benthic fauna are listed as reasons. In south India, Illegal hunting, diminishing rainfall and various other anthropogenic factors are cited as threats for migrants (http://www.iucnredlist.org/details/22693431/0).
Haematopus ostralegus Linnaeus (Eurasian oystercatcher): Threat category: Near Threatened
The main breeding populations are in northern European countries and the north-west of Russia. Along the Indian coast the wintering populations settle in estuarine mudflats, saltmarshes and sandy and rocky shores. Over-fishing of benthic shellfish and the resulting disappearance of intertidal mussel and cockle beds are considered the major threats. Habitat degradation and disturbances by humans are among other reasons for the decline of this species (http://www.iucnredlist.org/details/22733462/0).
Sterna aurantia Gray (Indian river tern) Threat category: Near Threatened
The species occurs mainly in South and Southeast Asia. Increasing human disturbance and dam construction projects are expected to drive a moderately rapid population decline over the next three generations. Unlike in Southeast Asia, where the population decline is severe, the species is reported to be more regular in southern India than was once thought, having probably benefitted from the development of reservoirs (http://www.iucnredlist.org/details/22694537/0).
The Indian Wildlife (Protection) Act, 1972 has included some of the estuarine birds under Schedule I, providing absolute protection. The penalties for offences are highest under this schedule. Most other birds are under Schedule IV, which is less stringent. The Schedule I birds recorded from Aghanashini estuary with the help of the ornithology expert Roshmon Thomas were Platalea leucorodia (Eurasian spoonbill), Elanus caeruleus (black-shouldered Kite), Haliastur indus (brahminy kite), Circus aeruginosis (Eurasian marsh harrier), Milvus migrans (black kite), Haliaeetus leucogaster (white-bellied sea eagle), Spilornis cheela (crested serpent eagle), Pandion haliaetus (osprey), Falco tinnunculus (common kestrel) and Pavo cristatus (Indian peafowl). Most of these are predominantly land birds which seek prey in the estuarine environment. The notable exception is the white-bellied sea eagle which is more based in littoral ecosystems.
Threats faced by estuarine bird community
Rise of shrimp farms and birds turned into pests: In the traditional rice-cum-fishery farms (e.g. gazni fields of Aghanashini and Pokkali fields of south Kerala), birds were never considered pests but were viewed more as an integral part of estuarine life. The promotion of shrimp monoculture in specially prepared ponds, by converting traditional biodiversity-rich rice-cum-fishery fields, the intense stocking of shrimps and easy availability of prey to the birds attracted more predator birds hovering around these farms to snatch the abundant and easily available prey. This made a major shift in the worldview of the shrimp farmers towards the bulk of the estuarine bird community, given to carnivory. In the shrimp farms of Kannur, Roshnath et al. (2014) noted major threats from cormorants, while other problematic species were the night herons, little grebe, egrets, kingfishers, storks, darter, green herons and whistling ducks. Upsets in the bird population patterns favouring more predator species may be considered an adverse impact of shrimp monoculture on natural estuarine ecosystems which have a high diversity of birds and abundance of food.
PROBLEMS AND PROSPECTS
Estuaries are the expressions of rivers meeting the sea. The mixing of fresh water from the land and the oceanic salt water in a coastal basin produces a unique set-up of brackish water and circulation patterns in tune with the differential mixing of the very fluctuating flow from the river with the nearly uniform and powerful oceanic tides, setting up circulation and depositional patterns that are distinctive of estuaries. In tune with the geomorphology, vegetation and hydrological patterns of the river catchment, the estuaries tend to develop their individual features. Compared with inland waters or ocean water, the primary productivity of an estuary is rated high. Cooper (2002–2017) places typical estuarine production in the range of 10–25 g of dry organic matter per square metre per day compared with 1 g in the open sea and 0.5–3 g in coastal waters. Many marine and freshwater organisms consequently spend the juvenile phase of their development in estuaries, where a good food supply and low abundance of predators favour survival.
Through the ages, estuaries have been favoured places for human settlements, leading in due course the rise of major coastal cities, flourishing ports and trade centres, also places prioritized for setting up industrial hubs. The ever-increasing human interventions progressing in uncharted dimensions have brought the state of numerous estuaries to a near-disastrous state. The Indian west coast estuaries, along with the Western Ghats, a global biodiversity hotspot, constitute a major part of the Western Flyway of the Central Asian Flyway (CAF), an important pathway for north–south migration of birds. The waterbirds especially look forward to spending days, weeks or months as part of the flourishing estuarine ecosystems, feeding on the high diversity and abundance of protein-rich faunal components, ranging from the polychaetes and shellfish to fish and reptiles.
The traditional estuarine uses by humans of pre-industrial times had no notable impacts on their structural and functional integrity and capacity to sustain large flocks of birds. As far as Aghanashini estuary is concerned, such integrity and naturalness continued till the 1970s, hosting congregations of birds seeking food in its richly productive water, mangrove swamps, mudflats and oyster beds, gazni rice fields and rocky and sandy shores towards the river mouth. No hydroelectric projects existed upstream, and this is true to this day, unlike in the neighboring Sharavathi, wherein a near collapse of the ecosystem happened, wiping out bivalves and altering the fishery drastically as reduced salinity due to incessant fresh water input from upstream dams crippled its capacity to serve as nurseries for marine fishes and crustaceans (as discussed in the earlier chapters).
From the late 1970s the state’s promotion of export-oriented shrimp production farms caused conversion of substantial portions of the erstwhile detritus-rich gazni rice fields, in a mosaic with reed-swamp islands within them, into aquaculture farms. Aquafarms, in general, all over the country, released untreated effluents, toxic pollutants and pathogens into the estuarine environment, which are expected to have a serious impact on the juveniles of fishes, shellfish and crustaceans. No studies were made on the impacts of these interventions on the extensive and richly productive mudflat ecosystems, the most favoured feeding places for especially the waterbirds, both residents and migrants. The period from the 1970s to the 1990s was a critical one for the bird fauna, mainly due to wanton destruction of mangroves, which are at the core of estuarine ecology and critical roosting, nesting and feeding areas for migrant and resident birds.
The marine fishing along Karnataka’s coast witnessed phenomenal growth from the early 1970s till today with unregulated introduction of mechanized crafts and modern gear for effective fishing, aimed more at commercial production and exports. In tune with global trends in capture fisheries, Karnataka’s fishery also witnessed a serious downfall, which in a way intensified fishing efforts in the estuaries, unmindful of the fact that the estuaries are important nurseries for various kinds of marine fishes and crustaceans. The fishing gear being used in Aghanashini, for example, although of the traditional kind, have no mesh restriction and are effective in trapping juveniles of fish and prawns on a massive scale.
The estuary has been subjected to severe exploitation of molluscan shells for industrial purposes. The shell mining was carried out with utter disregard towards the ecological impacts on mudflats and clam and oyster beds. The edible bivalve resources also were subjected to unprecedented levels of extraction, aiming at meeting growing demands from urban centres, especially the demand from Goa, where the bivalve production had collapsed in recent years (discussed previously in the report on molluscan bivalves). Aghanashini, which was subjected to severe over-exploitation in terms of clams and oysters—an annual production over 22,000 tons reported by Boominathan et al. (2008) produced from its clam and oyster beds—saw a serious collapse in shell production, to almost nil during 2015–2016. As discussed previously (also see Table 5.1), it is easy to visualize how the shellfish production would have adversely affected the wader bird population. Notably, although we have no estimates, the trophic base of the herons, egrets, spoonbills, waterhens, jacanas, plovers, curlews, sandpipers, turnstones, stints, sanderlings, oystercatchers, stilts, avocets, ducks, grebes, etc. would have been affected by the depletion of estuarine bivalves.
A basic understanding of the dependence of globally threatened bird species on estuarine/coastal ecosystems could be a strong reminder for us to raise the standards of coastal ecosystem management. The IUCN Red list of Threatened Species, in its species-appraisal, has categorically referred to overfishing, bivalve depletion, sand and shell mining, juvenile destruction, conversion of marshy, swampy areas (mainly for aquaculture), destruction of nesting/roosting sites, pollution and even decline of traditional agriculture as among the threats faced by many birds (all these threats also applicable to the Aghanashini estuary). The Near Threatened Sterna aurantia, Haematopus ostralegus, Caladris ferruginea, Numenius arquata, Limosa lapponcia, L. limosa and Threskiornis melanocephalus as well as the Vulnerable category Leptoptilos javanicus are affected by such threats operating in the Aghanashini estuary as well.
Recommendations for conservation, incorporating also some details from Birdlife International, Datazone (2009) are given below:
- There is data deficiency on precise and up to date information on water bird populations, which necessitates population counts of especially dwindling water birds species.
- Identify the nesting areas of sensitive species. The forest department, jointly with the local Biodiversity Management Committees, and associations of stakeholders and NGOs, should initiate community-based protection of all important bird nesting areas.
- As estuarine areas are densely populated awareness programmes for all concerned and stakeholders’ participation are essential.
- Support should be given to traditional Kagga rice cultivation in estuarine rice fields as such rice fields are reservoirs of organic nutrients from the good quantity of rice straw left behind in the fields.
- Management of shellfish habitat and implementation of sustainable harvest standards are critical.
- While shell mining has to be stopped in the estuary, sand mining is to be allowed strictly within sustainable yield limits to be fixed.
- As there is hardly anyone devoted to bird studies, monitoring of critical bird populations of species which are reflective of estuarine health, a team of local volunteers has to be trained as parataxonomists, especially to undertake year-round observations and prepare records for groups of birds. They can also be trained as tourist guides having scientific knowledge of mangroves, birds and other key estuarine habitats and organisms.
- Mesh size restrictions on fishing and crustacean nets are critical for restoring healthy fisheries not only in the estuary but also in the sea and to restore healthy levels of bird populations.
- Shrimp farms and their methods of culturing have to be brought under the scanner so that they adhere to the appropriate legislations in the country governing these areas. Use of chemicals in shrimp farms has to be strictly monitored and the shrimp farmers may declare in writing the culture (of shrimps, fish, crabs) practices adopted so that timely advisories may be released by the conservation agencies concerned.
- A watch should kept on poaching of eggs of birds and on hunting and trapping them, through local community participation, Biodiversity Management Committees and trained parataxonomy volunteers.
- Water and soil testing for pollution should be ongoing programmes, and sources of contamination should be identified for the government to adopt appropriate steps.
- Organic farming should be promoted in the estuarine and upstream area villages.
- The Karnataka Biodiversity Board had already recommended Biodiversity Heritage Site status for Aghanashini estuary under the provisions of the Biodiversity Act, 2002 of the Government of India. But due to a lack of administrative support, the recommendation remains dormant. It has to be taken up again by the KBB and put up before the government for implementation.
REFERENCES
-
Aarif, K.M., Prasadan, P.K., Basheer, P.M. and Valappil, A.H.S. 2015. Population of wintering gulls in Kadalundi-Vallikunnu Community Reserve. Journal of Environmental Biology 36: 597–600.
-
BirdLife International, Data Zone, 2009. http://www.birdlife.org/datazone/sites/index.html?action=SitHTMFindResults.asp&INam=&Reg=2&Cty=99#
-
Boominathan, M., Chandran, M.D.S. and Ramachandra, T.V. 2008. Economic Valuation of Bivalves in the Aghanashini Estuary, West Coast, Karnataka. Envis Technical Report 30, Ministry of Science and Technology, Government of India.
-
Borges, S.D. and Shanbhag, A.B. 2007. Additions to the avifauna of Goa, India. Journal of the Bombay Natural History Society104(1).
-
Borges, S.D. and Shanbhag, A.B. 2008. Food resource partitioning among waterbirds wintering on the Diwar wetland in the Mandovi estuary of Goa, India. Proceedings of Taal 2007, the 12th World Lakes Conference. Pp. 124–130.
-
Chandrakasan, S. and Jayson, E.A. 2001. Birds of Kole wetlands, Thrissur. Zoo’s Print Journal 10(10): 334–349.
-
Chaudhary-Pachpande, S. and Pejavar, M.K. 2016. A preliminary study on the birds of Thane Creek, Maharashtra, India. Journal of Threatened Taxa 8(5): 87–97.
-
Bird Life International, Data zone, 2009 Convention on the Conservation of Migratory Species. 1 February 2006. Central Asian Flyway Action Plan for the Conservation of Migratory Waterbirds and Their Habitats (PDF). UNEP/CMS Secretariat, New Delhi, 10–12 June 2005.
-
Cooper, J.A.G. 2002–2017. Anthropogenic impacts on estuaries. In Encyclopedia of Life Support Systems (EOLSS).
-
Daniels, R.J.R. 1989. A conservation strategy for the birds of the Uttara Kannada district, Ph D Thesis, Indian Institute of Science, Bangalore.
-
Darnell, R.M. 1967. Organic detritus in relation to the estuarine ecosystem. In Lauff, G.H. (ed.), Estuaries. American Association for the Advancement of Science. Pp. 367–382.
-
Dugan, J.E., Hubbard, D.M., McCrary, M.D. and Pierson, M.O. 2003. The response of macrofauna communities and shorebirds to macrophyte wrack subsidies on exposed sandy beaches of southern California. Estuarine, Coastal and Shelf Science 58(10): 25–40.
-
Dugan, J.E., and Hubbard, D.M., 2006, Ecological responses to coastal armoring on exposed sandy beaches, Shore and Beach, 74(1): 10–16.
-
Eddington, J.M., Morgan, P.J. and Morgan, R.A. 1973. Feeding patterns of wading birds on the Gann Flat and River Estuary at Dale. Field Study 3: 738–800. sj.field-studies-council.org
-
Elliott, M., Nedwell, S., Jones N.V., Read, S.J., Cutts, N.D. and Hemingway, K.L. 1998. Intertidal Sand and Mudflats and Subtidal Mobile Sandbanks: An Overview of Dynamic and Sensitivity Characteristics for Conservation Management of Marine SACs. Scottish Association for Marine Science (SAMS), Oban, UK.
-
Fujii, T. 2012. Climate change, sea-level rise and implications for coastal and estuarine shoreline management with particular reference to the ecology of intertidal benthic macrofauna in NW Europe. Biology (Basal) 1(3): 597–616.
-
Hamilton, L.S and Snedaker S.C. (eds.). 1984. Handbook for Mangrove Area Management. Environment and Policy Institute, East–West Center, IUCN, UNESCO, UNEP. Pp. 25–29.
-
Hockey, P.A.R., Navarro, R.A., Kalejta, B. and Velasquez, C.R. 1992. The riddle of the sands: Why are shorebird densities so high in southern estuaries? American Naturalist 140: 961–979.
-
Hong, P.N. and Tri, N.H. 1986. Mangroves of Ca Mau Peninsula. Bakawan Newsletter of the Regional Mangrove Information Network for Asia and the Pacific. 9–11 March.
-
Jayson, E.A. 2001. Structure, composition and conservation of birds in Mangalavanam mangroves, Cochin, Kerala. Zoos’ Print Journal 16(5): 471–478.
-
Jayson, E.A. 2002. Ecology of Wetland Birds in the Kole Lands of Kerala. KFRI Research Report No. 244. Kerala Forest Research Institute, Peechi.
-
Jeyaseelan, M.J.P. and Krishnamurthy, K. 1980. Role of mangrove forests of Pichavaram as fish nurseries. Proceedings of the Indian National Science Academy 46(1): 48–53.
-
Kanagavel, A.A., Pandya, R., Sinclair, C., Prithvi, A. and Raghavan, R. 2013. Community and conservation reserves in southern India: Status, challenges and opportunities. Journal of Threatened Taxa 5(17): 5256–5265.
-
Lad, D. and Patil, S. 2015. Status and diversity of avian fauna in the estuarine wetland area of Bhayander and Naigaon, Maharashtra, India. Bioscience Discovery 6(1): 39–44.
-
Lane, B. 1987. Shorebirds in Australia. Nelson Publishers, Melbourne, Australia.
-
Mohandas, A., Ramanujan, N. and Sreedevi, P. 1994. The effect of man-made changes in the mangrove ecosystem at Asramam, Kollam. In Proceedings of the Sixth Kerala Science Congress, Thiruvanathapuram. Pp. 55–57.
-
Narayanan, S.P., Thomas, A.P. and Sreekumar, B. 2011. Ornithofauna and its conservation in the Kuttanad wetlands, southern portion of Vembanad-Kole Ramsar site, India. Journal of Threatened Taxa 3(4): 1663–1676.
-
Nisture, S.R. and Pejaver, M.K. 2002. Species diversity of avifauna at Thane creek near Rutuchakra Nature Park. In Proceedings of the National Seminar on Creeks Conservation Pp. 276–282.
-
Norazlimi, N.A. and Ramli, R. 2015. The relationships between morphological characteristics and foraging behavior in four selected species of shorebirds and water birds utilizing tropical mudflats. The Scientific World Journal 2015: Article ID 105296. 7 pp.
-
Oswin, S.D. 1999. Avifaunal diversity of Muthupet mangrove forest. Zoo’s Print Journal 14(6): 47–53.
-
Pawar, P.R. 2011. Species diversity of birds in mangroves of Uran (Raigad), Navi Mumbai,
Maharashtra, West coast of India. Journal of Experimental Sciences 2(10): 73-77
-
Raffaelli, D. and Hawkins, S. 1996. Intertidal Ecology. Kluwer Academic Publishers, Dordrecht, The Netherlands
-
Rehfisch, M.M., Austin, G.E., Armitage, M.J.S., Atkinson, P.W., Holloway, S.J., Musgrove, A.J., Pollitt, M.S. 2003. Numbers of wintering waterbirds in Great Britain and the Isle of Man (1994/1995–1998/1999). II. Coastal waders (Charadrii). Biol. Conserv. 112: 329–341.
-
Roshmon, T. 2016. Studies on the bird diversity in the mangrove areas of Kali and Aghanashini estuaries. PG Department of Marine Biology, Ph.D. thesis, Karnataka University, Dharwad.
-
Roshnath, R. 2014. Fishing for living: Shrimp farmer’s perception of heronry birds in Kannur District, Kerala, India. International Journal of Research (IJR) 1(6): 188–199.
-
Samant, J.S. 1985. Avifauna of the mangroves around Ratnagiri, Maharashtra. In The Mangroves, Proceedings of the National Symposium on Biology, Utilization and Conservation of Mangroves Pp. 456–466.
-
Sathiyamurthy, K. and Purushothaman, A. 1992. Distribution and composition of organic detritus in a tropical estuarine system. Asian Marine Biology 9: 101–110.
-
Taware, S., Lagade, V.M., Muley, D. and Koli, K.B. 2012. Checklist of birds at Bhatye estuary and adjacent areas, Maharashtra. Zoos’ Print Journal 27(7): 22–26.
-
Verma, A., Balachandran, S., Chaturvedi, N. and Patil, V. 2004. A preliminary report on the biodiversity of Mahul creek, Mumbai, India with special reference to avifauna. Zoo’s Print Journal 19(9): 1599–1605.
Annexure – 1 (Birds encountered during sampling – month wise during the three consecutive years)
|
S L No |
Scientfic Name |
Birds Name |
Birds count |
Total during a year |
|---|---|---|---|---|
|
1 |
Plegadis falcinellus |
Glossy Ibis |
40-45 |
350 |
|
2 |
Phalacrocorax carbo |
Large Cormorant |
80-85 |
280 |
|
3 |
Anhigna rufa |
Darter |
20-25 |
60 |
|
4 |
Phalacrocorax niger |
Little Cormorant |
250-260 |
600 |
|
5 |
Egretta garzetta |
Egrets |
920-925 |
3490 |
|
6 |
Ardeola striatus |
Little Green Heron |
115-120 |
780 |
|
7 |
Ardeola grayii |
Pond Heron |
220-230 |
940 |
|
8 |
Egretta gularis |
Indian Reef Heron |
70-80 |
452 |
|
9 |
Ciconia episcopus |
Whitenecked Stork |
40-45 |
320 |
|
10 |
Threskiornis aethiopica |
White Ibis |
250-260 |
650 |
|
11 |
Amaurornis phoenicurus |
Whitebreasted Waterhen |
60-70 |
230 |
|
12 |
Anastomus oscitanus |
Openbill Stork |
80-85 |
652 |
|
13 |
Nycticorax nycticorax |
Night Heron |
270-280 |
800 |
|
14 |
Ardea insignis |
Great Whitebellied Heron |
40-45 |
120 |
|
15 |
Ardea purpurea |
Purple Heron |
60-65 |
189 |
|
16 |
Ardea cinerea |
Grey Heron |
140-145 |
890 |
|
17 |
Dendrocygna javanica |
Lesser Whistling Teal |
310-320 |
912 |
|
18 |
Anas acuta |
Pintail |
180-190 |
920 |
|
19 |
Anas crecca |
Common Teal |
120-130 |
810 |
|
20 |
Haliastur indus |
Brahminy Kite |
140-145 |
912 |
|
21 |
Milvus migrans |
Common Pariah kite |
140-150 |
765 |
|
22 |
Accipiter badius |
Shikra |
60-65 |
240 |
|
23 |
Haliaeetus leucogaster |
Whitebilled Sea Eagle |
80-90 |
500 |
|
24 |
Porphyrio porphyrio |
Purple Moor Nen |
245-250 |
1200 |
|
25 |
Fulica atra |
Coot |
200-215 |
890 |
|
26 |
Amaurornis akool |
Brown Crake |
60-70 |
120 |
|
27 |
Himantopus himantopus |
Blackwinged Stilt |
220-230 |
870 |
|
28 |
Vanellus indicus |
Red-Wattled Lapwing |
130-140 |
560 |
|
29 |
Vanellus malabarucus |
Yellow -Wattled Lapwing |
60-65 |
180 |
|
30 |
Numenius arquata |
Curlew |
130-135 |
421 |
|
31 |
Numenius phaeopus |
Whimbrel |
80-85 |
300 |
|
32 |
Tringa totanus |
Redshank |
140-145 |
620 |
|
33 |
tringa stagnatilis |
Marsh Sand piper |
120-130 |
560 |
|
34 |
Tringa nebularia |
Greenshank |
85-90 |
320 |
|
35 |
Tringa hypoleucos |
Common Sandpiper |
150-160 |
678 |
|
36 |
Charadrius dubius |
Little Ringed Plover |
80-90 |
189 |
|
37 |
Calidris testacea |
Curlew Sandpiper |
60-65 |
120 |
|
38 |
Larus fuscus |
Lesser Blackbacked Gull |
145-150 |
992 |
|
39 |
Larus brunnicephalus |
Brown Headed Gull |
230-335 |
1923 |
|
40 |
Larus ridibundus |
Blackheaded Gull |
150-155 |
1002 |
|
41 |
Gelochelidon nilotica |
Gullbill Tern |
180-185 |
1239 |
|
42 |
Hydroprogne caspia |
Caspian Tern |
160-165 |
1670 |
|
43 |
Sterna hirundo |
Common Tern |
220-225 |
1780 |
|
44 |
Sterna aurantia |
River Tern |
250-250 |
1820 |
|
45 |
Chalcophaps indica |
Emerald Dove |
60-65 |
178 |
|
46 |
Psittacula krameri |
Rose Ringed Parakeet |
145-150 |
340 |
|
47 |
Cuculus canorus |
Cuckoo |
90-95 |
289 |
|
48 |
Tyto alba |
Barn Owl |
30-35 |
120 |
|
49 |
Ceryle rudis |
Pied Kingfisher |
70-75 |
210 |
|
50 |
Pelargopsis capensis |
Storkbilled Kingfisher |
90-95 |
320 |
|
51 |
Meropus orientalis |
Small Green Bee-Eater |
140-145 |
700 |
|
52 |
Coracias Benghalensis |
Indian Roller |
75-80 |
210 |
|
53 |
Upupa epopus |
Hoopoe |
40-45 |
127 |
|
54 |
Tockus birostris |
Common Grey Hornbill |
140-145 |
520 |
|
55 |
Anthracoceros malabaricus |
Indian Pied Hornbill |
80-90 |
240 |
|
56 |
Dryocopus javensis |
Great Black Woodpecker |
70-75 |
210 |
|
57 |
Pitta brachyura |
Indian Pitta |
40-45 |
120 |
|
58 |
Hirundo smithii |
Wiretailed Swallow |
80-85 |
256 |
|
59 |
Oriolus oriolus |
Golden Oriole |
75-80 |
278 |
|
60 |
Oriolus xanthornus |
Blackheaded Oriole |
120-125 |
789 |
|
61 |
Dicrurus adsimilis |
Black Drongo |
150-160 |
600 |
|
62 |
Dicrurus paradiseus |
Racket Tailed Drongo |
70-80 |
320 |
|
63 |
Dendrocitta vegabunda |
Tree Pie |
130-135 |
390 |
|
64 |
Aegithina tiphia |
Iora |
135-140 |
421 |
|
65 |
Pycnonotus cafer |
Redvented Bulbul |
150-160 |
452 |
|
66 |
Terpsiphone paradisi |
Paradise Flycatcher |
80-85 |
230 |
|
67 |
Orthotomus sutorius |
Tailor bird |
130-135 |
410 |
|
68 |
Treron phoenicoptera |
Common Green Pigeon |
180-185 |
578 |
|
69 |
Columba livia |
Blue Rock Pigeon |
220-225 |
720 |
|
70 |
Contropus toulou |
Lesser Coucal |
200-210 |
614 |
|
71 |
Caprimulgus asiatcus |
Common Indian Nightjar |
40-45 |
120 |
|
72 |
Apus affinis |
House Swift |
80-85 |
245 |
|
73 |
Megalaima viridis |
Smlaa Green Barbet |
120-125 |
360 |
|
74 |
Mirafra assamica |
Bush Lark |
230-240 |
782 |
|
75 |
Oriolus chinensis |
Blacknaped Oriole |
130-140 |
390 |
|
76 |
Gracula religiosa |
Hill Myna |
40-45 |
92 |
|
77 |
Pericrocotus ethologus |
Scarlet Minivet |
70-80 |
178 |
|
78 |
Turdoides affinis |
Whiteheaded Babbler |
130-140 |
189 |
|
79 |
Turdoidesstriatus |
Jungle Babbler |
180-185 |
378 |
|
80 |
Nectarinia zeylonica |
Purplerumped Sunbird |
190-195 |
666 |
Annexure II: Habitat wise birds distribution
|
Scientyfic Name |
Family |
Birds Name |
Forest |
Eastury |
Marsh /Gajani |
Paddy |
Mangrove |
Laterite |
Wetland |
Migratory |
|---|---|---|---|---|---|---|---|---|---|---|
|
Phalacrocorax carbo |
Phalacrocoracidae |
Large Cormorent |
|
p |
p |
|
p |
|
p |
|
|
Phalacrocorax niger |
Phalacrocoracidae |
Little Cormorent |
|
p |
p |
|
p |
|
p |
|
|
Anhinga rufa |
Anhingidae |
Darter |
|
|
p |
|
|
|
p |
|
|
Ardea insignis |
Ardeidae |
Great whitebilled Heron |
|
|
p |
|
p |
|
p |
|
|
Ardea alba |
Ardeidae |
Large Egret |
|
|
p |
P |
p |
p |
p |
R M |
|
Ardea purpurea |
Ardeidae |
Purple Heron |
|
p |
p |
P |
p |
p |
p |
R M |
|
Ardea cinerea |
Ardeidae |
Grey Heron |
|
|
p |
|
p |
|
p |
|
|
Adreola striatus |
Ardeidae |
Little green Heron |
|
|
p |
|
p |
|
p |
|
|
Nycticorax nycticorax |
Ardeidae |
Night Heron |
|
|
|
|
p |
|
p |
|
|
Adreola grayii |
Ardeidae |
Pond Heron |
|
p |
p |
p |
p |
p |
p |
|
|
Bubulcus ibis |
Ardeidae |
Cattle Egret |
|
p |
p |
P |
p |
p |
p |
|
|
Egretta Intermidia |
Ardeidae |
Smaller Egret |
|
p |
p |
p |
p |
p |
p |
|
|
Egretta gularis |
Ardeidae |
Indian reff Heron |
|
p |
p |
|
p |
|
p |
|
|
Egretta garzetta |
Ardeidae |
Little Egret |
p |
p |
p |
p |
p |
p |
p |
|
|
Anastomus oscitans |
Ciconiidae |
Openbill Stork |
|
p |
p |
p |
p |
|
p |
|
|
Ciconia episcopus |
Ciconiidae |
Whitenecked stork |
|
p |
p |
|
p |
|
p |
|
|
Ciconia nigra |
Ciconiidae |
Black stork |
|
p |
p |
|
p |
|
p |
|
|
Leptoptilos javanica |
Ciconiidae |
Lesser Adjutant |
p |
|
p |
|
|
|
p |
R M |
|
Threskiornis aethiopica |
Threskiornithidae |
White Ibis |
|
p |
p |
p |
p |
|
p |
|
|
Dendrocygna javanica |
Anatidae |
Lesser whistiling duck |
|
p |
|
|
|
|
p |
R uncommon |
|
Anas clypeata |
Anatidae |
Northern shoveller |
|
|
p |
|
|
|
p |
|
|
Anas poecilorpyncha |
Anatidae |
Spot-billed duck |
|
|
p |
|
|
|
p |
|
|
Gallinula chliropus |
Rallidae |
Common moorhen |
|
|
p |
|
|
|
p |
|
|
Fulica atra |
Rallidae |
Common Coot |
|
|
p |
|
|
|
p |
|
|
Porphyrio porphyrio |
Rallidae |
Purple moorhen |
|
|
|
|
|
|
p |
|
|
Amaurornis phoenicurus |
Rallidae |
White breasted waterhen |
|
p |
p |
p |
p |
|
p |
|
|
Anas acuta |
Anatidae |
Pintail |
|
|
p |
|
|
|
p |
W V |
|
Anas crecca |
Anatidae |
Common Teal |
|
|
|
|
|
|
p |
W V |
|
Nettapus coromandelianus |
Anatidae |
Cotton Teal |
|
|
|
|
|
|
p |
|
|
Haliastur indus |
Accipitridae |
Brahaminy Kite |
p |
p |
p |
p |
p |
p |
p |
|
|
Circus aeruginosus |
Accipitridae |
Western marsh Harrier |
|
p |
|
|
|
|
p |
|
|
Accipiter badius |
Accipitridae |
Shikra |
|
p |
p |
p |
p |
|
p |
|
|
Milvus migranus |
Accipitridae |
Black Kite |
p |
p |
p |
p |
p |
p |
p |
|
|
Spilornis cheela |
Accipitridae |
Creasted serpent Eagle |
p |
p |
|
|
p |
|
p |
|
|
Esacus recurvirostris |
Burhinidae |
Great stone Plover |
p |
p |
p |
|
|
|
p |
|
|
Himantopus himantopus |
Recurvirostridae |
Black-winged stilt |
|
|
p |
|
|
|
|
|
|
Haliaeetus leucoguster |
Accipitridae |
Whitebelled sea Eagle |
p |
p |
p |
p |
p |
p |
p |
|
|
Valennus indicus |
Charadridae |
Red-wattled Lopwing |
p |
|
p |
p |
|
p |
p |
|
|
Valennus malabaricus |
Charadridae |
Yellow-wattled Lopwing |
p |
|
|
p |
|
p |
p |
|
|
Actitis hapoleucos |
Scolopacidae |
Common Sandpiper |
|
p |
p |
|
p |
|
p |
|
|
Tringa stagatilis |
Scolopacidae |
Marsh Sandpiper |
|
p |
p |
|
p |
|
p |
|
|
charadrius dubius |
Charadridae |
Little ringed Plover |
|
p |
p |
|
|
|
p |
|
|
Sterna aurantia |
Laridae |
River Tern |
|
p |
|
|
|
|
p |
|
|
Numenius arquata |
Scolopacidae |
Curlew |
|
p |
p |
|
|
|
p |
W V |
|
Numenius phaeopus |
Scolopacidae |
Whimbrel |
|
p |
p |
|
|
|
p |
W V |
|
Limosa limosa |
Charadridae |
Blacktailed Godwint |
|
p |
p |
|
|
|
p |
W V |
|
Limosa lapponica |
Charadridae |
Bartailed Godwint |
|
p |
p |
|
p |
|
p |
W V |
|
Tringa totanus |
Scolopacidae |
Redshank |
|
p |
p |
|
p |
|
p |
|
|
Tringa nebularia |
Scolopacidae |
Greenshank |
|
p |
p |
|
p |
|
p |
W V |
|
Tringa hypoleucos |
Scolopacidae |
Common Sandpiper |
|
p |
p |
|
p |
|
p |
|
|
Charadrius alexandrinus |
Charadridae |
Kentish Plover |
|
p |
p |
|
|
|
p |
|
|
Calidris minuta |
Scolopacidae |
Little stint |
|
p |
p |
|
|
|
p |
|
|
Charadrius mongolus |
Charadridae |
Lesser Sandplover |
|
p |
p |
|
|
|
p |
|
|
Chlidonias hybrida |
Laridae |
Indian whiskered Tern |
|
p |
|
|
|
|
|
R M |
|
Gelochelidon nilotica |
Laridae |
Gulbilled Tern |
|
p |
|
|
|
|
|
|
|
Hydroprogen caspia |
Laridae |
Caspian Tern |
|
p |
|
|
|
|
|
Migratory |
|
Sterna hirundo |
Laridae |
Common Tern |
|
p |
|
|
|
|
|
R M |
|
Larus fuscus |
Laridae |
Lesser blackbacked Gull |
|
p |
|
|
|
|
|
Migratory |
|
Ceryle rudis |
Alcedinidae |
Pied Kingfisher |
|
p |
p |
p |
p |
p |
p |
|
|
Alcedo atthis |
Alcedinidae |
Smallblue Kingfisher |
p |
p |
p |
p |
p |
p |
p |
|
|
Pelargopsis capensis |
Accipitridae |
Storkbilled Kingfisher |
|
p |
p |
p |
p |
|
p |
|
|
halcyon smynensis |
Alcedinidae |
White breasted kingfisher |
p |
p |
p |
p |
p |
p |
p |
|
|
Merops superciliosus |
Meropidae |
Bluecheeked Bee -Eater |
p |
p |
p |
p |
p |
p |
p |
|
|
Meropsorientalis |
Meropidae |
Small green Bee-Eater |
p |
p |
p |
p |
p |
p |
p |
|
|
Nyctyornis athertoni |
Meropidae |
Bluebearded Bee-Eater |
p |
p |
p |
p |
p |
p |
p |
|
|
Coracias bengalensis |
Coracildae |
Roller |
p |
|
p |
p |
p |
p |
p |
|
|
Upupa epops |
Upupidae |
Hoopoe |
p |
|
|
p |
|
p |
|
|
|
Pavo crstatus |
Phasianidae |
Indian Peafowl |
p |
|
|
p |
|
p |
|
|
|
Streptopelia senegalensis |
Colombidae |
Pied Kingfisher |
|
|
p |
p |
|
p |
|
|
|
Streptopelia chinensis |
Colombidae |
Spotted Dove |
p |
|
p |
p |
p |
p |
p |
|
|
Columba livia |
Colombidae |
Bluerock Pigeon |
|
|
|
|
|
|
|
|
|
psittacula cyanocephala |
Psittacidae |
Purple headed Parakeet |
p |
|
|
p |
|
p |
|
|
|
psittacula krameri |
Psittacidae |
Roseringed Parakeet |
p |
|
|
p |
|
p |
|
|
|
Eudynamys scolopacea |
Cuculidae |
Asian koel |
p |
|
|
|
|
p |
|
|
|
Centropus bengalensis |
Cuculidae |
Lesser coucal |
p |
|
|
p |
|
p |
|
|
|
Loriculus vernalis |
Psittacidae |
Indian hanging Parrot |
p |
|
|
p |
|
p |
|
|
|
Clamator jacobinus |
Cuculidae |
Pied creasted Cuckoo |
p |
|
|
|
|
p |
|
|
|
Phaenicophaeus viridirostris |
Cuculidae |
Small greenbilled Malkoha |
p |
|
|
|
|
p |
|
|
|
Anthracoceros malabarica |
Becurotidae |
Indian pied Hornbill |
p |
|
|
|
|
|
|
R M |
|
Anthracoceros coronatus |
Becurotidae |
Malabar Pied Hornbill |
p |
|
|
|
|
|
|
R M |
|
Tockus birostris |
Becurotidae |
Common grey Hornbill |
p |
|
|
|
|
|
|
|
|
Megalaima viridis |
Capitonidae |
White cheeked Barbet |
p |
|
|
|
|
|
|
|
|
Chrycicilaptes nanus |
picidae |
White naped Woodpecker |
p |
|
|
|
|
|
|
|
|
Dryocopus javensis |
picidae |
Great black Woodpecker |
p |
|
|
|
|
|
|
|
|
Pitta brachyura |
Pittidae |
Indian Pitta |
p |
|
|
|
|
p |
|
|
|
Galerida deva |
Alaudidae |
Sykes creasted Lark |
p |
|
|
p |
|
|
|
|
|
Eremopteirx grisea |
Alaudidae |
Ashy crowned sprrow lark |
p |
|
|
p |
|
|
|
|
|
Mirafra cantillans |
Alaudidae |
Singing bush lark |
p |
|
|
p |
|
p |
|
|
|
Hirundo daurica |
Hirundinidae |
Rea rumped Swallow |
p |
|
|
p |
|
p |
|
|
|
Hirundosmithii |
Hirundinidae |
Wire tailed Swallow |
p |
|
p |
p |
|
p |
p |
|
|
Oriolus oriolus |
Oriolidae |
Eurasian golden Oriole |
p |
|
|
p |
|
p |
|
|
|
Oriolus xanthornus |
Oriolidae |
Black headed Oriole |
p |
|
|
|
|
|
|
|
|
Dicrurus macrocerrcus |
Dicruridae |
Black Drongo |
p |
|
p |
p |
|
p |
p |
|
|
Dicrurusparadiseus |
Dicruridae |
Racket tailed Drongo |
p |
|
p |
p |
|
p |
p |
|
|
Gracula religiosa |
Sturnidae |
Hill Myna |
p |
|
|
|
|
|
|
|
|
Acridotheres tristis |
Sturnidae |
Common Myna |
p |
|
p |
p |
|
p |
p |
|
|
Corvus macrohynchos |
Corvidae |
Jungle Crow |
p |
|
|
|
|
|
|
|
|
Dendrocitta vagabunda |
Corvidae |
Indian treepie |
p |
|
|
|
|
p |
|
|
|
aegithina tiphia |
Campehagidae |
Common Lora |
p |
|
|
|
|
p |
|
|
|
Chloropsis aurifrons |
Lrenidae |
Goldn fronted Chloropsis |
p |
|
|
|
|
p |
|
|
|
pycnonotus jocosus |
Pycnonotidae |
Red whiskered Bulbul |
p |
|
p |
p |
|
p |
p |
|
|
Pycnonotus cafer |
Pycnonotidae |
Red vented Bulbul |
p |
|
p |
p |
|
p |
p |
|
|
Turdoides affinis |
Muscicapidae |
White headed Babbler |
p |
|
|
|
|
p |
|
|
|
Terpsiphone paradisi |
Monarchinae |
Paradise Flycatcher |
p |
|
|
|
|
p |
|
|
|
Prinia socialis |
Muscicapidae |
Ashy Prinia |
p |
|
|
|
|
p |
|
|
|
Copaychus saularis |
Muscicapidae |
Magpie Robin |
p |
|
|
p |
|
p |
|
|
|
Saxicoloides fulicata |
Muscicapidae |
Indian Robin |
p |
|
|
p |
|
p |
|
|
|
Anthus rufulus |
Motacillidae |
Paddyfield Pipit |
p |
|
|
|
|
p |
|
|
|
Motacilla maderaptensis |
Motacillidae |
Large Pied Wagtail |
p |
|
|
p |
|
p |
|
|
|
Nectarinia asiatica |
Nectarinidae |
Purple sunbird |
p |
|
|
p |
|
p |
p |
|
|
lonchura malacca |
Estrildidae |
Blackheaded Munia |
p |
|
|
p |
|
p |
p |
|
|
Lonchura punctulata |
Estrildidae |
Spotted Munia |
p |
|
|
p |
|
p |
p |
|
|
Tyto alba |
Tytonidae |
Barn Owl |
p |
|
|
|
|
|
|
|
|
Tyto capensis |
Tytonidae |
Grass Owl |
p |
|
|
|
|
|
|
|
|
Gallus soneratii |
Phasianidae |
Grey Junglefowl |
p |
|
|
|
|
p |
|
|
|
chalcophaps indica |
Columbidae |
Emerald Dove |
p |
|
|
|
|
|
|
|
|
Myiophonua horsfieldii |
Muscicapidae |
Malabar Whistling Thrush |
p |
|
|
p |
|
|
|
|
|
Monticoka solitarius |
Muscicapidae |
Blue Rock thrush |
p |
|
|
p |
|
p |
|
|
|
Parus major |
Paridea |
Great Tit |
p |
|
|
p |
|
p |
p |
|
|
Motacilla Flava |
Motacillidae |
Yellow Wagtail |
p |
|
|
p |
|
p |
p |
|
|
Ploceus philippinus |
Passeridea |
Baya Weaver |
p |
|
|
p |
|
p |
p |
|
|
Passer domesticus |
Passeridea |
House Sparrow |
|
|
|
|
|
p |
p |
|
|
Pericotus flammeus |
Campehagidae |
Scarlet minivet |
p |
|
|
|
|
|
|
|
|
|
||||||||||
|
Total birds- |
123 |
|
||||||||
|
Specific criteria based on fish |
|
|
Criteria 7 |
A wetland should support a significant proportion of indigenous fish subspecies, species of families, life-history stages, species interactions and/ or populations that are representative of wetland benefits and/or values and thereby contributes to global biological diversity |
|
Criteria 8 |
A wetland should be an important source of food for fishes, spawning ground, nursery and/or migration path on which fish stocks, either within the wetland or elsewhere, depend |
FISH BIODIVERSITY
Introduction
The fish and crustacean communities inhabiting estuaries represent a combination of freshwater and marine species, both living at the edge of their distribution, and estuary-resident and migrating species passing the estuary on their way to the spawning grounds (Day et al. 1889; Potter et al. 1990; Maes et al. 1998). Tropical estuaries are among the most modified and threatened of aquatic environments, supporting innumerable fisheries essential to the regions in which they occur (Blaber 1997). The spatial organization of estuarine species communities is highly correlated with salinity and substratum type (Henderson 1989; Bhat et al. 2014a). Fishing pressures have continued unabated. In South and Southeast Asia, the large, open estuaries, such as those of the Indus, Ganges, Kapuas, Mekong and Irrawaddi, together with the huge estuarine areas of the Bay of Bengal and the South China Sea, support the largest and the most productive of the world’s tropical estuarine fisheries (Blaber 2000).
Uttara Kannada district has a coastline of about 190 km length and is one of the districts with the most active marine and coastal fisheries along the Indian west coast. The coastline is interrupted with the mouths of five notable rivers, namely the Kali, Gangavali, Aghanashini, Sharavathi and Venkatapur. The confluences of these rivers with the ocean form small and medium-sized estuaries. The estuary of the Aghanashini has been studied in detail for finfish diversity.
Methodology
Study area: The Aghanashini estuary is located within latitudes 14.391° N to 14.585° N and longitudes 74.304° E to 74.516° E), of Kumta taluk, in Uttara Kannada district of the central west coast of Karnataka, India (Figure 2.1). The westward course and descent down the richly forest-clad Western Ghats, has made the river and its estuary very rich in biodiversity. The estuarine area is about 48 km2, and it is located between the famous temple town and tourism centre of Gokarna in the north and Kumta town in the south. Plenty of organic matter from the forests gets deposited in this estuary, making it rich in nutrients. The mangroves that flourish in the estuary also provide ideal habitats for fish breeding and confer on the fish relative safety from predators and humans. In recent years, due to the efforts of the Karnataka Forest Department, good parts of the intertidal portions have been planted with mangroves, the extent being estimated at 119 ha (Chandran et al. 2012), thereby creating a promising environment for fish diversity.
Establishing salinity zones in the estuary: Salinity perhaps is the most decisive factor that is related to fish diversity and distribution in a typical estuary. As higher salinity is important in the dynamics of fish distribution, we measured the high tide salinity, on a monthly basis, from five stations. Aghanashini and Gudkagal were sampling stations for salinity measurement in the high-salinity zone close to the seafront (Zone-I). Kodkani was the mid-estuary salinity zone (Zone-II) monitoring station. Tandarkuli and Divgi, towards the upstream portion, having an interface with fresh water, were salinity stations in Zone-III (Figure 1). Salinity measurements were made using a refractometer. Zone-I was characterized by a mean salinity greater than 20.1 ppt, Zone-II by 10.1–20 ppt and Zone-III by 0-10 ppt. Although the salinity conditions were studied through monthly samples, for salinity zone establishment we considered only the summer or pre-monsoon (March, April–May) salinities, with the rainfall being practically negligible during this period.
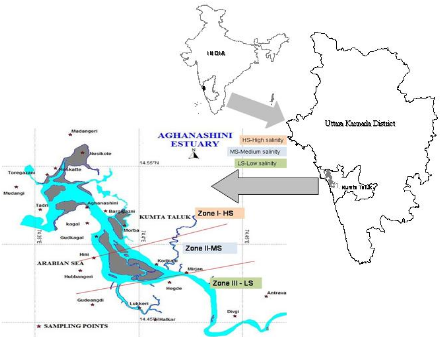
Figure 1. Aghanashini estuary and its salinity zones (high, medium and low)
Fish diversity: Fish species were inventorized from the estuarine mouth closest to the Arabian Sea, to the farthest upstream region, least impacted by the marine tides. The observations were made on the basis of catches of fishermen within each salinity zone, separately. They used diverse kinds of gears targeting different fish species as well as general ones trapping fishes irrespective of species. The collected fishes were preserved in 10 per cent formalin and identified using Day (1989), Talwar and Jhingran (1991) and Munro (2000). The unidentified ones were temporarily designated by the local names and preserved for future identification. Unidentified ones were taken to the Karnatak University Postgraduate Centre of Marine Biology, Karwar for comparison with the museum samples and for consultations.
Euryhaline and stenohaline fishes: Following the seasonal timetable of fish arrivals/appearances in the different salinity zones, fishes were classified as euryhaline, adapted to a wide range of salinities, or stenohaline, intolerant of wide fluctuations in salinity. Interviews were conducted with persons fishing in different salinity zones to determine the occurrence of individual fish species per se at different localities of the estuary during different times of the year. Moreover, a good number of publications were consulted to know more about the salinity tolerance ranges of various fish species found in Aghanashini.
Results and Discussion
Salinity zone-wise distribution of fishes: The salinity conditions fluctuated greatly seasonally. As the south-west monsoon pounds on the coastal areas and the Western Ghats, bringing in 2500-5000 mm of rainfall, a good part of it in just 4 months (June-September), the onrush of fresh water into the estuary is so high that it keeps the salinity at the zero level for a good number of days. This time is not congenial for fishes requiring high salinity all the time (stenohaline marine fishes). With the rainy season tapering off almost completely by October–November, the salinity rises steadily during the post-monsoon months (October–January), when the salinity in the lower reaches of the estuary, towards the seafront, reaches 27 ppt. The mid-estuary portion exhibits a salinity of around 17 ppt at that time. The salinity continues to rise during the pre-monsoon period, beginning in February, attaining a mean value of 32 ppt towards the river mouth, and even in the upper reaches, it reaches a mean value of 15 ppt, while towards the mid-estuary the salinity averages around 21 ppt. In fact, the period from mid-November to almost the end of May may be nearly rainless or interrupted by a few summer showers, hardly having any perceptible impact on the salinity of the estuary. In May, it touched 36 ppt in Zone–I, at the Aghanashini station, and 31 ppt, at the Gudkagal station. The monthly salinity levels in the five stations, covering the three zones, are shown in Figure 2 and Table 1. In all the three zones, we measured the high tide salinity every month and obtained the average for the season. The average values are shown in Table 2.
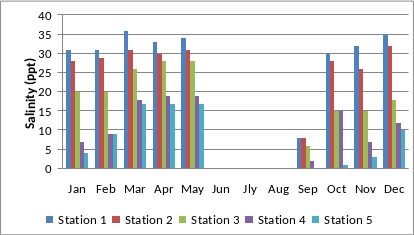
Figure 2. Month-wise high tide salinity at five sampling stations of Aghanashini estuary
Table 1. Month-wise high tide salinity (ppt) at five sampling stations of Aghanashini estuary
|
Salinity Zone No. |
Station |
January |
February |
March |
April |
May |
June |
July |
August |
September |
October |
November |
December |
|---|---|---|---|---|---|---|---|---|---|---|---|---|---|
|
I |
Aghanashini (Station 1) |
31 |
31 |
36 |
33 |
34 |
0 |
0 |
0 |
8 |
30 |
32 |
35 |
|
I |
Gudkagal (Station 2) |
28 |
29 |
31 |
30 |
31 |
0 |
0 |
0 |
8 |
28 |
26 |
32 |
|
II |
Kodkani (Station 3) |
20 |
20 |
26 |
28 |
28 |
0 |
0 |
0 |
6 |
15 |
15 |
18 |
|
II |
Tandrakuli (Station 4) |
7 |
9 |
18 |
19 |
19 |
0 |
0 |
0 |
2 |
15 |
7 |
12 |
|
III |
Divagi (Station 5) |
4 |
9 |
17 |
17 |
17 |
0 |
0 |
0 |
0 |
1 |
3 |
10 |
Table 2. Average high tide salinity (ppt), based on observations for 12 months, from five sampling sites in the Aghanashini estuary
|
Sampling Zones |
Localities |
Average Salinity |
Highest Recorded |
Lowest Recorded |
|---|---|---|---|---|
|
Zone-I |
Aghanashini |
22.5 |
36 |
0 |
|
Gudkagal |
20.2 |
32 |
0 |
|
|
Zone-II |
Kodkani |
14.6 |
28 |
0 |
|
Zone-III |
Tandrakuli |
9 |
19 |
0 |
|
Divagi |
6.5 |
17 |
0 |
Fish diversity in Aghanashini estuary: The year-round and season-wise survey of finfish species enabled us to inventory 77 species. Field specimens were identified using standard keys. These species were classified according to their habitat preference in relation to the marine–freshwater continuum at the confluence of the river with the sea (Table 3).
Table 3. Habitats of finfish species of Aghanashini estuary
|
S. No. |
Family |
Scientific Name |
Common Name |
Local Names (Kannada) |
|
Basically marine fishes |
||||
|
1 |
Carangidae |
Carangoides praeustus |
Brownback trevally |
Haluguruku |
|
2 |
Scombridae |
Rastrelliger kanagurta |
Mackerel |
Bangade |
|
3 |
Scombridae |
Scomberomorus commerson |
Narrow-barred Spanish mackerel |
Iswana |
|
4 |
Nemipteridae |
Nemipterus japonicus |
Japanese threadfin bream |
Rane menu |
|
5 |
Serranidae |
Cephalopholis boenak |
Blue-lined coral cod |
Gobrya, kallumurge |
|
6 |
Serranidae |
Epinephelus bleekeri |
Bleeker’s reef cod |
Gobrya |
|
7 |
Bothidae |
Crossorhombus azureus |
Blue spotted flounder |
Masur leppe |
|
8 |
Paralichthyidae |
Pseudorhombus javanicus |
Javan flounder |
Nengu |
|
9 |
Stromatidae |
Pampus argenteus |
Silver pomfret |
Bili manji |
|
10 |
Rhinobatidae |
Glaucostegus halavi |
Halavi ray |
Balagende torke |
|
11 |
Siganidae |
Siganus argenteus |
Streamlined spine foot |
Baana |
|
12 |
Scaridae |
|
Parrot fish |
|
|
13 |
Batrachoididae |
Colletteichthys dussumieri |
Flat toad fish |
Gonke |
|
Marine-estuarine |
||||
|
1 |
Ariidae |
Arius arius |
Threadfin sea catfish |
Bilisady |
|
2 |
Ariidae |
Arius caelatus |
Engraved sea catfish |
Gonde sady |
|
3 |
Belonidae |
Strongylura leiura |
Banded needle fish |
Burkaandi |
|
4 |
Carangidae |
Atule mate |
Yellowtail scad |
Guruku |
|
5 |
Carangidae |
Carangoides chrysophrys |
Longnose trevally |
Kokkara |
|
6 |
Carangidae |
Megalaspis cordyla |
Torpedo trevally |
Guruku |
|
7 |
Carangidae |
Caranx ignobilis |
Giant kingfish |
Guruku |
|
8 |
Carcharhinidae |
Scoliodon sp. |
Shark |
Sora |
|
9 |
Clupeidae |
Opisthopterus tardoore |
Tardoore |
Pachage |
|
10 |
Clupeidae |
Sardinella fimbriata |
Fringescale sardinella |
Pedi |
|
11 |
Cynoglossidae |
Cynoglossus macrostomus |
Malabar sole |
Leppe |
|
12 |
Cynoglossidae |
Paraplagusia bilineata |
Double-lined tongue sole |
Leppe |
|
13 |
Dasyatidae |
Himantura bleekeri |
Bleeker’s whip ray |
Hola |
|
14 |
Engraulidae |
Stolephorus indicus |
Indian anchovy |
Belanji |
|
15 |
Engraulidae |
Stolephorus commersonnii |
Commerson’s Anchovy |
Dodda danashi |
|
16 |
Engraulidae |
Thryssa mystax |
Moustached thryssa |
Vaintali |
|
17 |
Engraulidae |
Thryssa malabarica |
Malabar thryssa |
Vaintali |
|
18 |
Engraulidae |
Thryssa setirostris |
Long jaw thryssa |
Vaintali |
|
19 |
Gobiidae |
Trypauchen vagina |
Burrowing goby |
Bombale |
|
20 |
Hemiramphidae |
Hemiramphus far |
Black barred half beak |
Toli |
|
21 |
Lactariidae |
Lactarius lactarius |
False trevally |
Samdale |
|
22 |
Leiognathidae |
Leiognathus splendens |
Blacktip ponyfish |
Guruku |
|
23 |
Leiognathidae |
Secutor insidiator |
Pugnose ponyfish |
Guruku |
|
24 |
Lobotidae |
Lobotes surinamensis |
Tripletail |
Pavade |
|
25 |
Lutjanidae |
Lutjanus johnii |
John’s snapper |
Hottekemsa |
|
26 |
Lutjanidae |
Lutjanus russelli |
Russell’s snapper |
Kemsa |
|
27 |
Pempheridae |
Pempheris molucca |
Mollucan sweeper |
Ramachi |
|
28 |
Platacidae |
Drepane punctata |
Spotted sickle fish |
Chandaka |
|
29 |
Platacidae |
Platax orbicularis |
Orbicular bat fish |
Manji |
|
30 |
Platycephalidae |
Grammoplites scaber |
Rough flathead |
Vadati |
|
31 |
Pomadasyidae |
Pomadasys maculatus |
Saddle grunt |
Guruku |
|
32 |
Sciaenidae |
Chrysochir aureus |
Reeve’s croaker |
Mooru hallin banagu |
|
33 |
Sciaenidae |
Otolithes ruber |
Tigertooth croaker |
Banagu, Dodi |
|
34 |
Sciaenidae |
Johnius belangeri |
Belanger’s croaker |
Banagu |
|
35 |
Siganidae |
Siganus vermiculatus |
Vermiculated spinefoot |
Baana, Padiyar |
|
36 |
Sillaginidae |
Sillago sihama |
Silver sillago |
Nogla |
|
37 |
Soleidae |
Synaptura commersonnii |
Commerson’s sole |
Leppe |
|
38 |
Sphyraenidae |
Sphyraena barracuda |
Great barracuda |
Onakaandi |
|
39 |
Sphyraenidae |
Sphyraena obtusata |
Obtuse barracuda |
Hallin kaandi |
|
40 |
Stromatidae |
Parastromateus niger |
Black pomfret |
Kari manji |
|
41 |
Tetraodontidae |
Arothron stellatus |
Starry blow fish |
Chonja |
|
42 |
Triacanthidae |
Triacanthus biaculeatus |
Short-nosed tripod fish |
Kuduremeenu, kadbale |
|
43 |
Trichiuridae |
Trichiurus lepturus |
Largehead hairtail |
Barik hamle |
|
Estuarine |
||||
|
1 |
Cichilidae |
Etroplus suratensis |
Pearl spot |
Kagalse |
|
Estuarine–freshwater |
||||
|
1 |
Synbranchidae |
Monopterus albus |
Asian swamp eel |
Kolav |
|
Marine–estuarine–freshwater |
||||
|
1 |
Ambassidae |
Ambassis ambassis |
Commerson’s glassy perchlet |
Burante |
|
2 |
Apogonidae |
Apogon hyalosoma |
Humpbacked cardinal fish |
Burante |
|
3 |
Centropomidae |
Lates calcarifer |
Barramundi, seabass |
Kurude |
|
4 |
Clupeidae |
Tenualosa ilisha |
River shad |
Malati pedi |
|
5 |
Cyanoglossidae |
Cyanoglossus punticeps |
|
|
|
6 |
Gerridae |
Gerres filamentosus |
Threadfin silverbiddy |
Girbaingi |
|
7 |
Gerridae |
Gerres limbatus |
Saddleback silverbiddy |
Mundbaingi |
|
8 |
Gobiidae |
Glossogobius giuris |
Tank goby |
Bili mandli |
|
9 |
Gobiidae |
Acentrogobius griseus |
Grey gobi |
Kari mandli |
|
10 |
Leiognathidae |
Secutor ruconius |
Deep pugnose ponyfish |
Guruku |
|
11 |
Mugilidae |
Mugil cephalus |
Flathead grey mullet |
Madle |
|
12 |
Lutjanidae |
Lutjanus argentimaculatus |
Mangrove red snapper |
Eri |
|
13 |
Mugilidae |
Liza parsia |
Goldspot mullet |
Madle |
|
14 |
Ophichthidae |
Caecula polyopthalmus |
Ocellated sand-eel |
Hemalga |
|
15 |
Ophichthyidae |
Pisodonophis cancrivorus |
Snake eel |
Aragotka |
|
16 |
Polynemidae |
Eleutheronema tetradactylum |
Four-finger threadfin |
Raws |
|
17 |
Scatophagidae |
Scatophagus argus |
Spotted scat |
Hulka |
|
18 |
Teraponidae |
Terapon jarbua |
Crescent perch |
Kumbari, garge |
|
Uncertain habitat |
||||
|
1 |
Scorpinidae |
Scorpeana haplodactylus |
|
|
|
Total number of identified finfish species from estuary |
77 |
|||
Fish distribution in relation to salinity: Salinity has been noted as being the most decisive factor in the distribution of fishes in the Aghanashini estuary. Of the fishes identified 56 species have been assigned to the three salinity zones (Zone-I, high; Zone-II, medium; and Zone-III, low). The occurrence of the fishes in each zone was seasonally identified (R, rainy season/monsoon; W, winter season/post-monsoon; S, summer season/pre-monsoon). The assignments are given in Table 4.
Table 4. Occurrence of fishes in relation to different salinity zones during the three seasons: Rainy (R), Winter (W) and Summer (S)
|
S. N. |
Family |
Scientific Name |
Local Names (Kannada) |
Zone-I |
Zone-II |
Zone-III |
Remarks |
||||||
|
|
|
|
|
R |
W |
S |
R |
W |
S |
R |
W |
S |
|
|
1 |
Ambassidae |
Ambassis commersoni |
Burante 1 |
+ |
+ |
+ |
- |
- |
- |
+ |
+ |
+ |
|
|
2 |
Apogonidae |
Apogon hyalosoma |
Burante 2 |
+ |
+ |
+ |
- |
- |
- |
+ |
+ |
+ |
|
|
3 |
Ariidae |
Arius arius |
(Catfish bilisady) |
+ |
+ |
+ |
+ |
+ |
+ |
- |
- |
- |
|
|
4 |
Ariidae |
Arius caelatus |
Catfish (gonde sady) |
+ |
+ |
+ |
+ |
+ |
+ |
- |
- |
- |
|
|
5 |
Batrachoididae |
Austrobatrachus dussumeri |
Gonke/gorke |
+ |
+ |
+ |
+ |
+ |
+ |
+ |
+ |
+ |
Rare in Zone-II |
|
6 |
Belonidae |
Strongylura leiura |
Burkaandi |
- |
- |
- |
+ |
- |
- |
- |
- |
- |
Rare |
|
7 |
Carangidae |
Caranx praeustus |
Guruku1 |
+ |
+ |
+ |
+ |
+ |
+ |
+ |
+ |
+ |
Mainly marine |
|
8 |
Carangidae |
Carangoides chrysophrys |
Kokkara |
+ |
+ |
+ |
+ |
+ |
+ |
+ |
+ |
+ |
Peak in winter in Zone-I |
|
9 |
Carangidae |
Carangoides praeustus |
Haluguruku |
- |
- |
- |
- |
+ |
+ |
+ |
- |
- |
|
|
10 |
Carangidae |
Carangoides sp. |
Halu kokkara |
+ |
+ |
+ |
+ |
+ |
+ |
+ |
+ |
+ |
|
|
11 |
Cichilidae |
Etroplus suratensis |
Banded pearl spot (kagalse) |
+ |
+ |
+ |
+ |
+ |
+ |
+ |
+ |
+ |
Peak in Zone-I in rains; Zone-II in winter Brackish |
|
12 |
Clupeidae |
Sardinella fimbriata |
Pedi |
+ |
+ |
+ |
+ |
+ |
+ |
+ |
+ |
+ |
|
|
13 |
Pristigasteridae |
Opisthopterus tardoore |
Pachage |
+ |
+ |
+ |
- |
- |
- |
- |
- |
- |
|
|
14 |
Cynoglossidae |
Paraplagusia bilineata |
Leppe 2 |
+ |
+ |
+ |
+ |
+ |
+ |
+ |
+ |
+ |
|
|
15 |
Cynoglossidae |
Cynoglossus macrostomus |
Leppe 3 |
+ |
+ |
+ |
+ |
+ |
+ |
+ |
+ |
+ |
|
|
16 |
Engraulidae |
Stolephorus indicus |
Indian anchovy (belanji) |
+ |
+ |
+ |
- |
- |
- |
- |
- |
- |
Marine; peak presence in summer |
|
17 |
Engraulididae |
Stolephorus commersonnii |
Commerson’s anchovy (dodda danashi) |
- |
- |
+ |
- |
- |
- |
- |
+ |
- |
|
|
18 |
Gerridae |
Gerres filamentosus |
Girbaingi |
+ |
+ |
+ |
- |
- |
- |
+ |
- |
- |
Throughout estuarine presence likely |
|
19 |
Gerridae |
Gerres limbatus |
Mundbaingi |
+ |
+ |
+ |
- |
- |
- |
- |
- |
- |
|
|
20 |
Gobiidae |
Glossogobius giuris |
Bili mandli |
+ |
+ |
+ |
- |
- |
- |
- |
- |
- |
Fresh to brackish |
|
21 |
Lactariidae |
Lactarius lactarius |
Samdale |
- |
- |
+ |
- |
- |
- |
- |
- |
- |
|
|
22 |
Latidae |
Lates calcarifer |
Seabass (kurude) |
+ |
+ |
+ |
+ |
+ |
+ |
+ |
+ |
+ |
Coastal and estuarine |
|
23 |
Leiognathidae |
Secutor insidiator |
Guruku |
+ |
+ |
+ |
+ |
+ |
+ |
+ |
+ |
+ |
|
|
24 |
Lutjanidae |
Lutjanus johni |
Hottekemsa |
- |
- |
- |
+ |
+ |
+ |
- |
- |
- |
Estuarine |
|
25 |
Lutjanidae
|
Lutjanus russelli - |
Russell’s snapper (kemsa) |
+ |
+ |
+ |
+ |
+ |
+ |
+ |
+ |
+ |
Estuarine |
|
26 |
Lutjanidae
|
Lutjanus argentimaculatus |
Eri |
+ |
+ |
+ |
+ |
+ |
+ |
+ |
+ |
+ |
Estuarine |
|
27 |
Mugilidae
|
Mugil cephalus |
Madle |
+ |
+ |
+ |
+ |
+ |
+ |
+ |
+ |
+ |
Peak in September |
|
28 |
Mugilidae |
Liza parsia |
Madle |
+ |
+ |
+ |
+ |
+ |
+ |
+ |
+ |
+ |
Peak in September |
|
29 |
Nemipteridae |
Nemipterus japonicus |
Rane menu |
+ |
+ |
+ |
- |
- |
- |
- |
- |
- |
|
|
30 |
Paralichthyidae |
Pseudo rhombus javanicus |
Nengu |
+ |
+ |
+ |
- |
- |
- |
+ |
+ |
+ |
|
|
31 |
Platacidae |
Platax orbicularis |
Round bat fish |
+ |
+ |
+ |
- |
- |
- |
- |
- |
- |
|
|
32 |
Platycephalidae |
Platycephalus scaber |
Vadati |
+ |
+ |
+ |
+ |
+ |
+ |
+ |
+ |
+ |
|
|
33 |
Pomadasyidae |
Pomadasys maculatus |
|
|
|
|
|
|
|
|
|
|
|
|
34 |
Rhinobatidae |
Glaucostegus halavi |
Balagende torke |
- |
- |
+ |
- |
- |
- |
- |
- |
- |
|
|
35 |
Dasyatidae |
Himantura bleekeri |
Bleeker’s whip ray |
- |
- |
+ |
- |
- |
- |
- |
- |
- |
|
|
36 |
Scatophagidae |
Scatophagus argus |
Spotted scat (hulka) |
+ |
+ |
+ |
- |
+ |
+ |
- |
+ |
+ |
Marine- in estuary for feeding |
|
37 |
Sciaenidae |
Otolithes ruber |
Banagu, dodi |
+ |
+ |
+ |
+ |
+ |
+ |
+ |
+ |
+ |
Peak in Zone-I in rains |
|
38 |
Scombridae |
Rastrelliger kanagurta |
Mackerel (bangade) |
- |
- |
+ |
- |
- |
- |
- |
- |
- |
Marine in Zone-I in summer |
|
39 |
Scombridae |
Scomberomorus commerson |
Iswana |
- |
- |
+ |
- |
- |
- |
- |
- |
- |
Marine, rare |
|
40 |
Serranidae |
Cephalopholis boenak |
Gobrya (kallumurge) |
+ |
+ |
+ |
+ |
+ |
+ |
+ |
+ |
+ |
|
|
41 |
Siganidae |
Siganus vermiculatus |
Baana/padiyar |
+ |
+ |
+ |
+ |
+ |
+ |
+ |
+ |
+ |
|
|
42 |
Sillaginida |
Sillago sihama |
Nogla |
+ |
+ |
+ |
+ |
+ |
+ |
+ |
+ |
+ |
Peak in rainy season |
|
43 |
Soleidae |
Synaptura commersoniana |
Commerson’s sole (leppe) |
+ |
+ |
+ |
+ |
+ |
+ |
+ |
+ |
+ |
|
|
44 |
Sphyraenidae |
Sphyraena barracuda |
Onakaandi |
+ |
+ |
+ |
- |
+ |
- |
+ |
+ |
+ |
|
|
45 |
Sphyraenidae |
Sphyraena obtusata |
Hallin kaandi |
+ |
+ |
+ |
- |
- |
- |
- |
- |
- |
Rare |
|
46 |
Sphyraenidae |
Sphyraena sp. |
Suji kaandi |
+ |
+ |
+ |
+ |
+ |
+ |
- |
- |
- |
Rare |
|
47 |
Belonidae |
Strongylura leiura |
Bura kaandi |
+ |
+ |
+ |
+ |
+ |
+ |
- |
- |
- |
Rare |
|
48 |
Stromatidae |
Pampus argenteus |
Bili manji |
- |
+ |
- |
- |
- |
- |
- |
- |
- |
Marine; visits estuary in winter |
|
49 |
Stromatidae |
Parastromateus niger |
Kari manji |
- |
+ |
- |
- |
- |
- |
- |
- |
- |
Marine; visits estuary in winter |
|
50 |
Synbranchidae |
Monopterus albus |
Kolav |
+ |
+ |
+ |
- |
- |
- |
- |
- |
- |
Rare |
|
51 |
Teraponidae |
Terapon jarbua |
Kumbari |
+ |
+ |
+ |
+ |
+ |
+ |
+ |
+ |
+ |
Marine to nearly fresh water |
|
52 |
Triacanthidae |
Triacanthus biaculeatus |
Kudure meenu |
+ |
+ |
+ |
- |
- |
- |
- |
- |
- |
|
|
53 |
Trichiuridae |
Trichiurus lepturus |
Barik hamle |
+ |
- |
+ |
- |
- |
- |
- |
- |
- |
|
|
54 |
Ophichthinae |
Pisodonophis cancrivorus |
Aragotka |
+ |
+ |
+ |
+ |
+ |
+ |
+ |
+ |
+ |
Marine to fresh water |
|
55 |
Tetraodontidae |
Chonja |
Puffer fish |
+ |
+ |
+ |
+ |
+ |
+ |
+ |
+ |
+ |
|
|
56 |
Carcharhinidae |
Scoliodon sp. |
Shark (sora) |
- |
- |
- |
+ |
+ |
+ |
+ |
- |
- |
Marine; presence in winter only |
Stenohaline marine fishes in the estuary: It was found that when the salinity reached the peak in summer, some of the primarily marine fishes, of commercial importance, especially the ray fishes (Glaucostegus), mackerel (Rastralliger kanagurta), narrow-barred Spanish mackerel (Scomberomorus commerson), Lactarius lactarius and anchovies (Stolephorus commersonnii), were found to enter the high-salinity zone of the estuary. These are not obligatory estuary-dependent for completing their life cycles; they mainly use the lower reaches of the estuary (Zone-III) as feeding grounds opportunistically when the salinity conditions are within their osmotic tolerance ranges.
The ray fishes (family Rhinobatidae), preferring shallow coastal waters, feed on benthic organisms, mainly molluscs and crustaceans. Rays are common along the Indian coast. They prefer sandy bottoms. Rays even bask in the intertidal zone of the sea and are exposed for short spells when the waves recede. When there is any danger they wriggle into the sea on a sloping beach. Glaucostegus halavi is known to attain lengths of nearly 2 m, including its whip-like tail (Day 1889; Munro 2000). The estuarine mouth of Aghanashini is rich in molluscan beds, which are probably good feeding grounds for these ray fishes.
The seer fish or narrow-barred Spanish mackerel (Scomberomorus commerson), locally known as surmai or iswan is a highly priced table fish. It may exceed 1 m in length. Seer fishes usually feed on sardines and anchovies.
The mackerel (Rastrelliger kanagurta) is caught in very large quantities in Indian waters and supports the major fishery of the west coast. Enormous shoals appear during October–January. Of the genus Rastrelliger, only kanagurta enters inshore waters; the others are confined to offshore regions only. The weakening of the south-west monsoon is associated with prolific plankton productivity in the inshore waters, which could be the main factor for the shoals of mackerel appearing along the west coast. Moreover, the fish is known to lay eggs more in coastal waters than in offshore areas during April–September (Wealth of India, IV, Suppl. 2003). It may be the favourable salinity conditions and the high production of planktonic food that attract mackerel into Zone-I of the estuary. This fish is caught in the high-salinity zone particularly during the summer months. The bulk of the seasonal catch being in the inshore waters, within 4 km from the shore, the mackerel fishery is very important for the subsistence of the artisanal fisherfolk.
The silver pomfret (Pampus argenteus) (Kan: Bilimanji) is a delicious and high-value marine fish. Zooplankton constitutes its main food. Shoals occur in shallow muddy inshore waters. The pomfrets show a tendency to migrate into the estuaries when young. They were reported to be abundant in March in the Sundarbans and in Mumbai. June–September was considered a good period for the Malabar coast (Wealth of India, IV, Suppl. 2003). In the Aghanashini estuary the fish occurs in Zone-1 during the winter months.
The Japanese threadfin bream (Nemipterus japonicus) (Kan: Ranemeenu) is a demersal, bottom-living species, found also in coastal waters on muddy or sandy bottoms. This is a valued food fish. Males grow faster and to a larger size than females. This fish feeds on a wide range of bottom-living animals including worms, crustaceans, mussels, cephalopods and fishes. Found only in Zone-I of Aghanashini, where the salinity is high.
The rock-cod groupers are long and robust-bodied fishes of primarily marine waters; some also occur in the estuaries. The blue-lined coral cod (Cephalophalis boenak) (Kan: Gobrya) has a reddish brown body with or without darker vertical bars. Found in coastal waters (FAO 1984; Munro 2000). It occurs throughout the estuary and is expected to be widely tolerant of salinity changes.
Marine–estuarine fishes
The tiger-toothed croaker (Otolithes ruber) (Kan: Banagu) belongs to the community of croakers, or sciaenids, which are associated with the warm coastal waters and estuaries of the world. Many species use the estuary as a nursery and feeding ground for the young. (Talwar and Jhingran 1991). O. ruber is a sluggish carnivore, inhabiting mainly sandy and muddy areas. The spawning season for the majority of sciaenid species in Indian waters is during the monsoon and post-monsoon months. During the protracted spawning period, spanning over 6 months, individual fishes spawn twice (Mohanraj et al. 2003). In the Aghanashini estuary, O. ruber occurs throughout the year in all the three salinity zones, benefitting the local fisheries greatly. It occurs in greater abundance in Zone-I, towards the river mouth, during the rainy season.
The double lined tonguesole (Paraplagusia bilineata) (Kan: Leppe) is a sole fish with a flat tongue-shaped body. It lives in sandy to muddy bottoms of the continental shelf and enters shallow estuarine waters (Talwar and Jhingran 1991; Sommer et al. 1996).
The threadfin sea catfish (Arius arius) (Kan: Sady) is a robust-bodied, long fish. Though the genus Arius is associated with seas, estuaries, tidal rivers and brackish-water lakes, A. arius is almost exclusive to the brackish waters of estuaries and tidal rivers (Talwar and Jhingran 1991). A notable food fish of Aghanashini, it occurs both in Zone-I and in Zone-II throughout the year and avoids Zone-III (lowest salinity).
The vermiculated spine foot (Siganus vermiculatus) (Kan: Baana) is one of the largest of the rabbit fishes. It is a herbivore found in the mangrove swamps. Its spawning cycle is linked to the phase of the moon. The eggs are sticky and laid at the bottom, and the larvae are pelagic (surface dwellers). The juveniles live in small schools in brackish to fresh water among mangrove roots. The young and adults are found mainly in the shallow, muddy waters of mangrove swamps, where they move in and out with the tides. The adults have also been reported from coral reef areas. The females can reach 45 cm in length and weigh 2.3 kg. The coloration is a vermiculated pattern of brown lines on a silvery bluish background over the entire head and body. Changes in the color pattern occur during spawning (Gunderman et al. 1983). This fish is found throughout the estuary, in all the salinity zones.
Marine–estuarine–freshwater
The mullets are important estuarine fishes of Uttara Kannada. These carnivorous and high-value fishes inhabit coastal waters, including estuaries and rivers. They are highly adaptable to changes in salinity. Though most mullets spawn at sea, the young enter the estuaries, their main nursery area. They have a remarkably uniform appearance and anatomy and can be distinguished by the elongated, slightly compressed body, depressed head, short snout and eyes partly covered by fatty tissue. The small mouth, either toothless or with tiny teeth, is towards the tip of the snout or on its underside. Of the two species found in Aghanashini, Mugil cephalus (flathead mullet) is cosmopolitan, widely distributed in coastal waters, lagoons, and estuaries. It has a more robust body, up to 91 cm long, with a broad head that is greatly flattened dorsally and has thin lips. The colour on the back is olive green, silvery on the flanks, shading to white below. The fish has six or seven indistinct brown bands down the flanks, and it has a dark purple blotch at the base of the pectoral fin. The dorsal and caudal fins have dusky margins. The fish is capable of surviving in coastal ponds with high salinity levels (Talwar and Jhingran 1991). This mullet is ideally suited for aquaculture (Hsu et al. 2007) and is reported to flourish in the fresh water tanks of Chennai (Wealth of India, IV, Suppl., 2003).
The goldspot mullet (Liza parsia) (Kan: Madle) grows 15–19 cm in one year and spawns in the sea (Talwar and Jhingran 1991). The live fish are greenish brown above, white to silvery below, with golden spots on the operculum and anal and caudal fins, which are yellowish. This mullet inhabits shallow coastal waters, estuaries and lagoons; entering tidal rivers. Its maximum length of 40 cm was attained in natural waters and 25 cm in pond cultures. Spawning takes place at sea (Day 1889). This is primarily a detritus feeder, supplementing its food with diatoms and filamentous algae.
Scats are small estuarine fishes found in harbours, estuaries and lower reaches of freshwater rivers. Body disc shaped, deep and strongly compressed. Head small; mouth is also small but not of protruding type. It is generally believed that these fishes spawn in the neighbourhood of coral reefs but the young migrate into the river mouths and other estuarine areas until they grow large enough, ready to go back to the sea.
Of the scats, the spotted scat (Scatophagus argus) (Kan: Hulka), also known as the leopard pomfret, is the one most frequently found in the coastal waters of India. It inhabits harbours, natural embayments, estuaries and lower reaches of freshwater rivers, frequently occurring among mangroves. It attains a length of 30 cm at maturity (Talwar and Jhingran 1991). It is uniform greenish silvery, bluish-silver or coffee-brown with a delicate golden sheen, especially on the back. There are numerous greenish-black spots, mainly confined to the upper portion of the sides. Although tasty and shaped like a pomfret, this fish is not highly sought after, and the poorer people are the major consumers; it may be the prominent dots and the tougher skin that deter the richer consumers. The fish feeds mainly on multicellular algae and detritus. It is suitable for farming in brackish water (Day 1889; Gandhi 2002). The juveniles move towards fresh water while the mature ones move towards the sea. The fish enters the estuaries mainly for feeding, the mangrove swamps being preferred habitats. Wongchinawit and Paphavasit (2009) reported that the fish spawns in the mangrove areas of estuaries in Thailand. The larvae feed on microplankton in the water column; the juveniles feed on mainly phytoplankton and to lesser extent zooplankton, benthos, insects and detritus. The adults feed on plankton, benthos and detritus in mangrove habitats.
In the Aghanashini estuary, this fish occurs in all the three salinity zones. Whereas in the high-salinity zone, closer to the sea, it is found throughout the year, it tends to avoid Zone-II and Zone-III during the rainy season, when the salinity is practically nil. Nevertheless, according to the Wealth of India (Wealth of India, IV, Suppl. 2003), it is amenable to culture in brackish water and easily adapts to fresh waters.
The seabass (Lates calcarifer) (Kan: Kurudi) inhabits coastal, estuarine and other brackish water areas. Catches are landed mainly in winter. The fish enters estuaries and backwaters for food and shelter but always returns to marine environments for spawning, mainly during June/July, when the estuaries are flooded and the salinity is at the lowest level (Talwar and Jhingran 1991). The species adapts to fresh waters in tanks with ample fish and crustaceans, being a voracious carnivore. It also feeds on shrimps, worms and snails, making it unsuitable for mixed culture. It attains a length of 46 cm in one year. This species is esteemed as a food fish and is a good game fish (Wealth of India, IV, Suppl. 2003). The juveniles of this euryhaline species migrate into estuaries and brackish waters. The fish generally spawns from January to August in India (James and Marichamy 1986).
Whitings constitute a diverse family of fishes associated with shallow sandy bottoms of shores of bays and creeks and estuaries (Shamsan 2008). A notable member of the group, the silver sillago (Sillago sihama) (Kan: Nogla), grows to 25–30 cm (Wealth of India, IV, Suppl. 2003; http://www.iucnredlist.org). It is associated with shallow sandy bottoms of shores and bays, as well as estuaries. It moves considerable distances upstream in the estuary. It has the habit of burrowing itself in the sand when alarmed. The fish is much sought after but expensive due to less availability. It is considered good particularly nourishing for nursing mothers (Wealth of India, IV, Suppl. 2003). S. sihama is heavily dependent on estuaries and is found throughout the year in all the three salinity zones of Aghanashini. In Sharavathi estuary, most of the time inundated with fresh water from upstream hydel projects, this fish is an important product. In the Zuari estuary of Goa, Shamsan et al. (2008) recorded a prolonged breeding season from June to December, with spawning activity peaking during the period from September to November.
Commerson’s glassy perchlet (Ambassis commersoni) (Kan: Burante) is both marine and estuarine and enters fresh water as well (http://www.marinespecies.org). Its elongate and fairly broad body attains a length of 16 cm. It is a rather cheap but tasty fish and caters to the protein needs of the poor (Talwar and Jhingran 1991). Though it was recorded from Zone-I and Zone-III only, it is likely to occur in the middle zone as well.
The humpbacked cardinal fish (Apogon hyalosoma) (Kan:Burante) is able to survive in marine, brackish and freshwater conditions. Adults inhabit mangrove estuaries, tidal creeks and lower reaches of freshwater streams. Feeds on zoo benthos (Fishbase.org).
The whipfin silver biddy (Gerres filamentosus) (Kan: Gir-baingi) attains a length of 20 cm at maturity. It is omnivorous, feeding mainly on crustaceans, bivalves, polychaetes, gastropods, coelenterates, small fishes and miscellaneous items including plant material (Day 1889). A study in the nearby Sharavathi estuary reveals a decline in its feeding activity during the peak rainy months of July–September, which coincide with its spawning period (Golikatte and Bhat 2011). Its occurrence in the Sharavathi estuary, which has a very low salinity level (<2 ppt most of the year) could be taken as proof of its tolerance of a wide range of salinity from near-freshwater conditions to marine waters. Its occurrence is more towards Zone-I in Aghanashini estuary.
The bar-eyed goby (Glossogobius giuris) (Kan: Bili-mandli) is considered a freshwater fish of the plains of India that sometimes occurs in brackish water also (Wealth of India, Suppl. 2003). Rao and Rao (2002) consider it to be basically an estuarine fish that occurs quite frequently in fresh waters too, whereas Talwar and Jhingran (1991) consider it as a fish of both fresh and estuarine waters and the sea. However, in our study area, the fish was mainly found in Zone-I in all the seasons. According to Fishbase (www.fishbase.org), it attains a much larger size in brackish water than in fresh water.Though it is a tough fish externally, its meat is tastier, and priced reasonably high in the local markets, but it seldom ever occurs in abundance. The fish is a burrower in the mud and sand, for which habit its shovel-like head is ideal. It also enters the crevices and holes at the bases of mangrove trees. A carnivore, it feeds on copepods, cladocerans, post-larvae and juveniles of shrimp and fish, insect larvae, polycheates, etc. On the east coast it is reported to be occurring in shrimp and fish culture ponds in considerable numbers, where it not only competes for food and space but also preys upon them, thereby causing severe losses to the culturists (Rao and Rao 2002).
Brackish and fresh water inhabiting
The pearl spot (Etroplus suratensis) (Kan: Kagalsi) is distributed along the west and east coasts of India and the coast of Sri Lanka. It tolerates a wide range of salinity conditions. It is found in coastal fresh and saline waters and is ideal for culturing in both brackish water and freshwater conditions. It attains a length of 10–13 cm in one year, and under freshwater conditions, a maximum length of 31 cm was reported (Wealth of India, IV, Suppl. 2003). The fish is one of the most sought-after table fish in Kerala, despite its being highly thorny. It breeds twice a year, during May–June and November–February, both in saline and fresh waters.
Estuarine–marine fishes
Snappers constitute a pan-tropical family of 17 genera of predominantly marine and coastal areas. Just one genus, Lutjanus, is associated with estuaries. They are predacious marine fishes, often brightly coloured and with compressed bodies and fairly large mouths. The spawning of most tropical snappers occurs over a considerable part of the year and may take place year-round in some species. Spawning peaks generally coincide with periods of warm water temperatures (Russell and McDougall 2008).
The river snapper (Lutjanus argentimaculatus) (Kan: Eri) is a large fish with a dark rose or reddish brown colour, dull cherry below. The juveniles usually inhabit mangrove and shallow water areas, but the adults are found to a depth of 80 m in the sea (Talwar and Jhingran 1991). The river snapper is a highly valued fish in the local markets and is also a sought-after game fish.
John’s snapper (Lutjanus johni) (Kan: Hottekemsa) inhabits shallow waters and mangrove areas. It shows a tendency to associate with corals in clear water. It attains a maximum length of 31cm (Wealth of India, IV, Suppl. 2003).
The brown-backed trevelly (Carangoides praeustus) (Kan: Haluguruku) has a compressed body, with a spinous dorsal fin. This species enters coastal waters from the sea (Talwar and Jhingran 1991). Present in all the three zones of Aghanashini estuary.
The longnose trevally (Carangoides chrysophrys) (Kan: Kokkara): Body greenish above, silvery with yellow-green reflections below. Adults up to 61 cm long inhabit coastal waters of at least 60 cm depth. Juveniles occur in inshore areas and estuaries. Marketed fresh or in dried and salted state (FAO 1984). Occurs in all the three zones of Aghanashini estuary throughout the year.
The banded needle fish (Strongylura leiura) (Kan: Burakandi) has a laterally compressed elongated body, almost rectangular in cross-section. Upper and lower jaws greatly elongated, studded with sharp teeth. The fish attains a length of 73 cm (Talwar and Jhingran 1991). It is an inshore and estuarine fish and was found more in Aghanashini Zone-II during the rainy season, maybe due to an abundance of food due to the good mangrove vegetation.
The fringescale sardinella (Sardinella fimbriata) (Kan: Pedi) has a somewhat compressed but variable-shaped body, from slender to moderately deep. This coastal species grows up to 10–15 cm. It is less valuable than the oil sardine as a source of fish oil. Catches usually obtained from September to January along the west coast (Wealth of India, IV, Suppl. 2003). It occurs in the estuary throughout the year.
The Malabar sole (Cynoglossus macrostomus) (Kan:Leppe) has a tongue-shaped boyd, mouth reaching well beyond the lower eye. Inhabits shallow and sandy bottoms.Occurs in all the three zones of the study area.
Anchovies are typically marine occurring towards the coast in schools. Some enter the brackish water or even fresh water to feed or breed. India has five genera of which four are associated with estuaries. They have fusiform, strongly compressed bodies. Snout projects beyond the lower jaw.
The Indian anchovy (Stolephorus indicus) (Kan: Belanji) is widespread along coastal waters and enters estuaries. Maximum length about 12 cm. It is light transparent fleshy brown, with silvery stripes down the flanks (Talwar and Jhingran 1991). It is not tolerant of low salinities and could be seen throughout the year in Zone-I of Aghanashini. The fish is in great demand for food, both fresh and dried. Commerson’s anchovy (Stolephorus commersonnii) (Kan: Danashi) is a slender-bodied and somewhat compressed fish with a slightly rounded belly.
The pugnose ponyfish (Secutor insidiator) (Kan: Guruku) inhabits shallow coastal waters and enters brackish waters. The body is oval and compressed, with a small mouth. It is silvery in colour, the upper half with pearly blue spots (Talwar and Jhingran 1991). It tolerates considerable variations in salinity and occurs throughout the estuary during all seasons.
Fish decline in rainy season
In the Kodungalloor–Azhikode estuary of the Vembanad backwater system, many of the marine fish species declined during the monsoon due to sudden changes in salinity, temperature and other physico-chemical and biological conditions. However, the monsoon witnessed improvements in the shrimp catch (Jayachandran et al. 2013). The monsoon season was dominated by catfishes, Etroplus suratensis, mullets and Chanos chanos, among the fin fishes. In Aghanashini estuary, the fishes under the marine–estuarine–freshwater category (Table 2.3) were notable among the monsoon catches.
Importance of estuaries for life cycle and juvenile feeding: Coastal and estuarine systems are complex adaptive systems of interconnected groups of organisms and their habitats (Levin and Lubchenco 2008). These are highly productive environments and essential fish habitats, noted for their role as breeding and nursery grounds for many marine species, especially those associated with the continental shelf. Most of the estuarine fishes are indeed not permanent residents there but seasonal migrants from marine areas, especially during their early stages of life. Apart from fishes, many other marine organisms, like several shrimp species, use estuaries as feeding grounds, more so during their early stages. At the same time, individuals or small numbers of many other marine species of fish, of stenohaline nature, may stray into the high-salinity regions, mainly for feeding rather than to use them as nurseries (Mann 1982; Miller et al. 1984; Beck et al. 2003; Potter et al. 1990). Of such species shifting opportunistically into the estuary from the marine areas during favourable salinity conditions may be noted the highly important commercial mackerel (Rastrelliger kanagurta), arrow-barred Spanish mackerel (Scomberomorus commerson) and silver pomfret (Pampus argenteus) (Bhat et al. 2014a). Studies conducted elsewhere also reveal that most of the fishes found in the Aghanashini estuary are known for spending their adult stage and spawning in the sea and juveniles entering the estuary, which plays the crucial role of nursery and feeding grounds. These, on attaining maturity or as sub-adults, return to the sea for laying eggs. Notable commercial fishes of this category are Terapon jarbua, Gerres filamentosus, Liza parsia, Lutjanus russelli, Lates calcarifer, etc (Krishnamurthy and Jayaseelan 1981; Blaber 1986; Robertson and Duke 1987; Krishnamurthy et al. 1978; Davis 1988; Blaber and Milton 1990; Miu et al. 1990; Thollot et al. 1990; Allen 1991). Few of the marine herrings, cods and whitings recorded from Aghanashini are reported elsewhere as utilizing estuarine habitats as nursery grounds (Wheeler 1978; Henderson and Holmes 1989; Rogers et al. 1998; Power et al. 2000). On the basis of a study conducted in Ashtamudi estuary, of southern Kerala, Nair et al. (1983) observed that none of the commercially important groups that contribute to the major catches from the estuary belong to the truly estuarine habitat and that the estuarine fishery is highly seasonal since it depends on recruitment from the sea. Of the 97 species of estuarine organism documented, nearly 50 per cent were typically marine, 11 typically freshwater and only three typically estuarine. Earlier, Jhingran and Gopalakrishnan (1973) found that the fauna of a brackish water system is composed of marine and freshwater organisms which can adapt to waters of different and varying salinities and truly resident estuarine species. Brinda et al. (2010) recorded the juveniles of 45 species of finfish in Vellar estuary, of Tamil Nadu.
Most of the fishes found in estuaries are euryhaline marine species which enter in large numbers at particular stages of their life cycles. Since this immigration applies to larvae and juveniles, estuaries are commonly known as nurseries for fishes (Potter et al. 1990). In the estuary of Aghanashini we found that about 13 species of fish were basically marine, entering the high-salinity river mouth during the rainless, hot months when salinity is high. These included a few of the high-value commercial fishes as well, like the mackerel (Rastrelliger kanagurta), silver pomfret (Pampus argenteus) and Spanish mackerel (Scomberomorus commerson). Anadromous fish species migrate from the sea through the estuary into the fresh water to spawn, whereas catadromous fishes move seawards from the fresh water en route to their marine breeding/feeding areas (Haedrich 1983). Tenualosa ilisha (river shad), the famed table fish, is an anadromous fish of Aghanashini, the adults of which are known to move from the foreshore and lower estuary into the upstream freshwater portions of the rivers for spawning (Mishra and Krishnan 1996; Panhwar et al. 2011). The catadromous, freshwater-to-brackish water-dwelling barramundi (Lates calcarifer) requires greater depths (10–15 m), hardly available in the estuary, and higher salinity conditions (30–32 ppt) for gonadial maturity, making it migrate from the river into the sea for spawning during the monsoon. The spawning happens in September, and the larvae move into the estuary for further development (Mathew 2009). The catadromous Lutjanus argentimaculatus also migrates from fresh water, through the estuary, into marine areas for spawning (Craig et al. 2016). Interestingly, out of the 77 species of fin fish recorded from Aghanashini, mainly the pearl spot (Etroplus suratensis) can be called truly estuarine (Table 5).
Table 5. Importance of Aghanashini estuary for the juveniles and subadults of notable fishes
|
Sno. |
Species |
Spawning/Juveniles |
Remarks |
References |
|---|---|---|---|---|
|
1 |
Ambassis commersonii |
Juveniles in Vellar estuary, Tamil Nadu |
Max. in monsoon |
Brinda et al. 2010 |
|
2 |
Caranx ignobilis |
Demersal fish; spawning in offshore seaweed reefs and banks; juveniles in sandy inshore bottoms and estuary |
Juveniles and subadults have wide tolerance of salinity |
Blaber and Cyrus 1983; Sudekum et al. 1991 |
|
3 |
Crossorhombus azureus |
Adults and larvae found in the sea, more towards the coastal zone |
|
Devi 2001 |
|
4 |
Terapon jarbua |
Spawn at sea; juveniles move into estuary |
-do- |
Jeyaseelan 1998 |
|
5 |
Mugil cephalus |
As above |
Tolerates fresh water to high salinity |
Brinda et al. 2010 |
|
6 |
Etroplus suratensis |
As above |
As above |
Brinda et al. 2010 |
|
7 |
Stolephorus indicus |
Coastal waters; enters estuaries; feeds on zooplankton; spawning in more saline waters |
As above |
Westenberg 1981 |
|
8 |
Secutor insidiator |
As above |
As above |
Brinda et al. 2010 |
|
9 |
Secutor ruconius |
Spawns at sea; juveniles in estuary |
As above |
http://eprints.cmfri.org.in/1308 |
|
10 |
Liza parsia |
Spawns at sea |
|
|
|
11 |
Glossogobius sp. |
Juveniles in Vellar estuary, Tamil Nadu |
Post-monsoon |
Brinda et al. 2010 |
|
12 |
Pomadasys maculates |
As above |
As above |
-do- |
|
13 |
Hemiramphus far |
Juveniles in Vellar estuary, Tamil Nadu |
Maximum in the monsoon |
-do- |
|
14 |
Scatophagus argus |
Spawning along the coastal sea at Mandapam |
Monsoon |
Gandhi et al. 2014 |
|
15 |
Lates calcarifer |
Spawns pelagic eggs; spawning near lower estuary or in coastal waters close to the estuary in salinity levels of 28–36 ppt; post-larvae move into marshes and mangrove swamps. Fry occur in salinity levels of 1–20. |
|
Jeyaseelan 1998; BdFish Feature 2011 |
|
16 |
Lutjanus argentimaculatus |
Subadults from estuaries/from fresh water migrate to sea for spawning. |
|
Russell & McDougall 2008 |
|
17 |
Lutjanus johnii |
Marine to estuarine; use mangroves as nursery grounds |
|
Jeyaseelan 1998 |
|
18 |
Sillago sihama |
Shallow–bottom, sandy coastal zone and estuaries; eggs reported from some estuaries; brackish waters |
|
Jeyaseelan 1998; Smith-Vaniz and Spark 2008 |
|
19 |
Strongylura leiura |
Larvae and early juveniles found in mangroves |
|
|
|
20 |
Terapon jarbua |
Spawning in the sea; juveniles entering the estuary |
|
Allen 1991 |
|
21 |
Thryssa mystax |
Pelagic eggs; post-larvae and early juveniles enter mangroves and coastal waters. |
|
Jeyaseelan 1998 |
Estuary: A complex of habitats and micro-habitats for fishes
A major finding that emerges from the study is that the estuary of Aghanashini, in itself, is a complex and dynamic world of habitats and micro-habitats for fish species of diverse orders and families, which to meet their varied requirements, have adjusted their phases of life. Most of them are temporary visitors, whereas others are capable of spending their entire lifespan in the estuary, despite the choice of shifting into the vast ocean nearby. A few others have the choice of swimming into the fresh water running down the slopes of the Western Ghats. For several fish species, the mangroves provide shelter and food, for the juveniles or the adults or both. Apogon hyalosoma, Atule mate, Cyanoglossus punticeps, Drepane punctata, Eleutheronema sp., Lutjanus spp. (snappers), Scatophagus sp., Tylosurus spp., etc. are known to be mangrove dependent on the basis of various studies. Many benthic fishes bury themselves in the bottom mud or sand and hunt for their food or feed on detritus. These include Austrobatrachus, Caranx ignobilis, Cyanoglossus, Grammoplites, Himantura bleekeri, Lactarius lactarius, Pampus argenteus and Sillago sihama. Others like Etroplus suratensis, Sillago sihama and Stolephorus indicus are more associated with free-moving waters, feeding more on planktonic material (Table 6).
The food production in the estuary, catering to the consumers of diverse trophic levels, is based on the diversity of habitats and micro-habitats. Phytoplankton, zooplankton, macroalgae, micro to macro-invertebrates (including crustaceans and molluscs), mangrove materials, detritus from various sources, small fishes, etc. are the major food sources of the estuary. Naturally these food sources are derived from various habitats and micro-habitats like mangroves, marshes, reeds and other vegetation, estuarine rice fields (gaznis), mudflats, detritus, sandflats, photosynthetic organisms and the zooplankton of the water column itself. Organic detritus is abundant in the estuary. The Aghanashini mangrove areas and the marshy gazni rice fields are rich in deposits with large quantities of organic soil carbon and are major centres of estuarine organisms (Table 2.6).
Table 6: Habitat preferences of notable fishes of Aghanashini estuary
|
Species |
Common Name |
Habitats/Micro-habitats and Feeding |
References |
|
Ambassis ambassis |
Commerson’s glassy perchlet; burante (Kan) |
Estuarine environments—may enter freshwater system. Feeds on benthos, crustaceans, fishes |
Talwar and Jhingran 1991; Fishbase.org |
|
Apogon hyalosoma |
Mangrove cardinalfish burante (Kan) |
Estuarine and brackish water; freshwater reaches; adults in mangroves; euryhaline. Feeds on benthos, crabs, prawns. |
Allen et al. 2002 |
|
Arius arius |
Threadfin sea catfish; sady (Kan) |
Seas, estuaries, tidal rivers and brackish water. Feeds on invertebrates. |
Pal 2012 |
|
Arius caelatus |
Catfish |
Marine and brackish; typically carnivorous. |
|
|
Austrobatrachus. Dussumeri |
Flat toadfish |
Marine and brackish; prefers muddy bottom. Occasionally enters rivers. Buried in sand or mud or debris, etc. Ambushes crabs, fishes, shrimps, mollusks, etc. |
Sebastian 2011 |
|
Atule mate |
Yellowtail scad |
Inshore; adults in mangroves and coastal bays; feeds on fishes, crustaceans and cephalopods. |
Teugels 1986; http://www.fishbase/summary.Atule-mate |
|
Carangoides praeustus |
Brownback trevally |
Marine; juveniles reported as entering the mangrove waters during July–August. |
Jeyaseelan 1998 |
|
Caranx ignobilis |
Giant trevally |
Demersal marine; sandflats inshore. Feeds on demersal and pelagic fishes; also cephalopods and crustaceans |
Blaber and Cyrus 1983 |
|
Cyanoglossus punticeps |
Seckled tonguesole |
Bottom dwelling, uses mangroves as nurseries; feeds on benthic and demersal organisms in coastal waters. Juveniles in mangroves feed on various organisms and detritus; juveniles prefer muddy bottom |
|
|
Drepane punctata |
Dotted sickle fish |
Coastal and estuarine; juveniles use mangroves as nursery grounds |
Jeyaseelan 2008 |
|
Eleutheronema tetradactylum |
Four-finger threadfin |
Prefers prey (shrimp) mainly from rich, shallow, muddy coast; juveniles use mangroves as nursery grounds. Tolerates wide range of salinity levels. |
Jeyaseelan 2008 |
|
Etroplus suratensis |
Pearl spot |
Brackish to fresh water; can withstand salinity up to 40 ppt; feeds on algae, diatoms, diatoms and polychaetes, young fish, seagrasses, etc.; fry feed on larvae of aquatic insects. Breeds in brackish and fresh water year–round. |
Jeyaseelan 2008 |
|
Grammoplites scaber |
Rough flathead |
Marine, burrowing in sand and mud; juveniles enter brackish water, feed on prawns. |
Kuronuma and Abe 1986; Kuthalingam1970 |
|
Himantura bleekeri |
Bleeker’s whip ray |
Inshore soft bottom dwelling; enters estuaries; feeds on invertebrates |
http://www.fishbase.se/summary/Himantura-bleekeri |
|
Lactarius lactarius |
False trevally |
Marine and brackish; feeds on sand-dwelling animals |
http://www.fishbase.org/summary/Lactarius-lactarius.htm |
|
Lates calcarifer |
Barramundi, seabass |
Young fish move upstream in river; adults move downstream for spawning. Predator—feeds on small fishes, crustaceans and molluscs |
Jeyaseelan 1998 |
|
Lutjanus argentimaculatus |
|
Marine and estuarine; widely occurring in mangroves |
Jeyaseelan 1998 |
|
Lutjanus johni |
John’s snapper |
Marine and estuarine; carnivorous, feeding on fishes and crustaceans. Uses mangroves as nursery grounds |
Jeyaseelan 1998 |
|
Lutjanus russelli |
Russell’s snapper |
Marine and estuarine; reported from mangroves |
|
|
Megalapsis cordyla |
Torpedo scad |
Inshore–pelagic; diet consists of fishes, squids, crustaceans, molluscs, etc. |
Das et al. 2014 |
|
Mugil cephalus |
Flathead mullet |
Marine and brackish; breeds in marine environment. Can enter fresh water as well as tolerate very high salinity. Feeds on detritus, algae, diatoms and silt; also egg masses and invertebrates. |
|
|
Pampus argenteus |
Silver pomfret |
Though marine, young ones known to ascend estuaries. Feeds on muddy bottom-dwelling invertebrates. |
Naser 2011 |
|
Scatophagus argus |
Spotted scat |
Coastal waters to upstream in estuaries; in mangroves. |
|
|
Secutor insidiator |
Pugnose ponyfish |
Shallow coastal waters; enters brackish waters; feeds on zooplankton, mysids, fish larvae and crustaceans. |
http://fishbase.sinica.edu.tw |
|
Sillago sihama |
Silver sillago |
Shallow bottom of sandy coastal zone; estuaries. Goes upstream into freshwater rivers. Primarily feeds on blue-green algae, dinoflagellates, small crustaceans, polychetes and larvae. Adults feed also on shrimps, crabs and even seaweeds. |
Jeyaseelan 1998; Smith-Vaniz and Spark 2008 |
|
Stolephorus commersonnii |
Commerson’s anchovy |
Enters estuary from coastal waters; feeds on surface plankton, primarily copepods and prawn larvae. |
|
|
Stolephorus indicus |
Indian anchovy; Kan: Belanji |
Exclusively marine, enters parts of the estuary when the salinity is high. |
Nair et al. 1983; Bhat et al. 2014a |
|
Strongylura leiura |
Banded needlefish |
Coastal waters and estuaries; feeds mainly on small fishes and crustaceans. |
|
|
Thryssa mystax |
Moustached thryssa |
Juveniles reach mangroves; feed on mysids, sergestids, early stages of shrimps and fish larvae |
Jeyaseelan 1998 |
|
Terapon jarbua |
Tiger perch |
Feeds on various organisms, larval stages, etc. |
Jeyaseelan 1998 |
|
Tylosurus strongylurus |
Round-tail needlefish |
Marine and brackish; occurs in mangrove creeks. |
|
Conclusion
Estuaries are very dynamic, species-rich and productive ecosystems. Our study in Aghanashini goes to prove that the estuary safeguards the diversity of fishes not all for itself, but more so for the ocean and to some extent for the fresh water upstream. The estuary functions largely as a nursery for fishes of the marine sphere, by nurturing and sheltering their larvae and juveniles, in a diversity of habitats and micro-habitats like mangroves, mudflats, marshes and sandy and muddy bottoms, in its clear as well as turbid water columns, in portions with the lowest salinity at the interface with the fresh water from the river and in the portions with the highest salinity, towards the seafront, where the river loses its identity into the ocean. There is seasonality and zonation of the 77+ species of fin fishes identified from the estuary. During the rainy season, when the salinity dips to the lowest level, fresh water-dwelling and euryhaline fishes alone are all pervasive in the estuary. The post-monsoon witnesses an alignment happening in the fish fauna, with the lowest salinity-tolerant ones shifting upstream towards the river, the highest salinity-requiring ones confined to the extreme seafront portion of the estuary, where the stenohaline marine fishes also find a congenial environment to foray into the estuary, mainly for feeding purposes. The mid-estuary is where most of the euryhaline species congregate, using one or more habitats suitable for them. The dynamism in the fish diversity and distribution within the estuary and beyond into the marine regime, as well as upstream in the river, incorporating temporal and spatial changes with diffuse boundaries, is to be understood well before formulating comprehensive coastal zone management plans with sustainable fishery management in estuarine and marine areas as the central theme.
PHYTOPLANKTON, ZOOPLANKTON AND ESTUARINE FAUNA
The phytoplankton constitutes the basic source of food in the sea and is the starting point of the food chain. It is consumed by zooplankton with limited swimming ability. The phytoplankton is also consumed by larger animals like fishes, molluscs and crustaceans. Ocean currents circulate the plankton vertically and horizontally. The plankton which sinks below the euphotic zone settles at the bottom as detritus, the main feeding material for a number of benthic organisms. By virtue of its abundance and the intermediary role it plays between phytoplankton and fishes, the zooplankton is considered the chief index of aquatic life at the secondary trophic level. The zooplankton grazes on the phytoplankton, transforming plant material into animal biomass. Crustaceans are the predominant grazing animals of the sea. The high-sea zooplankton, which is stenohaline, requires a salinity of 34–36 ppt and perishes if it is carried into estuaries by strong winds. Euryhaline animals, which have a greater degree of tolerance towards fluctuations in salinity, are inhabitants of coastal regions and estuaries. The estuarine zooplankton has a marine component confined to the estuarine mouth, with its higher salinity. In the estuary proper are more euryhaline forms that are used to high fluctuations in salinity. A third component is the fresh water zooplankton, which may be found towards the upper reaches of the estuary. The zooplankton flourishes in the estuary during the high-salinity pre-monsoon months. When the rains inundate estuaries, the zooplankton fauna is impoverished. The higher trophic level animals are least abundant during the monsoon months. When the salinity increases in the post-monsoon period, the larvae of commercially important crustaceans and fishes also migrate into the estuary (Quasim 2003).
REFERENCES
- Allen, G.R. 1991. Field Guide to the Freshwater Fishes of New Guinea. Publication No. 9. 268 pp. Christensen Research Institute, Madang, Papua New Guinea.
- Allen, G.R., Midgley, S.H. and Allen, M. 2002. Field Guide to the Freshwater Fishes of Australia. Western Australian Museum, Perth.
- BdFish Feature. 2011. Lates calcarifer (Bloch, 1790). Galib, S.M. (ed.). http://en.bdfish.org/2011/04/barramundi-lates-calcarifer-bloch-1790
- Beck, M.W., Heck, K.L.J., Able, K.W., Childers, D.L., Eggleston, D.B., Gillanders, B.M., Halpern, B.S., Hays, C.G., Hoshino, K., Minello, T.J., Orth, R.J., Sheridan, P.F. and Weinstein, M.P. 2003. The role of near shore ecosystems as fish and shellfish nurseries. Issues in Ecology 11: 1–12.
- Bhat, M., Nayak,V.N., Chandran, M.D.S. and Ramachandra, T.V. 2014a. Fish distribution dynamics in the Aghanashini estuary of Uttara Kannada, west coast of India. Current Science 106(12): 1739–1744.
- Bhat, M., Nayak, V.N., Chandran, M.D.S. and Ramachandra, T.V. 2014b. Impact of hydroelectric projects on the finfish diversity in the Sharavathi estuary of Uttara Kannada district, central west coast of India. International Journal of Environmental Sciences, 5(1): 58–66.
- Blaber, S.J.M. 1986. Feeding selectivity of a guild of piscivorous fish in mangrove areas of northwest Australia. Australian Journal of marine and Freshwater Research 37: 329–336.
- Blaber, S.J.M. 1997. Fish and Fisheries in Tropical Estuaries. Chapman & Hall, London.
- Blaber, S.J.M. 2000. Tropical Estuarine Fishes: Ecology, Exploitation and Conservation. Blackwell Science Ltd., Oxford.
- Blaber, S.J.M. and Cyrus, D.P. 1983. The biology of Carangidae (Teleostei) in Natal estuaries. Journal of Fish Biology 22: 173–188.
- Blaber, S.J.M. and Milton, D.A. 1990. Species composition, community structure and zoogeography of fishes of mangrove estuaries inSolomon Islands. Marine Biology 105: 259–267.
- Brinda, S., Srinivasan, M. and Balakrishnan, S. 2010. Studies on diversity of fin fish larvae in Vellar estuary, southeast coast of India. World Journal of Fish & Marine Sciences. 2(1): 44–50.
- Chandran, M.D.S., Ramachandra, T.V., Joshi, N.V., Mesta, N.M., Settur, B. and Vishnu, D.M. 2012. Conservation and Management of Mangroves in Uttara Kannada, Central West Coast. ENVIS Tech. Report 50. Centre for Ecological Sciences, Indian Institute of Science, Bangalore.
- Craig, J.F. (ed.). 2016. Fresh Water Fisheries Ecology. Wiley Blackwell, Oxford.
- Davis, T.L.O 1988. Temporal changes in the fish fauna entering a tidal swamp system in tropical Australia. Environmental Biology of Fishes 21(3): 161–172.
- Day, F. 1889. The Fauna of British India Including Ceylon and Burma Vol. I & II. Reprint 1989.
- Devi, C.B.L. 2001. Bothid larvae (Pleuronectiformes- Pisces) of the Gulf of Thailand and South China Sea. Journal of the Indian Fisheries Association 28: 53–71.
- http://www.fishbase.org/Ecology: Ecology of Atule mate
- FAO. 1984. FAO species identification sheets for fishery purposes. Volume I. Fischer, W. and Bianchi, G.(eds.). FAO Fisheries Department Rome, Italy.
- Gandhi, V. 2002. Studies on the food and feeding habits of cultivable butterfish Scatophagus argus (Cuv. and Val.). J. Mar. Biol. Ass. India 44(1&2): 115–121.
- Gandhi, V., Venkatesan, V. and Ramamoorthy, N. 2014. Reproductive biology of the spotted scat Scatophagus argus (Linnaeus, 1766) from Mandapam waters, south-east coast of India. Indian Journal of Fisheries. 61(4): 55–59.
- Golikatte, R.G. and Bhat, U.G. 2011. Food and feeding habits of the whipfin silver biddy Gerres filamentosus from Sharavati estuary, central west coast of India. World Journal of Science and Technology 1(2): 29-33.
- Gundermann, N., Popper, D.M. and Lichatowich, T. 1983. Biology and life cycle of Siganus vermiculatus (Siganidae, Pisces). Pacific Science 37(2): 165–180.
- Haedrich, R.L. 1983. Estuarine fishes. In Ketchum, B.H. (ed.). Ecosystems of the World. Elsevier, Amsterdam. Pp. 183–207.
- http://www.iucnredlist.org. Sillago sihama
- Henderson, P.A. 1989. On the structure of the inshore fish community of England and Wales. Journal of the Marine Biological Association of the U.K. 69: 145–163.
- Henderson, P.A. and Holmes, R.H.A. 1989. Whiting migration in the Bristol Channel: A predator-prey relationship. Journal of Fisheries Biology 34: 409–416.
- Hsu, C.C., Han, Y.S. and Tzeng, W.N. 2007. Evidence of flathead mullet Mugil cephalus L. spawning in waters northeast of Taiwan. Zoological Studies 46(6): 717–725.
- James, P.S.B. R. and Marichamy, R. 1986. Status of sea bass (Lates calcarifer) culture in India. In Proceedings of an International Workshop on Management of Wild and Cultured Sea Bass. pp. 74-79.
- Jayachandran, P.R., Nandan, S.B., Sridevi, O.K and Sanu, V.F. 2013. Influences of environmental factors on fish assemblage in the tropical estuary of south west coast of India: A case study of Kodungallur-Azhikode estuary. International Journal of Marine Science 3(2).
- Jeyaseelan, M.J.P. 1998. Manual of Fish Eggs and Larvae from Asian Mangrove Waters. United Nations Educational, Scientific and Cultural Organization, Paris.
- Jhingran, V.G. and Gopalakrishnan, V. 1973. Journal of the Marine Biological Association of India. 15: 323.
- Kannappan, T. and Karthikeyan, M.M. 2013. Diversity of fishes in relation to physico-chemical properties of Manakudy estuary, southwest coast of India. International Journal of Biodiversity and Conservation 5(7): 396–407.
- Krishnamurthy, K. and Jeyaseelan, M.J.P. 1981. The early life history of fishes from Pichavaram mangrove ecosystem of India. Rapp. P.-v. Réun. Cons. int. Explor. Mer 178: 416–423.
- Kuronuma, K. and Abe, Y. 1986. Fishes of the Arabian Gulf. Kuwait Institute for Scientific Research, State of Kuwait.
- Kuthalingam, M.D.K. 1970. Observations on the fishery and biology of Grammoplites scaber (Linnaeus). Indian J. Fish. 17(1&2): 97–104.
- Levin, S.A., and Lubchenco, J. 2008. Resilience, robustness, and marine ecosystem based management. BioScience 58: 27–32.
- Maes, J., Taillieu, A., Van Damme, P.A., Cottenie, K. and Ollevier, F. 1998. Seasonal patterns in the fish and crustacean community of a turbid temperate estuary (Zeeschelde Estuary, Belgium). Estuarine, Coastal and Shelf Science 47: 143–151.
- Mann, K.H. 1982. Ecology of Coastal Waters: A Systems Approach. Studies in Ecology, Vol. 8, University of California Press, Los Angeles, CA.
- Mathew, G. 2009. Taxonomy, identification and biology of seabass (Lates calcarifer). In National Training on Cage Culture of Seabass, CMFRI, Kochi. Pp. 38–43.
- Miller, J.M., Reed, J.P. and Pietrafesa, L.J., 1984. Patterns, mechanisms and approaches to the study of migrations of estuarine-dependent fish larvae and juveniles. In: McCleave, J.D. (ed.), Mechanisms of Migration in Fishes. Plenum Press, New York. Pp. 209–225.
- Mishra, S.S. and Krishnan, S. 1996. Observations on the ichtifyofaunal constituents restricted to the Indian subcontinental coastal waters. Rec. Zoological Survey of India 95 (3–4): 261–276.
- Miu, T.C., Lee, S.C. and Tzeng, W.N. 1990. Reproductive biology of Terapon jarbua from the estuary of Tamshui river. J. Fish. Soc. Taiwan 17(1): 9–20.
- Mohanraj, G., Batch, H. and Gomathy. 2003. Sciaenids. In Mohan Joseph, M. and Jayaprakash, A.A. (eds.), Status of Exploited Marine Fishery Resources of India. Central Marine Fisheries Research Institute, Cochin. Pp. 133–140.
- Munro, I.S.R. 2000. The Marine and Fresh Water Fishes of Ceylon. Vedams Books, India.
- Nair, N.B., Kumar, K.K., Nair, J.R., Aziz, P.K.A., Dharmaraj, K. and Arunachalam, M. 1983. Ecology of Indian estuaries. XI. A preliminary survey of the fishery resources of the Ashtamudi estuarine system. Fishery Technology 20: 75–83.
- Naser, S.M.A. 2011. Silver pomfret, Pampus argenteus (Euphrasen, 1788). BdFish Feature, http://en.bdfish.org/2011/08/silver-pomfret-pampus-argenteus
- Pal, M. 2012. Arius arius. The IUCN Red List of Threatened Species 2012. Downloaded on 16 April 2017.
- Panhwar, H.K., Siddiqui, G. and Ayub, Z. 2011. Reproductive pattern and some biological features of anadromous fish Tenualosa ilisha (family: Clupeidae) from Pakistan. Indian Journal of Geo-Marine Science 40(5): 687–696.
- Potter, I.C., Beckley, L.E., Whitfield, A.K. and Lenanton, R.C.J. 1990. Comparisons between the roles played by estuaries in the life cycles of fishes in temperate Western Australia and southern Africa. Environmental Biology of Fishes 28: 143–178.
- Power, M., Attrill, M.J. and Thomas, R.M. 2000. Temporal abundance patterns and growth of juvenile herring and sprat from the Thames estuary 1977–1992. Journal of Fish Biology 56: 1408–1426.
- Rao, L.M. and Rao, P.S. 2002. Food and feeding habits of Glossogobius giuris from Gosthani estuary. Indian J. Fish. 49(1): 35–40
- Robertson, A.I. and Duke, N.C. 1987. Mangroves as nursery sites: Comparisons of the abundance and species composition of fish and crustaceans in mangroves and other nearshore habitats in tropical Australia. Marine Biology 96: 193–205.
- Rogers, S.I., Millner, R.S. and Mead, T.A. 1998. The distribution and abundance of young fish on the east and south coast of England (1981 to 1997). Science Series, Technical Report, CEFAS, Lowestoft, 108, 130 pp.
- Russell, D.J. and McDougall, A.J. 2008. Reproductive biology of mangrove jack (Lutjanus argentimaculatus) in northeastern Queensland, Australia. New Zealand Journal of Marine and Freshwater Research 42(2): 219–232.
- Sebastian, R. 2011. Biology of flat toadfish Collettichthys dussumieri (Valenciannes, 1837), of Cochin estuary. Ph.D. thesis, Cochin University of Science and Technology, Kochi.
- Shamsan, E.F. 2008. Ecobiology and fisheries of an economically important estuarine fish Sillago sihama, Ph.D. thesis, Goa University.
- Smith-Vaniz, W.F. and Sparks, J.S. 2008. Sillago sihama, silver sillago. IUCN Red List of Threatened Species, IUCN.
- Sommer, C., Schneider, W. and Poutiers, J.M. 1996. The Living Marine Resources of Somalia. Rome: Food and Agriculture Organization of the United Nations. 376pp.
- Sudekum, A.E., Parrish, J.D. Radtke, R.L. and Ralston, S. 1991. Life history and ecology of large jacks in undisturbed, shallow, oceanic communities. Fisheries Bulletin 89: 493–513.
- Talwar, P.K. and Jhingran, A.G. 1991. Inland Fishes of India and Adjacent Countries. Vols. 1 and 2. Oxford and IBH Publishing Co. Pvt. Ltd., New Delhi.
- Thollot P., Kulbicki, M. and Wntiez, L. 1990. Temporal pattern of fish populations in three habitats of the three habitats of the St.Vincent Bay area (New Caledonia): Coral reefs, soft bottoms and mangroves. Proceedings ISRS Congress, Noumea. Pp. 127–136.
- Teugels, G.G. 1986. A systematic revision of the African species of the genus Clarias (Pisces; Clariidae). Annales du Musée Royal de l'Afrique Centrale. Série in Octavo, Science Zoologique. 247:199 pages.
- Wealth of India, IV, Suppl., 2003. Centre for Scientific and Industrial Research, New Delhi.
- Westenberg, J., 1981. Fishery products of Indochina. A compilation of literature up to the Japanese invasion. Proc. Indo-Pacific Fish. Cum. 2nd Meet., 23: 125–150.
- Wheeler, A. 1978. Key to the Fishes of Northern Europe. Frederick Warne. 380 pp. http://www.fishbase.org
- Wongchinawit, S. and Paphavasit, N. 2009. Ontogenetic niche shift in the spotted scat, Scatophagus argus in Pak Phanang Estuary, Nakhon Si Thammarat Province, Thailand. The Natural History Journal of Chulalongkorn University 9(2): 143-169.
|
Specific criteria based on other taxa |
|
|
Criteria 9 |
A wetland should support 1% of the individuals in population of one species or subspecies of wetland-dependent non-avian animal species. |
The proposal made here is for Aghanashini Estuary Ramsar Site in Uttara Kannada district of Karnataka. The estuary itself is unique in biodiversity and productivity, core areas are identified for tremendous importance in Molluscan (bivalves) productivity and the importance for the mangrove ecosystem, which is the core area for biodiversity and productivity.
Aghanashini Estuary: Bivalve Mudflats, Situated in Kumta taluk of Uttara Kannada district. Lat. 14.520833-14.539342 N & &4.353754-74.369593 E: About 229 ha
Highly productive estuary: Aghanashini River in central Uttara Kannada district of Karnataka originates in the Western Ghats and flows westward towards the Arabian Sea, major part of its course through forested gorges and valleys. Having no dams and no notable industrial establishments or major townships along its banks the river may be considered one of the most pristine ones along the west coast. The River meets the sea in the Aghanashini village of Kumta taluk. The tidal portion, or estuary, towards the river mouth is a flat expanse of water dotted with small islands and narrow creeks. This portion, designated as the Aghanashini estuary, is a highly productive and biologically rich waterscape of coastal Karnataka. The high productivity of the estuary is due to the following reasons:
- The river water carries large quantity of organic materials from the forests in the catchment area of the Western Ghats and deposits the same in the estuary. The debris becomes important base for food chains operating in the estuary
- The rich mangrove vegetation of the estuary plays significant role in nutrient supply for the diverse faunal community and provide shelter for birds and act as nurseries for many species of fishes and prawns
- The rich bird community (over 120 species)associated with the estuary contributes to the nutrient cycling through their potash and nitrogen rich castings
- The constant churning and circulation of waters due to flow of fresh water from one side and the tidal influx from the Arabian Sea oxygenates the water and circulates the nutrients
Significance of bivalve (shellfish) production: Estuaries are ranked among the highest productive ecosystems of the earth. One of the most notable economic and subsistence output of the Aghanashini estuary is the bivalves (Phylum: Mollusca). The meat of these invertebrates is used as a protein rich food by thousands people along the coastal areas of Karnataka and Goa. Estimated at 22,006 tons, valued at Rs.57.8 million per annum. Most of the of bivalves harvested belong to Paphia malabarica, although six other edible species are also gathered in lesser quantities. Bulk of the bivalve harvest is from mudflats bordering the village by name Aghanashini, close to the mouth of the river (bearing the same name). Collectively these bivalve harvesting areas measure about 229 ha. (Boominathan et al., 2008). It is significant to note that so much of food production is without any investment or supply of feeds by humans. Constanza et al. (1997) estimated the value of an estuary as Rs.11,41,600/ha/year. This value is the aggregate of all goods and services such as shrimps, fish, crabs, salt, mangroves, in addition to services such as fish spawning grounds, nutrient cycling, hydrology, flood control, soil protection, sink for carbon etc.
Crucial role in local economy: Bivalve harvesting is the most important aspect of small scale informal fisheries of Kumta coast, an activity traditionally carried out by even persons from non-fishing communities, for family food security and for sale. Bivalve collection provided direct employment for 2,347 people according to the study referred to Boominathan et al., (2008). Of the harvesters 1,738 collectors were men and 609 were women. The collectors belonged to 19 estuarine villages and congregate in mudflats closer to Aghanashini village during the low tide time for harvesting. The bivalve-linked activities also include minor processing at the site, transportation, collection and sale of empty shells and drying of bivalve meat in small quantities for storage and future use. The calcium rich bivalve shells are used for lime making. The bivalve shell lime is of superior quality for white washing, as fertilizer, prawn feed, poultry feed, production of high grade cement etc.
Bivalves from the Aghanashini estuary provide excellent protein and mineral rich food for an estimated 198,000 people, especially along the coast. The Indian edible bivalves have protein (5-14%), fats (0.5-3%), calcium (0.04-1.84%), phosphorus (0.1-0.2%) and iron (1-29 mg/100 g of fresh weight) – CSIR (1962).
The abundant annual production of edible bivalves reflects the rich biodiversity of the estuary in general, which also has around 150 species of fishes, 120 species of birds, 13 species of mangroves, numerous mangrove associates and many more species of lower plants. Organic debris from the bio-diverse community of the estuary itself as well as that brought into the estuary from the Western Ghat forests collectively contributes towards the high production of bivalves. The bivalve rich area mentioned is the culmination of numerous food chains in the estuary and beyond from the Western Ghats from where nutrients reach the estuary through the river
- The local population has strong cultural bonds with the river, which they treat as Goddess. A long history of human association with the river can be traced, as integral part of people’s culture and livelihood activities such as fishing, fish and prawn culturing, mangrove planting and utilization, transportation, estuarine rice farming, salt making etc.
- The edible bivalve rich mudflats of Aghanashini may be considered as unique, ecologically fragile areas, as their productivity is due to their location towards the river mouth, at appropriate flooding depth during high tides, suitable salinity ranges, and accumulation of a huge quantity organic debris.
- Several aquatic and terrestrial bird species, including migrant species use the bivalves and other organisms of nutrient rich bivalve beds as their food.
- No village community has exclusive jurisdiction over the proposed area, although bivalve gatherers assemble here from 19 estuarine villages.
- Bivalve gathering, just like fisheries, has been a subsistence and economic activity from pre-historical times. Unlike fisheries the bivalve gathering is not an activity that needs high skills. It belongs to the sector of ‘informal fisheries’. The bivalve production area and activity of gathering and utilization may be considered a common heritage of the people of Aghanashini estuary.
- As such the bivalve collection activity is not regulated by any norms made by local communities. It is an unregulated, open to all economic activity engaged in by people, irrespective of caste and community. The activity was carried out traditionally on sustainable basis, more to cater local needs. Over the last few years large scale transportation of bivalves especially to Goa market has resulted in local famine and raises question of sustainability of the resource.
- As the bivalve harvesting areas are totally unprotected by any laws from any destructive type development activity or any other kind of disturbances that might happen in the future, in the very site or in any adjoining areas, that could adversely affect the food web of the estuary, it has become necessary to bring such critical areas under Ramsar Conservation site.
Threat if any (give details): For generations together the edible bivalve production areas adjoining Aghanashini village were used sustainably by the village communities as production has been abundant and the demand was mainly local. However in the recent years the demand has shot up from outside markets, especially from Goa, causing unprecedented over-harvesting. This situation could spell doom to the sustainability of the resource within few years. Further, the estuary is likely to be affected by various developmental interventions in the absence of any biodiversity centred, state sponsored governance.
Need for conservation was not felt until recent years, when demand for bivalves as food was more local than from outside. As resource was abundant and extraction pressures limited to sustainable limits there was no need to adopt any special measures of conservation. But such need has arisen now due to over-exploitation for catering to outside markets.
Mangrove Biodiversity: Situated in Kumta taluk of Uttara Kannada district. Lat. 14.52083-14.53934 N to 74.35375-74.36959 E, area about 67 ha
Aghanashini River in central Uttara Kannada district of Karnataka originates in the Western Ghats and flows westward towards the Arabian Sea, major part of its course through forested gorges and valleys. Having no dams and no notable industrial establishments or major townships along its banks the river may be considered one of the most pristine along the west coast. The River joins the sea in the Aghanashini village of Kumta taluk. The tidal portion, or estuary, towards the river mouth is a flat expanse of water dotted with small islands and narrow creeks.
Through millennia the estuary and its environs formed the lifeline of the people and constitute a major cultural and historical heritage of the west coast. It was known as a rice bowl in the historical times and rice surplus was transported through water crafts to other regions. The Mirjan fort on the bank of the estuary built by Bijapur Sultans and the ruins of Aghanashini fort on a hill towards the river mouth giving a commanding view of the sea, the estuary and the Western Ghats are testimonials for the historical and cultural importance of the region. Spices grown in the hinterlands of Western Ghats were traded through the estuary during the European period and earlier to it. Gokarna on its shores has been, from time immemorial, a great place of pilgrimage. Before the road networks came the estuary was a major route for transportation of pilgrims. The beaches dotting the coastline of Gokarna are today well known places of tourism. The picturesque estuary with flourishing mangrove vegetation, its rich birdlife, and traditional way of life of the people need to be protected as a cultural heritage and draw for tourism.
The estuary is a highly productive and biologically rich waterscape of coastal Karnataka. Whereas hundreds of families in the shore villages have direct dependence on it for their livelihoods through activities related to fishing, agriculture, collection of edible bivalves and crabs, shrimp aquaculture, traditional fish farming in the gazni rice fields, bivalve shell mining, salt production, sand removal, water transportation etc. scores of consumers in the estuarine villages and in places far away are benefited by the productivity of the estuary, of which the mangroves constitute the heart. The high productivity of the estuary is due to the following reasons:
The river water carries large quantity of organic materials from the forests in the catchment area of the Western Ghats and deposits the same in the estuary. The debris becomes important base for food chains operating in the estuary and beyond in the offshore waters of the sea
The rich mangrove vegetation has significant role in food supply for the diverse faunal community. The mangrove swamp acts as food rich and protective nurseries even for many species of marine fishes and prawns, which lay eggs in the swamp. The rich bird community (over 120 species, about half of them winter visitors) associated with the estuarine ecosystem contributes substantially to the nutrient cycling through their potash and nitrogen rich castings
The constant churning and circulation of waters due to flow of fresh water from one side and the tidal influx from the Arabian Sea oxygenates the water and circulates nutrients. Mangroves are in the heart of estuarine ecosystem and productivity. Their influence is pronounced not only in the estuaries but also extends far into the offshore areas. Tropical estuaries are ranked among the top productive ecosystems of the world, at par with the coral reefs. The major reason for their productivity is attributed to the mangrove vegetation. There are also other reasons for ranking mangroves high in the conservation circles.
Mangroves contribute nutrients to the estuarine-marine ecosystem through litter-fall that turn into nutrients eventually. These nutrients contribute significantly towards food web and productivity of the estuary and the coastal sea. The detritus and filter feeding organisms like bivalves contribute substantially to the income and food of the local people. People engaged in bivalve trade and consumers far away are also benefited. The bivalve shell gathering is a major, estuary based enterprise providing direct employment for about 600 persons and many more in associated trade and production of goods using shells such as poultry feed, cement, shell lime, paint, fertilizers etc. The annual output of shells from Aghanashini estuary is estimated to be around 100,000 tons worth Rs.5-6 crores. Fishermen report of good catch of fish closer to mangrove patches than elsewhere.
Mangroves act as nursery for fishes and prawns. Many sea fish visit nutrient rich mangrove area for laying eggs so that the juveniles grow amidst abundance of food before they leave for the sea. Resident estuarine fishes also take benefit of the mangrove areas for their food and breeding. The mangroves with their entanglement of roots making a dense impenetrable cover provide a safe place for fishes and prawns securing them from predators. The fishermen also do not cast their nets within the mangrove areas due to the physical obstacles created by the root network.
Mangroves of Aghanashini provide good roosting place for many species of birds,which find rich food supply in the estuary apart from shelter provided by the mangroves. More than 120 species of birds, half of them migrants, have been recorded. Mangroves protect the islands and mainland from erosion and trap soil and debris that come along with the run-off of the rainy season.
Traditionally the local farmers used to plant mangroves alongside the earthen embankments of their gazni rice field cum fish farming areas. These mangroves helped in stabilizing the bunds from erosion due to tides and waves and torrential rains of the region. Ever-since the Government built permanent embankments in the estuaries to protect the rice fields the practice of planting mangroves by the locals almost waned out. Nevertheless the Forest Department, during the last one decade raised mangroves in large areas of the estuary. When fully grown these mangroves will make the estuary a haven for birds, increase productivity of the estuary in terms of fish, prawns, crabs, bivalves, oysters etc.
In the heart of the mangrove enriched estuarine centre is a small uninhabited island which is the abode of ‘Babrudevaru’, the guardian deity of the estuary. The deity is worshipped by people from all the estuarine villages who have strong cultural bonds with the deity. A stretch of mangrove forest dominated by the several ancient trees of Avicennia officinalis is considered so sacred that no one should step inside it wearing footwear. Numerous birds, both migratory (during winter) and resident ones are associated with this sacred kan forest.
The huge production of edible bivalves in the mudflats adjoining Aghanashini river mouth, although some kilometers away from the proposed mangrove heritage site, owe their productivity to the rich input of detritus from mangroves in addition to the organic matter input brought into the estuary from the Western Ghats. No village community has exclusive jurisdiction over the proposed area, nor the Forest Department has any legal rights over there, in spite of the Department being responsible for enriching the estuary with mangroves for the last one decade and conserving it. The mangroves do not come under the Reserved Forest and are vulnerable to damages in the future in the absence of any formal protective measures. Their continued existence has to solely depend on the levels of awareness among the public and the constant vigil that the Department has to keep. Therefore the BHS status can be justified.
Any decline in mangroves will have severe adverse consequences not only on mangroves but also on the estuarine ecosystem and productivity as a whole; both goods and services from the estuary, will be adversely affected by such contingencies.
Threat if any (give details): The estuarine farmers were aware of the importance of mangroves in protecting the earthen bunds of their estuarine rice fields locally known as gaznis. Their practice from time immemorial was to raise mangrove trees alongside the gazni bunds. When the Government constructed permanent embankments for the gaznis to ensure better protection from salt water inundation on a permanent basis, the awareness pertaining to the importance on the role of mangroves dwindled among the local population. The growth of shrimp farming as an enterprise resulted in the creation of numerous aqua-cultural ponds, very often destroying the mangrove vegetation in the process. Such degradation of the mangroves continued until the end of the last century, until the Forest Department came in a big way to restore mangroves, by planting over a million saplings during the last one decade. As a permanent management mechanism for the mangroves is wanting this precious ecosystem any time in future is likely to be affected, to meet demand for timber and firewood from locals as well as outside. Further, in the absence of any formal protective mechanism the mangrove ecosystem stands to be affected by increasing developmental pressures in the densely populated coastal region.
9.1 ESTUARINE DECAPODS IN ECOLOGICAL PERSPECTIVE
Crustacea is a subphylum under the phylum Arthropoda. The group consists of organisms like crabs, lobsters, crayfish, shrimps, copepods, krill, woodlice and barnacles. The crustaceans exhibit the fourth greatest diversity among the animal groups. The majority of them are aquatic, and most are marine. The body has three divisions, namely the head, thorax and abdomen. The head has two pairs of antennae, a pair of mandibles, a pair of usually stalked compound eyes and two pair of maxillae. Each body segment has a pair of appendages. The body is covered with an exoskeleton, and respiration is by gills. The walking legs, including a pair of specialized chelipeds, may be used for capturing prey (Myers 2001). Whereas the number of crustacean species described/accepted around the world stands at 47,000, the number of estimated species around the world is 150,000 (Chapman 2009).
The Decapoda or decapods (literally ‘10-footed’) constitute an order of crustaceans. The order includes many familiar arthropods which have great ecological and economic importance such as prawns, shrimps, crabs and lobsters. Prawns are larger in size and have larger legs, with claws on three pairs. They have branching gills. Shrimps are smaller, have shorter legs and have claws only on two pairs. Their gills are lamellar, i.e., plate-like. The Decapoda is an order of around 2700 genera and about 15,000 species. Nearly half of these species are crabs, with the shrimps (about 3000 species) and Anomura (including hermit crabs, porcelain crabs and squat lobsters (about 2500 species) making up the bulk of the remainder (De Grave et al. 2009).
Crustacean-based economy: The crustaceans are an important source of food protein for humans. It has been argued that the crustacean fishery sector deserves greater attention because it generates high-value export products, thereby enabling producers to buy lower-value products in the world market and thus make a positive contribution to food security in both producing and exporting countries (Bondad-Reantaso et al. 2012). To meet the rising global demand for crustaceans, there has been a phenomenal increase in crustacean production through aquaculture in recent times, overtaking production through capture fisheries. For the year 2013, the crustacean production in the world, through aquaculture, reached 6.7 million tons, of which 61.5 per cent was through mariculture and the rest through inland aquaculture. In the same year, India produced 290,200 tons of crustaceans through mariculture, accounting for 7 per cent of the global production in that sector (FAO 2015).
Way back in 1991, a specially constituted international body, GESAMP (Joint Group of Experts on the Scientific Aspects of Marine Pollution), vide its Reports and Studies No. 47, while acknowledging the substantial socio-economic benefits arising from the expansion of coastal aquaculture, noted with concern the significant ecological changes caused in some coastal areas due to large-scale aquaculture of crustaceans, fishes, bivalves and seaweeds. Naturally productive wetland habitats were destroyed, affecting wildlife, and through uncontrolled introductions and transfers of alien species altering or impoverishing native biodiversity. The indiscriminate use of bioactive compounds like pesticides and antibiotics has become matters of concern. The health implications of the use of chemicals and the consumption of seafood grown in contaminated waters were noted as problems of growing concern, along with the spread of infectious diseases such as typhoid fever, cholera and hepatitis. Market failures, socio-economic impacts and various ecological problems called for more sustainable aquaculture (FAO 2011).
Karnataka’s estuaries witnessed a rapid ecological degradation due to conversion of community-managed agricultural-cum-fishery fields (the gaznis or kharlands) into aquaculture ponds for prawn farming, leading to ecological and socio-economic fallouts. As such problems mounted along the Indian coast, the Supreme Court of India, vide its judgment dated 11 December 1996, tried to rein in the problem by treating aquaculture on par with industries and hence as covered by the prohibition imposed in the Coastal Regulation Zone Notification, 1991. The Supreme Court ruled that no shrimp culture pond shall be constructed/set up within the Coastal Regulation Zone (CRZ), except traditional and improved traditional types of ponds. The existing ponds had to be demolished. The agricultural lands, salt pan lands, mangroves, wet lands, forest lands, land for village common purposes and land meant for public purposes shall not be used/converted for construction of shrimp culture ponds (Ministry of Agriculture, GOI 2002). These regulations brought in some respite for the estuaries of Karnataka, including Aghanashini, which were on a steady course towards ecological degradation.
Marine decapod fishery, India: As regards India, the rich continental shelf area is a good habitat for demersal fishes and various crustaceans, penaeid prawns and non-penaied prawns, crabs, lobsters and stomatopods. These resources are being harvested mainly through operation of mechanized trawlers. The mean crustacean landings along the Indian coast during 1996–2011 stood at 439,168 tons. The total crustacean landing from the west coast during 2011 was 309,551 tons, making 58.1 per cent of the total Indian landings during the same year. Of this total production from the west coast, Gujarat’s contribution was highest, at 27.6 per cent, followed by Maharashtra (24.1 per cent), Kerala (13.8 per cent), Karnataka (6.4 per cent) and Goa (1.2 per cent) (Maheswarudu 2013). The state-wise diversity (number of species) of commercially important crustaceans is given in Table 1.
Table 1.Number of commercially important crustacean species in Indian coastal states
|
State |
No. of species |
Total no. of species |
|||
|
Penaeids |
Non-penaieds |
Crabs |
Lobsters |
|
|
|
West coast |
|
|
|
|
|
|
Gujarat |
10 |
3 |
2 |
1 |
16 |
|
Maharashtra |
8 |
3 |
3 |
1 |
15 |
|
Karnataka |
8 |
|
3 |
|
11 |
|
Kerala |
8 |
3 |
6 |
|
17 |
|
East coast |
|
|
|
|
|
|
Tamil Nadu |
13 |
3 |
11 |
7 |
34 |
|
Andhra Pradesh |
24 |
3 |
5 |
1 |
33 |
|
Orissa |
11 |
|
5 |
|
16 |
|
West Bengal |
11 |
|
|
|
11 |
Decapods of Aghanashini—brachyuran crabs: Whereas the economically important prawns from the estuary were well known and their life cycles, involving the marine areas and estuaries somewhat well-worked out through various studies conducted elsewhere, very little scientific work had been done on the crabs of Aghanashini. Therefore, the support from GIZ, India for systematic documentation of the crabs is gratefully acknowledged. The execution of integrated management of the coastal zone, particularly the estuaries, will be incomplete without a database on crabs, which is seldom ever worked out for the estuaries of at least Karnataka. Our concerted efforts, lasting over a few months, yielded data on 30 species of brachyuran crab from the estuary, by far the largest number known for any estuary of Karnataka (Shet et al. 2016). As crab taxonomists are not easily available, it will be a challenging task to attempt such studies in more estuaries of the state.
Crabs belong to the order Decapoda, having five pairs of legs. The true crabs belong to the suborder Brachyura (having a short tail); the tail here actually referring to the shortened flap-like abdomen folded under the body. Some swim temporarily, but most walk on the substratum. Some climb trees, and others make burrows on land. The brachyurans have a widespread distribution, from shores and fresh water to brackish water and the deep sea. The marine littoral zone is particularly rich in crabs (Haefner 1985; Stevcic, 2005).
Ecological role of crabs: Crabs are filter feeders, predators, commensals and parasites. The diversity of these omnivores and scavengers is overwhelming. They feed on plant and animal matter. Their diet includes detritus, smaller bivalves, gastropods, fishes and crustaceans, including crabs, insects and other smaller benthic organisms. The mainly herbivorous sesarmid crabs prefer the leaves of mangroves (Virnstein 1977; Ravichandran et al. 2006; Linton and Greenway 2007; The crabs of the coastal zone play significant roles in food chains and ecology as their larvae are consumed by many predators and omnivorous fishes and in turn the crabs themselves feed on a variety of organisms, vegetation and detritus, playing a crucial role in coastal and marine ecosystems (Vorsatz 2009). The fiddler crabs (Uca spp.) are associated with intertidal zones. They contribute significantly to the functioning of ecosystems by their repeated burrowing and re-burrowing activities, which enhance the aeration of the soil, reshuffle textural components of different layers of sediments and promote nutrient recycling. These biogenic processes, collectively termed as ‘bioturbation’, act as major modulators of microbial activities and accelerate biogeochemical processes at the land–water interface. Bioturbation is defined as biological reworking of soils and sediments through animal activities like burrowing and feeding. Crab excreta, being a good source of carbon, nitrogen, phosphorus and trace metals, constitutes rich food for other consumers. The crabs and their larvae play major roles in estuarine/coastal food webs, feeding on diverse kinds of food and being consumed in turn by many predators and omnivorous fishes (Jeyabaskaran et al. 2002; Meysman et al. 2006; Chatterjee et al. 2014). Nutrient cycling in mangrove forests is strongly linked to detrital processing of leaf litter, as compared with direct herbivorous consumption. Sesarmid crabs play a key role in detrital pathways in mangrove forests by processing a large amount of the leaf litter produced in the ecosystem. Shanij et al. (2016) reported the rate of leaf litter translocation and consumption by a sesarmid crab, Neosarmatium malabaricum, in a Kerala study.
Crab diversity in Indian estuaries: The infraorder Brachyura has 6793 species of crabs under 93 families (Ng et al. 2008)). The Indian waters have 600 species of crab recorded (Sukumaran 1995). Venkataraman and Wafer (2005) have reported 705 species of brachyuran crabs in 28 families and 270 genera from the Indian coast. A total of 226 species of brachyuran crab from 130 genera and 39 families were recorded from the west coast of India by Josileen (2015). Dineshbabu et al. (2011) reported 211 species of marine decapod (crabs and prawns together) from Karnataka. The freshwater crabs constitute one of the most understudied groups, and only 96 species have been reported (Pati et al. 2012; Bond-Buckup et al. 2007).
MATERIALS AND METHODS
Selection of sampling stations: The crab diversity was studied at six different stations within the estuary (Figure 1). Belekan and Kirubele are located close to the river mouth, where high salinity prevails throughout the year except during the monsoon months of June–September. The waves lash powerfully on the shore of the funnel-shaped river mouth, which is characterized by steep rising rocky terrain. Small sandy beaches occur here in enclaves. The river mouth narrows for some distance and widens into the estuary proper, spread on lowlands flanked by alluvial fields, marshes and intermittent hills, abutting the Western Ghats, which come close to the eastern shore of the estuary. Large mudflats rich in different species of edible clam and having some oyster beds are found close to the river mouth. Bargi and Kagal were the mid-estuary stations. The salinity was less here, and there were more mangroves and marshes in this zone. The alluvial and marshy rice fields in the intertidal zones have been reclaimed by building bunds made suitable for raising a salinity tolerant Kagga rice variety in the rainy season, when most of the salinity is washed out from the soils, followed by flooding of the fields with estuarine brackish water for fishery purposes. These traditional rice-cum-fishery fields have been to some extent modified to create aquaculture ponds for prawn culture, which has had telling effects on the overall ecology of the estuary. Small creeks and small islands as well as mangrove swamps and saltmarshes are common in the mid-estuary region. In the upstream section of the estuary, two stations, Hegde and Divigi, were chosen. The river narrows and is of restricted width in most places, being hemmed in by low laterite hills. These are lower-salinity stations due to mixing of fresh water (Shet et al. 2016).
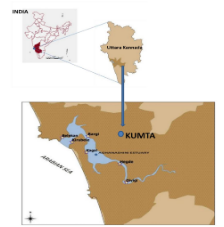
Figure 1. Locations of study stations in Aghanashini estuar
Habitat/micro-habitat diversity: The habitats and micro-habitats within the limits of each of these study stations were noted and the associated crab species were searched for. The notable habitats are rocky shores, sandy shores, mangroves, marshy areas, mudflats, subtidal submerged areas, etc.). Intertidal marshy areas/mudflats with no prominent plant cover were designated ‘intertidal’, ‘open marshy area’ and ‘mudflats’; marshy areas with marsh grasses/sedges are ‘intertidal marshes with sedges–grasses’. Mangrove areas near the low tide mark with oyster stones are ‘intertidal mangrove–oyster stones’, intertidal areas with oyster beds and no mangroves are ‘intertidal oyster beds’, and mangrove areas without oyster beds/stones are ‘mangrove covered areas’. The recognized habitats studied for crabs within each station, with their geographic locations, are listed in Table 2 (Shet et al. 2016).
Table 2. Station-wise characterization of crab habitats studied
|
Station (Latitude/Longitude) |
Sampling Site |
Habitats |
|
Divigi (14° 26.650′ N, 74° 26.136′ E) |
Upper estuary |
(1) Intertidal marsh with sedges–grasses |
|
(2) Estuarine border and embankment |
||
|
(3) Subtidal area |
||
|
Hegde (14° 28.554′ N, 74° 25.597′ E) |
Upper estuary |
(4) Intertidal marsh with sedges–grasses |
|
(5) Estuarine border and embankment |
||
|
(6) Subtidal area |
||
|
Kagal (14° 29.735′ N, 74° 22.747′ E) |
Mid-estuary |
(7) Mangrove-covered area |
|
(8) Intertidal oyster beds |
||
|
(9) Subtidal area |
||
|
Bargi (14°31.386′ N, 74° 22.879′ E) |
Mid-estuary |
(10) Mangrove-covered area |
|
(11) Mangrove with oyster stones |
||
|
(12) Subtidal area |
||
|
Belekan (14° 31.241′ N, 74° 20.682′ E) |
Lower estuary |
(13) Sandy shore |
|
(14) Rocky shore |
||
|
(15) Subtidal area |
||
|
Kirubele (14° 30.779′ N, 74° 21.523′ E) |
Lower estuary |
(16) Sandy shore |
|
(17) Rocky shore |
||
|
(18) Subtidal area |
Methods of crab study: The potential habitats/micro-habitats of crabs within the zone of each station were searched for crabs every month from August to December 2015. All-out searches for crabs were made mainly during the low tide. For the main body of the estuary constantly under submergence, the catches of local artisanal fisherfolk made using their various devices were relied upon. Photographs were taken of the habitats and associated crabs. Collection of sample specimens for identification was made by hand picking wherever the substratum was exposed. Moulted shells of crabs were also collected from the respective sites as supporting evidence. The burrowing crabs in intertidal areas were collected by digging the burrows. Crabs climbing on mangrove trees were also observed. Questionnaire-based interviews were conducted among the crab catchers to gain more information on crab species in relation to their habitats, times of occurrence, maturity, catching stage, uses in folk medicine, etc.
Identification: The collected sample specimens were photographed and left in the estuary in the case of commonly available ones; others were brought to the field station at Kumta for preservation and subsequent identification. Standard keys for crab identification by Alcock (1900), the National Institute of Oceanography website (http://www.niobioinformatics.in) and the Marine Biodiversity Database of India (http://www.biosearch.in) were mainly used. The classification of brachyuran crabs was adopted from the World Register of Marine Species (WoRMS) website (http://www.marinespecies.org). Unidentified and doubtful specimens were identified with the help of lab facilities and guidance provided by the Marine Sciences Department of Goa University.
RESULTS AND DISCUSSION
The brachyuran crabs observed belonged to 30 species under 23 genera and 11 families (Table 3). Sesarmidae, Portunidae and Ocypodidae were the leading families, with seven, six and four species, respectively. Table 3.3 provides the station-wise and habitat-wise crab distribution. The mid-estuary stations, Kagal and Bargi, with medium-salinity conditions during most of the post- and pre-monsoon periods were richest, with 24 and 25 species, respectively. At the high-salinity river-mouth stations, Belekan and Kirubele, 22 and 21 species were recorded, respectively. The low-salinity upstream location Hegde trailed marginally, with 18 species, whereas Divgi, further upstream, had 10 species, the least of all the stations. In all the stations, mangroves were richest in crab species, followed by marshy area, sandy shore, subtidal area and rocky shore. The number of crab species (30) is quite high compared with the 20 crab species recorded by Haragi et al. (2010) from Kali estuary, which is almost of the same size.
Table 3. Family-wise genera and species of brachyuran crabs in Aghanashini estuary
|
Sl. No. |
Family |
Number of Genera |
Number of Species |
|
1 |
Sesarmidae |
6 |
7 |
|
2 |
Portunidae |
4 |
6 |
|
3 |
Ocypodidae |
2 |
4 |
|
4 |
Grapsidae |
2 |
3 |
|
5 |
Dotillidae |
2 |
3 |
|
6 |
Menippidae |
2 |
2 |
|
7 |
Pilumnidae |
1 |
1 |
|
8 |
Oziidae |
1 |
1 |
|
9 |
Varunidae |
1 |
1 |
|
10 |
Macrophthalmidae |
1 |
1 |
|
11 |
1 |
1 |
|
|
Total |
23 |
30 |
|
The mud crabs Scylla serrata and S. olivacea were the most widespread across all the stations, occurring in 13 of 18 sites. Portunus pelagicus followed, with eight sites, and next were Metopograpsus messor, P. sanguinolentus, Thalamita crenata and Uca annulepis, each found in six sites. Crabs like Ashtoret lunaris, Grapus albolineatus, Dotilla myctiroides, Scopimera proxima, Menippe rumphii, Ozyus tuberculosis, Charybdis lucifera and Ocypode cordimanus were found only at river-mouth sites. Interestingly, Dotilla malabarica occurred only in an upstream site at Divgi, and Clistocoeloma tectum was found at a similar site in Hegde (Table 4).
Table 4. Station-wise and habitat-wise (see Table 3.1 for habitat numbers) diversity of brachyuran crabs in Aghanashini estuary (TS* = total sites)
|
Species and Family |
Station and Sampling Sites |
||||||||||||||||||
|
Divigi |
Hegde |
Kagal |
Bargi |
Belekan |
Kirubele |
TS* |
|||||||||||||
|
1 |
2 |
3 |
4 |
5 |
6 |
7 |
8 |
9 |
10 |
11 |
12 |
13 |
14 |
15 |
16 |
17 |
18 |
||
|
Ashtoret lunaris |
- |
- |
- |
- |
- |
- |
- |
- |
- |
- |
- |
- |
+ |
- |
+ |
+ |
- |
+ |
4 |
|
Sesarmidae |
|||||||||||||||||||
|
Neosarmatium malabaricum |
- |
- |
- |
+ |
+ |
- |
+ |
- |
- |
+ |
- |
- |
- |
- |
- |
- |
- |
- |
4 |
|
Perisesarma bidens |
- |
- |
- |
+ |
- |
- |
+ |
- |
- |
+ |
- |
- |
- |
- |
- |
- |
- |
- |
3 |
|
Parasesarma plicatum |
- |
- |
- |
+ |
- |
- |
+ |
- |
- |
+ |
- |
- |
- |
- |
- |
- |
- |
- |
3 |
|
Sesarmops intermedius |
- |
- |
- |
+ |
- |
- |
+ |
- |
- |
+ |
- |
- |
- |
- |
- |
- |
- |
- |
3 |
|
Pseudosesarma edwardsi |
+ |
- |
- |
+ |
- |
- |
- |
- |
- |
- |
- |
- |
- |
- |
- |
- |
- |
- |
2 |
|
Clistocoeloma lanatum |
- |
- |
- |
+ |
- |
- |
+ |
- |
- |
+ |
- |
- |
- |
- |
- |
- |
- |
- |
3 |
|
Clistocoeloma tectum |
- |
- |
- |
+ |
- |
- |
- |
- |
- |
- |
- |
- |
- |
- |
- |
- |
- |
- |
1 |
|
Grapsidae |
|||||||||||||||||||
|
Grapsus albolineatus |
- |
- |
- |
- |
- |
- |
- |
- |
- |
- |
- |
- |
- |
+ |
- |
- |
+ |
- |
2 |
|
Metopograpsus messor |
- |
+ |
- |
- |
+ |
- |
+ |
+ |
- |
+ |
+ |
- |
- |
- |
- |
- |
- |
- |
6 |
|
Metopograpsus latifrons |
- |
- |
- |
- |
- |
- |
+ |
- |
- |
+ |
- |
- |
- |
- |
- |
- |
- |
- |
2 |
|
Macrophthalmidae |
|||||||||||||||||||
|
Macrophthalmus pacificus |
+ |
- |
- |
+ |
- |
- |
+ |
- |
- |
+ |
- |
- |
- |
- |
- |
- |
- |
- |
4 |
|
Dotillidae |
|||||||||||||||||||
|
Dotilla malabarica |
- |
+ |
- |
- |
- |
- |
- |
- |
- |
- |
- |
- |
- |
- |
- |
- |
- |
- |
1 |
|
Dotilla myctiroides |
- |
- |
- |
- |
- |
- |
- |
- |
- |
- |
- |
- |
+ |
- |
- |
- |
- |
- |
1 |
|
Scopimera proxima |
- |
- |
- |
- |
- |
- |
- |
- |
- |
- |
- |
- |
+ |
- |
- |
+ |
- |
- |
1 |
|
Menippidae |
|||||||||||||||||||
|
Menippe rumphii |
- |
- |
- |
- |
- |
- |
- |
- |
- |
- |
- |
- |
- |
+ |
- |
- |
+ |
- |
2 |
|
Myomenippe hardwickii |
- |
- |
- |
- |
- |
- |
- |
- |
- |
+ |
- |
- |
- |
+ |
- |
- |
+ |
- |
3 |
|
Pilumnidae |
|||||||||||||||||||
|
Heteropanope glabra |
- |
- |
- |
- |
- |
- |
+ |
+ |
- |
+ |
+ |
- |
- |
- |
- |
- |
- |
- |
4 |
|
Oziidae |
|||||||||||||||||||
|
Ozius tuberculosus |
- |
- |
- |
- |
- |
- |
- |
- |
- |
- |
- |
- |
- |
+ |
- |
- |
+ |
- |
2 |
|
Varunidae |
|||||||||||||||||||
|
Paraypyxidognathus deianira |
- |
- |
- |
- |
- |
- |
+ |
+ |
- |
+ |
+ |
- |
- |
- |
- |
- |
- |
- |
4 |
|
Portunidae |
|||||||||||||||||||
|
Charybdis lucifera |
- |
- |
- |
- |
- |
- |
- |
- |
- |
- |
- |
- |
+ |
+ |
+ |
+ |
+ |
+ |
6 |
|
Portunus pelagicus |
- |
- |
- |
- |
- |
- |
+ |
- |
+ |
+ |
- |
+ |
+ |
- |
+ |
+ |
- |
+ |
8 |
|
Portunus sanguinolentus |
- |
- |
- |
- |
- |
- |
- |
- |
+ |
- |
- |
+ |
+ |
- |
+ |
+ |
- |
+ |
6 |
|
Scylla olivacea |
+ |
- |
+ |
+ |
+ |
+ |
+ |
- |
+ |
+ |
- |
+ |
+ |
- |
+ |
+ |
- |
+ |
13 |
|
Scylla serrata |
+ |
- |
+ |
+ |
+ |
+ |
+ |
- |
+ |
+ |
- |
+ |
+ |
- |
+ |
+ |
- |
+ |
13 |
|
Thalamita crenata |
- |
- |
- |
- |
- |
- |
- |
- |
+ |
- |
- |
+ |
- |
+ |
+ |
- |
+ |
+ |
6 |
|
Ocypodidae |
|||||||||||||||||||
|
Ocypode cordimana |
- |
- |
- |
- |
- |
- |
- |
- |
- |
- |
- |
- |
+ |
- |
- |
+ |
- |
- |
2 |
|
Uca annulepis |
+ |
+ |
- |
+ |
+ |
- |
+ |
- |
- |
+ |
- |
- |
- |
- |
- |
- |
- |
- |
6 |
|
Uca dussumieri |
- |
- |
- |
- |
- |
- |
+ |
- |
- |
+ |
- |
- |
- |
- |
- |
- |
- |
- |
2 |
|
Uca vocans |
- |
- |
- |
- |
- |
- |
+ |
- |
- |
+ |
- |
- |
- |
- |
- |
- |
- |
- |
2 |
|
Total number of species at sample site |
5 |
3 |
2 |
11 |
5 |
2 |
16 |
3 |
5 |
17 |
3 |
5 |
9 |
6 |
7 |
8 |
6 |
7 |
|
|
Total species station-wise |
10 |
18 |
24 |
25 |
22 |
21 |
|
||||||||||||
Habitat-wise distribution: Details of the habitat-wise distribution of the crab species are given in Table 5. Whereas some species like Grapsus albolineatus were observed only on rocky shores, Scylla serrata and S. olivacea occurred at several habitats.
Table 5.Habitat preferences of brachyuran crabs in Aghanashini estuary
|
Species |
Habitat Type |
|||||||||||||||||
|
Marshy Area |
Mangrove |
Sandy Shore |
Rocky Shore |
Subtidal Area |
||||||||||||||
|
1 |
2 |
4 |
5 |
7 |
8 |
10 |
11 |
13 |
16 |
14 |
17 |
3 |
6 |
9 |
12 |
15 |
18 |
|
|
Ashtoret lunaris |
- |
- |
- |
- |
- |
- |
- |
- |
+ |
+ |
- |
- |
- |
- |
- |
- |
+ |
+ |
|
Grapsus albolineatus |
- |
- |
- |
- |
- |
- |
- |
- |
- |
- |
+ |
+ |
- |
- |
- |
- |
- |
- |
|
Metopograpsus messor |
- |
+ |
- |
+ |
+ |
+ |
+ |
+ |
- |
- |
- |
- |
- |
- |
- |
- |
- |
- |
|
Metopograpsus latifrons |
- |
- |
- |
- |
+ |
- |
+ |
- |
- |
- |
- |
- |
- |
- |
- |
- |
- |
- |
|
Paraypyxidognathus deianira |
- |
- |
- |
- |
+ |
+ |
+ |
+ |
- |
- |
- |
- |
- |
- |
- |
- |
- |
- |
|
Neosarmatium malabaricum |
- |
- |
+ |
+ |
+ |
- |
+ |
- |
- |
- |
- |
- |
- |
- |
- |
- |
- |
- |
|
Perisesarma bidens |
- |
- |
+ |
- |
+ |
- |
+ |
- |
- |
- |
- |
- |
- |
- |
- |
- |
- |
- |
|
Parasesarma plicatum |
- |
- |
+ |
- |
+ |
- |
+ |
- |
- |
- |
- |
- |
- |
- |
- |
- |
- |
- |
|
Sesarmops intermedius |
- |
- |
+ |
- |
+ |
- |
+ |
- |
- |
- |
- |
- |
- |
- |
- |
- |
- |
- |
|
Pseudosesarma edwardsii |
+ |
- |
+ |
- |
- |
- |
- |
- |
- |
- |
- |
- |
- |
- |
- |
- |
- |
- |
|
Clistocoeloma lanatum |
- |
- |
+ |
- |
+ |
- |
+ |
- |
- |
- |
- |
- |
- |
- |
- |
- |
- |
- |
|
Clistocoeloma tectum |
- |
- |
+ |
- |
- |
- |
- |
- |
- |
- |
- |
- |
- |
- |
- |
- |
- |
- |
|
Dotilla malabarica |
- |
+ |
- |
- |
- |
- |
- |
- |
- |
- |
- |
- |
- |
- |
- |
- |
- |
- |
|
Dotilla myctiroides |
- |
- |
- |
- |
- |
- |
- |
- |
+ |
- |
- |
- |
- |
- |
- |
- |
- |
- |
|
Macrophthalmus pacificus |
+ |
- |
+ |
- |
+ |
- |
+ |
- |
- |
- |
- |
- |
- |
- |
- |
- |
- |
- |
|
Ocypode cordimana |
- |
- |
- |
- |
- |
- |
- |
- |
+ |
+ |
- |
- |
- |
- |
- |
- |
- |
- |
|
Scopimera proxima |
- |
- |
- |
- |
- |
- |
- |
- |
+ |
+ |
- |
- |
- |
- |
- |
- |
- |
- |
|
Uca annulepis |
+ |
+ |
+ |
+ |
+ |
- |
+ |
- |
- |
- |
- |
- |
- |
- |
- |
- |
- |
- |
|
Uca dussumieri |
- |
- |
- |
- |
+ |
- |
+ |
- |
- |
- |
- |
- |
- |
- |
- |
- |
- |
- |
|
Uca vocans |
- |
- |
- |
- |
+ |
- |
+ |
- |
- |
- |
- |
- |
- |
- |
- |
- |
- |
- |
|
Charybdis lucifera |
- |
- |
- |
- |
- |
- |
- |
- |
+ |
+ |
+ |
+ |
- |
- |
- |
- |
+ |
+ |
|
Portunus pelagicus |
- |
- |
- |
- |
+ |
- |
+ |
- |
+ |
+ |
- |
- |
- |
- |
+ |
+ |
+ |
+ |
|
Portunus sanguinolentus |
- |
- |
- |
- |
- |
- |
- |
- |
+ |
+ |
- |
- |
- |
- |
+ |
+ |
+ |
+ |
|
Scylla olivacea |
+ |
- |
+ |
+ |
+ |
- |
+ |
- |
+ |
+ |
- |
- |
+ |
+ |
+ |
+ |
+ |
+ |
|
Scylla serrata |
+ |
- |
+ |
+ |
+ |
- |
+ |
- |
+ |
+ |
- |
- |
+ |
+ |
+ |
+ |
+ |
+ |
|
Thalamita crenata |
- |
- |
- |
- |
- |
- |
- |
- |
- |
- |
+ |
+ |
- |
- |
+ |
+ |
+ |
+ |
|
Heteropanope glabra |
- |
- |
- |
- |
+ |
+ |
+ |
+ |
- |
- |
- |
- |
- |
- |
- |
- |
- |
- |
|
Menippe rumphii |
- |
- |
- |
- |
- |
- |
- |
- |
- |
- |
+ |
+ |
- |
- |
- |
- |
- |
- |
|
Myomenippe hardwickii |
- |
- |
- |
- |
- |
- |
+ |
- |
- |
- |
+ |
+ |
- |
- |
- |
- |
- |
- |
|
Ozius tuberculosus |
- |
- |
- |
- |
- |
- |
- |
- |
- |
- |
+ |
+ |
- |
- |
- |
- |
- |
- |
|
Total number of species at sample site |
5 |
3 |
11 |
5 |
16 |
3 |
17 |
3 |
9 |
8 |
6 |
6 |
2 |
2 |
5 |
5 |
6 |
6 |
|
Total number of species in habitat |
13 |
17 |
9 |
6 |
7 |
|||||||||||||
- Mangroves: Mangrove areas were richest in crab diversity, altogether accounting for 17 species. Marshes of intertidal zones with sedges, due to their muddy bottom and vegetation, had some species in common with mangroves. Notable were Metapograpus latifrons, Macropthalamus pacificus, Uca annulepis, etc. The economically very important mud crabs Scylla serrata and S. olivacea were most widespread in the estuary, with mangrove areas accounting for the bulk of their catch. M. latifrons, which is typical of the mangrove environment, climbs on mangrove trees as well. Bandekar et al. (2011) described 13 crab species from the mangrove areas of Kali estuary, whereas we found 17 species associated with mangroves in our study area. We could not find Grapsus albolineatus (of rocky habitats), Ocypode cordimana and Dotilla myctrioides (of sandy shore) and Thalamita crenata (of sandy shore and subtidal area), which were found associated in the Kali studies with mangroves in our mangrove habitats. Kulkarni and Mukadam (2015) found nine species of crab in the mangroves of Bhatye estuary, of Ratnagiri. A few of them like Charybdis callianassa, C. orientalis, Matuta planipes and Sesarma quadrata were not found in Aghanashini mangroves. These studies and others indicate that the mangroves could support a much greater diversity of crabs than we had thought. The mangrove crabs play an important role in the decomposition of mangrove leaf litter, making the organic material available to secondary consumers (Ajmalkhan et al. 2005). The role of mangrove areas in supporting prawn juveniles was highlighted by Primavera (1998).
- Marshy areas: Such areas are common in the estuary and are exposed during low tides. The marshes may be with or without vegetation, mainly sedges with occasional woody mangrove species, especially the shrubby Acanthus ilicifolius and the mangrove fern Acrostichum aureum (in low salinity levels). The marshy habitats had altogether 13 species of crab—the most widespread were Uca annulepis, followed by Pseudosesarma edwardsii, Macrophthalmus pacificus, Scylla olivacea and S. serrata. Pandya and Vachhrajani (2013) found U. annulepis and S. serrata associated with the silty and clayey substratum of Mahi estuary of Gujarat. They found Ashtoret lunaris also in silty and clayey substrata, whereas in our study it was found more on sandy shores.
- Sandy shores: Belekan and Kirubele, towards the river mouth, have small sandy beaches. The wave action is more forceful towards the river mouth. Nine species of crab occurred here, of which Dotilla myctiroides, Ocypode cordimana and Scopimera proxima were found be exclusive to such areas.
- Rocky shores: Natural rocky shores characterized the river-mouth stations Belekan and Kirubele. Six species of crab were found associated with this habitat, which is subjected to higher wave action compared with the interior of the estuary. Crabs exclusive to this habitat type were Grapsus albolineatus and Menippe rumphii.
- Subtidal areas: These are submerged parts of the estuary. It is probable that most crabs pass through such water-covered areas while shifting their locations or for feeding purpose or en route to the sea for egg-laying and back. Of the seven species recorded associated with such habitats, none was exclusive to it. The family Portunidae was dominant among the six species found associated with this habitat. Of these Charybdis lucifera and Ashtoret lunaris were exclusive to the river-mouth stations.
Estuarine–marine phases of crabs: Many crabs spawn in the estuaries. Most estuarine crab larvae emigrate from estuaries soon after they hatch, develop to the post-larval stage in the coastal ocean and then immigrate to the estuaries and settle in adult habitats, except in large estuaries. The timing of larval release typically during large-amplitude nocturnal ebb tides and the positions such larvae take in the ebb currents specifically promote rapid, en masse seaward transport of larvae rather than their retention in the estuary (Christy and Morgan 1998). In tropical estuaries especially, according to a Costa Rican study, for many crabs spawning occurred in the estuaries, but individual taxa showed distinct seasonality. Several taxa spawned in the estuary, but their early stages were transported seaward by tides whereas later zoae and megalopae were recruited back into the estuary. For some species, larvae were retained in the mangrove areas and not exported (Dittel and Epifanio 1990). Such dispersal may minimize their exposure to physiologically stressful conditions and to abundant predators in shallow upper estuarine waters. This was true for especially several species of fiddler crab (Uca spp.), Grapsidae, Xanthidae, Pinnotheres spp. and Petrolisthes spp. The early stages were more abundant during ebb tides, suggesting that these larvae were spawned in the creek/estuary and exported to the open sea. Advanced zoea and megalopa stages appeared to take advantage of nocturnal flood tides to get recruited back into the estuary (Lopez-Durate et al. 2011).
Most crabs freely move between the ocean and the estuary, the latter being important as nurseries and feeding grounds and the marine areas critical as spawning/breeding areas. The marine food crab Portunus sanguinolentus, which contributes to fisheries in all the maritime states of India, spawns in the sea. The hatching may be taking place in nearshore waters as juveniles were caught here. The same is the case with the blue crab P. pelagicus, the juveniles of both migrating into inshore waters and estuaries. For P. pelagicus, spawning activity was pronounced in January–February and in September, when the salinity keeps rising after the monsoons. Certainly the monsoon, or the months immediately after the monsoon, is not the time for spawning in the estuary, which witnesses the lowest salinity. These crabs spawn in inshore waters during the post-monsoon period, whereas spawning takes place in deeper waters during the monsoon, obviously due to the higher salinity. Even though berried females were observed in the estuary, they migrate to more saline and deeper waters for spawning during the monsoon. As crabs mainly feed on crustaceans, fishes, molluscans, miscellaneous items and debris, the abundance of these food sources in a natural estuary plays an important role in determining the crab diversity and fishery (Sukumaran 1995).
Mud crab fishery: The mud crab Scylla spp. is the commercially most important crab species found in the mangrove habitats of the world. The mudcrab Scylla serrata is widely distributed among the species of Scylla. FAO (2010-2017) gave the details of annual global output of Scylla (mostly S. serrata) from capture fisheries, from a mere 6,160 tons in 1980 to 38,652 tons in 2014. As the demand escalated Scylla culturing was initiated in early 1980’s. From 1681 tons in 1981 the output of Scylla from aquaculture shot up to 183,852 tons in 2014. Typically associated with mangroves in estuaries and sheltered coastal habitats, it is found in soft muddy bottoms, where it digs deep burrows. Mating occurs in estuaries. The adult moves up to 50 km offshore to spawn. Crab instars to juveniles move into estuaries, tidal flats and mangroves. Mud crabs may spawn any time during the year. The earliest zoea and megalopa stages feed on zooplankton. Small crabs feed mainly on crustaceans, molluscs and worms. The sub-adult and adult crabs mainly eat molluscs and small crabs (FAO 2010–2017). Considering the high economic value of Scylla serrata, in Australia, marine protected areas (MPAs) and fish habitats have been declared specifically to protect local populations of the species. As far as this species is concerned, mating takes place inshore, and the mated females migrate offshore as the deeper waters provide a more chemically and thermally stable environment for development and greater chances of dispersal. Spawning involves the release of eggs in batches of 2–5 million at a time (Quinitio et al. 2007; Meynecke and Richards 2014). The adult females return to the estuarine habitats, accompanied by larvae (zoea and megalopa stages) migrating to the estuarine nursery grounds (Pittman and McAlpine 2003).
Prawn fishery: From the economic perspective, prawn fisheries and prawn aquaculture have been worked out in much greater detail for the coast of Karnataka compared with crabs. As there is much work done on this aspect in Aghanashini, and considering the limited scope of the project at hand, the manpower, time and resources, we have given a greater focus on crabs than on prawns in this chapter, devoted to decapods.
The mid-1980s witnessed a fishery decline at an alarming rate, causing great concern to the seafood export industry. The concerned sector visualized the need for intensification of prawn culture to augment the production to meet the export demands. Two million hectares of land was estimated to be the area available for fish culture; only 30,000 ha was being used for fish culture using traditional methods. According to an IIM study, 380 kg/ha was the average annual production of prawn and fish, of which prawns accounted for 86.58 per cent (Shastri 1987; Srivastava et al. 1985). As regards Karnataka, an extensive method of prawn culture was being practiced in several hundred hectares of estuarine lowlands. This was similar to the bheri system of West Bengal, and the Pokkali system of Kerala. The turnover was estimated at Rs.2893/ha (Shastri 1987). As this was considered meager, the farmers were being encouraged by the state government to go for scientific farming to increase the output. About 8000 ha was the estimated brackish water area available for prawn farming in the state.
Way back in 1963–1964, the Karnataka Government had launched the kharland schemes to convert swamps into kharlands by constructing strong bunds with sluice gates to regulate the water flow and facilitate paddy cultivation. In the 1970s the farmers realized the economic importance of prawns. The salinity tolerant Kagga was grown in the kharlands (gaznis in Aghanashini) during the rainy season. After the paddy was harvested, the estuary water was stocked along with prawns and fish it carried and released periodically through the sluice gates, during the low tides to filter the prawns and fish. Kumta (mainly Aghanashini) and Kundapur accounted for the major share of kharlands in the state. Important prawn resources of Karnataka include Peneaus indicus, P. monodon, P. merguiensis, Metapenaeus dobsoni, M. monoceros,. M. dobsoni and M. monoceros. M. dobsoni is the most abundant prawn seed in the estuaries of Karnataka, followed by P. indicus (Shastri 1987).
Penaeus indicus (Indian white prawn), is one of the major commercial prawn species of the world. It is a demersal species associated with bottom mud or sand. The male grows to a size of 184 mm, while the female attains 228 mm. It is very important in Indian inshore fisheries. It is an important product of the Pokkali rice fields of Kerala and the gazni estuarine rice fields of Karnataka (Kurien and Sebastian 1976). The estuaries and backwaters provide nursery grounds for P. indicus (FAO Catalogue 1980). The fry, juvenile and adolescent of prawns inhabit shore areas and mangrove estuaries, while most of the adults inhabit deeper waters down to 162 m Spawning takes place in the offshore waters, in the post-monsoon period, when the salinity is increased (Motoh 1985; Rajyalakshmi et al. 1985).
P. monodon feeds on crustaceans, vegetable matter, polychaetes, molluscs, fishes, insects, small crabs and shrimps. Reckless collection of the juveniles of P. indicus and other prawns from estuaries and backwaters using close meshed nets often causes wastage of millions of young ones of different species as there is no easy and non-destructive selective process for segregating the required ones (Suseelan 1996). Metapenaeus dobsoni, M, monoceros and P. monodon are highly vulnerable to stock depletion, taking into consideration the heavy exploitation of the juveniles and adults from estuarine and coastal waters. Shrimps of the family Penaeidae, except Parapenaeus, Parapenaeopsis and Tachysalambria, the other genera, need estuaries and low-saline coastal waters for growth and survival in their larval and juvenile stages. Changes in river flow patterns resulting from anthropological changes, especially construction of dams, are one of the major obstacles for the reproductive migration of decapods.
Conclusions
Coastal brachyuran crabs are associated with a diversity of estuarine habitats and micro-habitats. Aghanashini estuary is one of the most natural of the west coast estuaries, not yet subjected to any major developmental interventions such as upstream dams, especially hydroelectric projects, which have seriously impaired the salinity status of the neighbouring Sharavathi estuary, and many others on the west coast, upsetting their biodiversity, which ranges from mangroves and molluscs to fishes, the crustaceans being practically understudied (Chandran et al. 2012; Bhat et al. 2014; Boominathan et al. 2014). No major port exists in Aghanashini (except a small fishery port), nor is there any notable industry or township. The richness of crabs in the estuary therefore could be attributed to its relatively pristine condition.
The Aghanashini estuary, which witnessed an intensive mangrove afforestation drive by the Karnataka Forest Department in recent years, is turning out to be a big producer of edible mud crabs, which are associated mainly with mangroves. The most important of these are Scylla serrata and S. olivacea, the capture of which provides employment for a few hundred persons every day. Whereas the smaller crabs are more consumed as food in the local households and sold at local markets, the larger ones fetch a high value in big cities and are also exported to foreign markets. Portunus spp. are other important food species from the estuary and the sea coast.
The Aghanashini decapods, especially crabs, attain significance due to the fact that this could be one of the richest in diversity along the Indian west coast despite the relatively small size of the estuary. Within the less than 50 km2 area of backwaters, marshes and estuarine rice fields-cum-fishery areas is found so much diversity, especially among the crabs. Dineshbabu et al. (2011), covering eight estuaries of Karnataka, reported only 35 species of brachyuran crab. The Zoological Survey of India reported only 22 species of crab from the Marine National Park of the Gulf of Kachchh, despite the park having an area of 7350 km2 and having a combination of habitats like the coral reef, seagrass beds and sandy and muddy bottoms (Beelam et al. 2014). Shukla et al. (2013) listed only 14 species of crab from the much bigger Mahi and Dhadhar estuaries, of Gujarat. Notably, 13 of them were associated with dense mangroves, highlighting the importance of mangrove ecosystems. The estuarine mudflats of Mahi river had 10 species of brachyuran crab (Pandya and Vachhrajani 2013). The Pondicherry mangroves had 15 species (Satheeshkumar and Khan 2011), and the Pichhavaram mangroves had 23 crabs (Ravichandran et al. 2002).
The role of Aghanashini estuary in the fishery systems of the coast is very little known or appreciated. In this chapter, especially focusing on decapods, it is clarified sufficiently that as regards brachyuran crabs, the estuary and the sea function as a closely knit network playing decisive roles in the life cycles of crabs, and other crustaceans like prawns. The magnitude of the role of the estuary, in terms of economy and ecology, is such that it involves both estuarine and marine fisheries. This is hardly realized by policy makers and developers. They are also oblivious of the fact that uncouth interventions can adversely affect the lives of traditional human communities who have been greatly dependent on estuaries for their livelihoods and are packed around estuaries and along the coastal zone. As regards the natural estuary of Aghanashini (or Tadadi), it is under the deep shadow of an all-weather large port, for developing which the decks have almost been cleared by the state and Central governments, on the basis of an environmental impact assessment committee report that hardly reflects any ecological studies carried out in the estuary or its surroundings, leave alone the fisheries, including crustaceans, mangroves, clams, mussels and birds. This chapter, although mostly devoted to brachyuran crabs, suffices to point out the implications of attempting to create a mega port at the estuary of Aghanashini and hopefully will make the authorities reconsider the port issue.
THE EDIBLE CLAMS AND OYSTERS OF AGHANASHINI ESTUARY: A REVIEW
Mollusca is a large phylum of invertebrates of about 85,000 known species. Of marine, freshwater or terrestrial habitats, molluscans constitute about 23 per cent of all marine organisms (Chapman 2009). A morphologically diverse group of seven classes, Bivalvia -consists of marine and freshwater molluscs featured by laterally compressed bodies enclosed by two shell valves hinged in the middle on one side by a flexible ligament. Bivalves include several groups popularly known as clams, oysters, mussels, scallops, etc. Most of them are filter feeders with no part distinct as a head. Suspension-feeding invertebrates such as barnacles and bivalves occupy a central position in the food webs of intertidal communities throughout the world (Blanchette et al. 2007). Ctenidia are specialized organs of bivalves used for feeding and breathing. Most bivalves bury themselves in their sedimental habitat, while others lie on the sea floor or attach themselves to rocks or other hard surfaces. The hinged shell valves are of calcium carbonate and can be closed or opened, with often fine interlocking teeth along the free edges () (Venkatesan and Mohamed 2015).
In the current global fishery scenario, although bivalves contribute only 2 per cent of the capture fishery landings, their high unit price compensates for the smaller landed weight compared with the combined landed weight of fishes, crustaceans and other molluscs. The economic importance of bivalves therefore calls for efficient approaches to the conservation and management of wild populations (Gosling 2015). The bivalves make a potential cheap source of proteins and are consumed throughout the world as a delicacy. Clams belonging to a number of species and a few other edible bivalves occur in appreciable quantities in different parts of the Indian coast and support subsistence fisheries. Though many studies have been conducted in India on various aspects of bivalve taxonomy, biology, ecology and economy, despite their ever-increasing market demand, efforts are few and isolated as regards bivalve conservation and sustainable use. A large number of innovative studies undertaken so far by the scientists of Central Marine Fisheries Research Institute, Cochin, National Institute of Oceanography, Goa, Zoological Survey of India and many universities practically remain underutilized as regards preparation of a national strategy for bivalve conservation, sustainable use and protection of bivalve-based livelihoods. The bivalve fishery, especially of the Indian coastal zone, deserves more serious attention from the governments of the Centre and the states, particularly from the perspective of safeguarding the ecology of the estuaries and other backwaters, the creeks, inlets and bays and the rocky and sandy coastline, very important for the nutritional security of uncounted number of families and one of the largest informal sectors of women’s employment (Boominathan et al. 2008, 2014a, 2014b; Ramachandra et al. 2012).
Bivalves play important roles in the ecology of soft-bottom estuarine communities by influencing the species composition and sediment characteristics. As estuarine and coastal soft-bottom communities are some of the ecosystems most likely to be impacted by human activity (Lotze et al. 2006), unraveling their ecology is critical for integrated management. The bivalve study of Aghanashini, through the last few years, has to be considered all the more significant as the river is one spared hitherto from any major developmental interventions, especially dams, ports and major industries along its shores, and therefore continues to be more natural than most other Karnataka estuaries. Details of the comprehensive study on Aghanashini estuarine ecology and livelihoods are being brought out at a critical time, when the state and Central governments are getting ready for execution of a major estuarine all-weather port at Tadadi, in this estuary. The port project is believed to be in the final stages as the Expert Appraisal Committee (EAC) of the MoEFCC, Government of India, after evaluating the EIA report and additional information, recommended the project for environmental and CRZ clearance (http://environmentclearance.nic.in/writereaddata/Form1A/Minutes/160120174ZLWP9L4finalminutes12EAC.pdf). Various details on the richness of biodiversity, ecosystem and livelihood support based on Aghanashini estuary presented in this entire report, including it richness in edible bivalves, would, hopefully, provide additional dimensions for the port issue for a careful reconsideration of the same.
Estuarine salinity and bivalve diversity: Estuarine salinity is considered to be an important physicochemical property affecting bivalves (Harkantra 1975; Mohan and Velayudhan 1998; Boominathan et al. 2014). Salinity has the strongest influence on the bivalve assemblages across 15 sites studied in eastern Florida, superseding the influences of sediment type, water turbidity, temperature and other environmental parameters. The greatest diversity was found in higher-salinity euhaline sites, while the greatest abundance of individual bivalves was found in medium-salinity mixohaline sites, and the lowest diversity and abundance were found in the low-salinity oligohaline sites (McKeon et al. 2015). Many bivalves are euryhaline, able to tolerate a wide range of salinity, with self-sustaining populations being found in salinity levels ranging from 5 to 35 ppt salinity (Wilson et al. 2005). Mussels exposed to a sudden change in salinity close the shell valves and tend to gradually acclimatize to the new salinity regime (Bayne and Newell 1983). Salinity and temperature are positively correlated in the tropical conditions of the Indian west coast estuaries (Mohite and Mohite 2009), and therefore consideration of salinity alone can be taken as a decisive factor in the biology of bivalves. Of the various factors affecting estuarine and nearshore animals, Mohan and Velayudhan (1998) consider salinity a unique factor initiating functional responses. Since bivalves are mostly estuarine or nearshore in nature, they are highly influenced by the salinity variations, especially dilutions.
The construction of a barrage at Tanneermukkam, in Kerala’s Vembanad estuary, into which drain many of south and central Kerala’s rivers, has virtually divided the estuary into two portions, a northern portion, the Cochin estuary, which is exposed to salinity, and a southern portion of about 13,000 ha, the Vembanad lake system, which is protected from salinity intrusion because of the barrage. This part, receiving fresh water from several rivers draining the Western Ghats, has benefited immensely the farmers because the barrage prevents salt water entry into the lake and escape of fresh water into the Cochin estuary. In contrast, the fishermen are struggling with the low salinity of the upper estuary, which negatively affects shellfish reproduction. Vembanad’s southern part has 5000 collectors of the black clam Villorita cyprinoides (the only edible bivalve of the region which low salinity supports), who need to spend three times more to collect the same quantity of these clams after the bund construction. The black clam has declined in all low-salinity and freshwater areas, and the clam sizes have decreased too (Laxmilatha and Alloycious 2001; https://www.pressreader.com/uae/gulf-news).
That salinity changes due to anthropogenic intrusions in the river systems can be tumultuous for estuarine bivalves has been shown through our comparative study of species-wise bivalve distribution zones of the Aghanashini and Kali estuaries of Uttara Kannada. Whereas Aghanashini continues to be a natural estuary in terms of tidal influence and distribution zones of various edible bivalves, in Kali there is year-round release of fresh water from a series of upstream hydroelectric projects which has brought about significant dilution of the estuarine salinity, causing shifts in the occupation zones of different bivalve species in the form of seaward shifts as well as shrinkage of their occupation zones (Boominathan et al. 2014a). Nevertheless, Kali, having a larger estuary with creeks, still has suitable salinity conditions for all the bivalve species recorded earlier. All those species continue to exist in the Aghanashini estuary without any changes in their natural distribution zones, obviously due to no dams across the river.
Rao and Rao (1985) and Rao et al. (1989) mentioned the drastic decline of bivalves such as Meretrix meretrix, M. casta and the oyster Crassostrea madrasensis in the Sharavathi estuary of Uttara Kannada because of continuous fresh water inflow from upstream hydro-electric projects. The fishermen interviewed confirmed that even other edible bivalves of Aghanashini and Gangavali estuaries were present in the Sharavathi decades ago. But due to the execution of large hydroelectric projects in this relatively small river, and the consequent impact of large volumes of fresh water throughout the year, causing considerable dilution of the salinity of the estuary, made most bivalves vanishing from the estuary, sparing the mangrove clam Polymesoda erosa and an oyster that occurs closer to the river mouth (Boominathan et al. 2014b).
Bivalve fishery: The Indian scenario - A variety of clams, oysters, mussels and windowpane oysters are distributed along the Indian coastline. Many people are engaged in fishing for these. Clams and cockles formed 73.8 per cent of the catch, followed by oysters (12.5 per cent), mussels (7.5 per cent) and windowpane oysters (6.2 per cent). The major bivalve-producing states are Gujarat, Maharashtra, Goa, Karnataka, Kerala, Tamil Nadu, Pondicherry and Andhra Pradesh. For the period 1995–1996 to 2004–2005, the annual average clam production was about 57,000 tons, that of oysters about 18,800 tons and that of marine mussels about 14,900 tons (Mohamed 2013). Along the west coast of India, Kerala has estimated 72 per cent of the bivalve standing stocks, followed by Karnataka (15 per cent), Gujarat (6 per cent), Maharashtra (5 per cent) and Goa (2 per cent) (CMFRI 2014).
As regards bivalve utilization, India has been exporting bivalves, especially clam and mussel meat, to other nations. The meat is sold as smoked or dried, and the shell is sold as well. Smoked and canned oysters have a good market in Indian cities. Clam meat finds an important use as shrimp feed. Shells of bivalves are used in the manufacture of cement, calcium carbide, sand–lime bricks and lime. The lime is used as manure in coffee plantations, as mortar in building construction, in the treatment of effluents, as a fungicide (after being mixed with copper sulphate) and in the glass, rayon, polyfibre, paper and sugar industries. The shells are used as ornamental products and in various crafts (Mohamed 2013). Bivalves have good potential uses as bioindicators of heavy and trace elements like As, Cd, Cr, Cu, Pb, Se and Zn (Yusof et al. 2004). Bivalve shells have uses in both traditional and modern medicine in pain control and cancer treatment as calcium supplements and antiviral and antibacterial products (http://www.manandmollusc.net).
Notable food bivalves of Indian coast: As regards India, we have prepared a list of 27 taxa of bivalves used as food (Table 1).
NOTES ON THE BIVALVES OF AGHANASHINI ESTUARY
A good part of this chapter is based on a study carried out by our team during 2006–2008 (Boominanthan et al. 2008). The Aghanashini or Tadri estuary lies between latitudes 14.391° N and 14.585° N and longitudes 74.304° and 74.516° E. Situated in the estuarine complex of the river are about 25 villages. People from 19 of these villages are traditionally associated with bivalve harvesting (Figure 4.1). The entire estuary was surveyed for the distribution of edible bivalves (Figure 4.2). The village-wise number of individuals involved in bivalve harvesting was estimated. The numbers of bivalve harvesting months and days of harvesting per month were ascertained through sample surveys in every village. The quantities of bivalves collected per day by men and women, separately, were calculated to arrive at the total production for one year. Essential details of the Aghanashini bivalves as observed, as well as gathered from a review of the literature, are presented here.
Distribution of edible bivalves in Aghanashini (Figure 2): Nine species of food bivalve were collected from different parts of the estuary by the local bivalve collectors, who included men, women and sometimes children. These were the clams Paphia malabarica, Meretrix meretrix, M. casta, Katelysia opima, Villorita cyprinoides, Anadara granosa (Arca granosa) and Polymesoda erosa, the mussel Perna viridis and the oyster Crassostrea sp. The distributions of these species in the estuary are given in Figure 4.2. The salinity range and habitat type are important decisive factors in bivalve distribution. Considering the relative distances of the bivalve habitats within the estuary from the river mouth upstream, it was noted that the green mussel Perna viridis was confined to the rocky shore along the very river mouth, the seafront. All the others, except the black clam Villorita cyprinoides, occurred within 4 km of the river mouth. V. cyprinoides occurred in the farthest part, in a zone 10–18 km from the river mouth.
Table 1: Some edible species of bivalve in India
|
Sl. No. |
Common Name |
Scientific Name |
Synonym |
|
1 |
Bay clam |
Meretrix meretrix (Linnaeus,1758) |
Meretrix meretrix (Linn.) |
|
2 |
Backwater clam |
Meretrix casta (Gmelin, 1791) |
M. casta (Deshayes) |
|
3 |
|
Katelysia opima (Gmelin, 1791) |
Katelysia opima (Gmelin) |
|
4 |
Black clam |
Villorita cyprinoides (Gray, 1825) |
Velorita cyprinoids (Gray.) |
|
5 |
Cockle clam |
Gafrarium pectinatum (Linnaeus, 1758) |
Gafrarium tumidum (Roding) |
|
6 |
|
Gafrarium divaricatum (Gmelin, 1791) |
G. divaricatum (Gmelin) |
|
7 |
False cockle |
Cardites bicolor (Lamarck, 1819) |
Cardita bicolor Lam. |
|
8 |
False clam |
Protapes gallus (Gmelin, 1791) |
Paphia malabarica (Dilwyn) |
|
9 |
|
Marcia recens (Holten, 1802) |
P. marmorata (Reeve) |
|
10 |
|
Atactodea striata (Gmelin, 1791) |
Mesodesma glabratum (Lam.) |
|
11 |
|
Mactra cygnus Gmelin, 1791 |
Mactra corbiculoides (Deshayes) |
|
12 |
Asiatic cockle |
Vepricardium asiaticum (Bruguière, 1789) |
Cardium asiaticum (Bruguiere) |
|
13 |
Wedge-shells/clams |
Donax cuneatus Linnaeus, 1758 |
Donax cuneatus Linn |
|
14 |
|
Donax scortum (Linnaeus, 1758) |
D. scortum Linn. |
|
15 |
Green mussel |
Perna viridis (Linnaeus, 1758) |
Perna viridis |
|
16 |
Bearded weaving mussel |
Modiolus barbatus (Linnaeus, 1758) |
Modiolus barbatus (Linn.) |
|
17 |
Estuarine oyster |
Crassostrea bilineata (Röding, 1798) |
Crassostrea madrasensis |
|
18 |
Rock oyster |
Saccostrea cucullata (Born, 1778) |
C. cucullata (Born) |
|
19 |
Disc oyster |
Ostrea chilensis Philippi, 1844 |
C. discoidea (Gould) |
|
20 |
Giant oyster |
Crassostrea cuttackensis (Newton & Smith, 1912) |
C. gryphoides (Newton & Smith) |
|
21 |
Ribbed ark-shell |
Tegillarca granosa (Linnaeus, 1758) |
Acra granosa Linn. |
|
22 |
True scallop |
Mimachlamys sanguinea (Linnaeus, 1758) |
Chlamys senatoria Gmelin (Pectinidae) |
|
23 |
|
Hiatula diphos (Linnaeus, 1771) |
Sanguinolaria diphos (Gmelin) |
|
24 |
|
Hiatula atrata (Reeve, 1857) |
S. atrata (Deshayes) |
|
25 |
Razor-shells |
Solen ceylonensis Leach, 1814 |
Solen truncatus (Sowerby) |
|
26 |
|
Solen vagina Linnaeus, 1758 |
S. brevis (Hanley) |
Source: Nayar, K Nagappan and Mahadevan, S (1974) Ill Edible Bivalves; Clams and others. In: CMFRI Bulletin No.25, The commercial molluscs of India. CMFRI, Mandapam Camp, pp. 40-53
Accepted names source: WoRMS
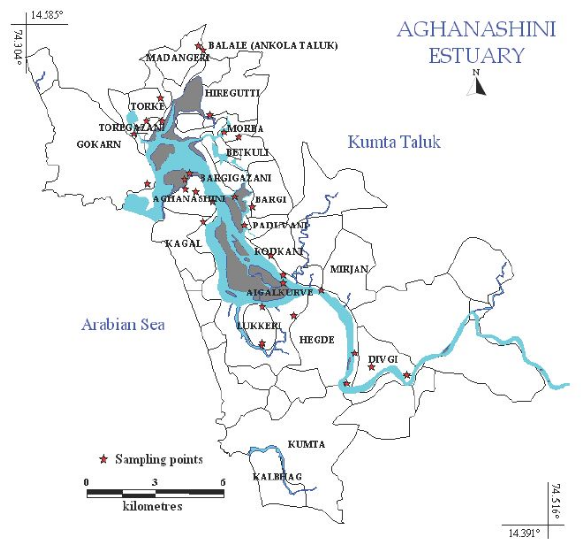
Figure 1. Villages of Aghanashini estuary associated with bivalve harvesting
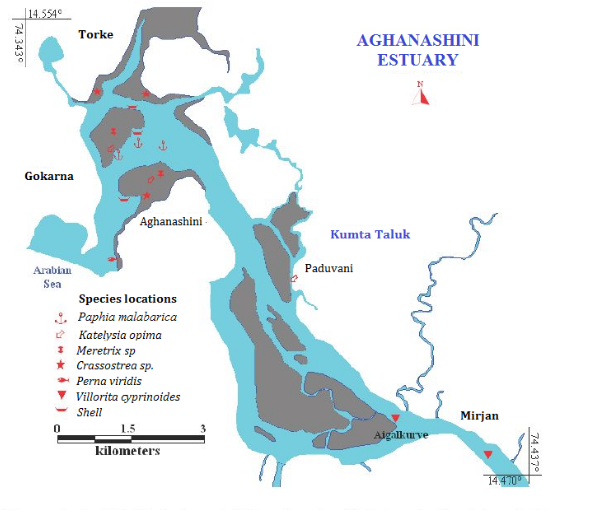
Figure 2. Spatial distributions of clam, mussel and oysters in the Aghanashini estuary
Paphia malabarica (Chemnitz): The Indian coast has five species of Paphia, of which P. malabarica is the most widely distributed along the south-west. It is exploited for local consumption as well as for export. It has been reported to be present in the 12–40 ppt salinity zone (Mohan and Velayudhan 1998). Its survival is recorded as being best in a salinity of 24 ppt, and the species does not survive under prolonged low-salinity conditions of 0–6 ppt (Patil 2002). There was a standing stock of 136 tons of the species in the Sharavathi, occupying an area of 11 ha, in March 1980 (Rao and Rao 1985). When the bivalve status was reviewed later in the estuary, the species was not traceable (Ramachandra et al. 2012), obviously as a notable impact of the hydroelectric project-related salinity decline. At Aghanashini it occupied a zone of up to 3 km from the seafront, as in the Gangavali, in the neighbourhood, there being no upstream dams across both rivers. In the Kali estuary, the species persisted only up to 1 km from the seafront, this representing a shift seawards due to dams-related salinity decline of a much lesser dimension compared with the Sharavathi.
In the Aghanashini estuary, P. malabarica was the main species collected throughout the year, with peak activities during March–May (Alagarswami and Narasimham 1973). P. malabarica has its distribution zone close to the river mouth. Thomas et al. (2003) reported that the species was exploited in the Dharmadom estuary of north Malabar from the bar mouth, from a zone up to 700 m inside the estuary. The clam bed was exploited throughout the year except during inclement weather conditions. The life span estimated was 2.5–3 years, with the clam attaining a length of 49.6 mm at the end of the second year. The greatest market movement was in the length range of 31–40 mm. In early 1990s, the 34–36 mm size was the most exploited group in the Ashtamudi estuary (Appukuttan 1993). In the Mulki estuary of Dakshina Kannada, P. malabarica was recorded throughout the year. The average numbers persquare metre ranged from nil to 44 in the monsoon season; from 55 to 66 in the post-monsoon period; and from 29 to 67 in the pre-monsoon period, with a standard deviation of 25.99 (Shivshankar and Lakshmibai 2016). The total standing stock of the clams in the Mulki estuary was 17,813 tons, with that of M. casta 10,409 tons and that of P. malabarica 7404 tons. The latter preferred habitats with a sandy clay substratum. Its spawning in the Ashtamudi estuary was observed during the post-monsoon (October–January) months (Appukuttan 1996), while in the Ratnagiri estuaries the breeding period was from September to January (Mohite and Mohite 2009).
Meretrix meretrix (Linnaeus): The genus Meretrix is reported to contribute 80 per cent of the total clam catch along the south-west coast of Maharashtra. The great clam M. meretrix was the major contributor and formed vast beds in the estuarine areas of the coast. It was exploited for meat and shell and frozen meat (Sawant 2012). M. meretrix formed large beds in many creeks and estuaries all over the east and west coasts of India (Hornell 1917; Jones 1970; Nayar et al. 1984; Jayabal and Kalyani 1987; Boominathan et al. 2008; Dey et al. (2008)
M. meretrixhas a smooth subtrigonal shell, bearing some colour bands. The large size, thick valve and inflated shell indicate that the species is a sluggish burrower in muddy flats of sand and silt, intertidal areas with active sediment movements (Sur et al. 2006). It ranges in sizes from 47 mm (first year) to 61.5 mm (second year) in the Vellar estuary (Jayabal and Kalyani 1987) while it measured measured 40 mm, 49 mm and 55 mm, respectively, in the first, second and third years in Ratnagiri estuaries (Ranade 1964). In Kandleru estuary of Andhra Pradesh, most of the samples of M. meretrix were above 40 mm (Thangavelu et al. 2008). In Kali estuary, smaller sizes (7–17 mm) were found upstream, while the larger sizes (19–48 mm) occurred downstream in the estuary (Nair et al. 1984), demonstrating its preference for higher salinity values. M. meretrix prefers high salinity values. It was found in the Aghanashini and Gangavali estuaries of Uttara Kannada within 1–3 km of the river mouth. Clam beds are shallow, with low tide depths <1 m, and have sediments of fine sand. The salinity varies from 5.2 ppt to 42.5 ppt. A value of less than 10 ppt is not favourable for spawning (Narasimham et al. 1988). In bivalves, as reviewed by Sastry (1979), among the various exogenous factors, spawning is related to either rising or falling water temperatures/salinity values. Rao, K.S. (1987) reported that September–November is the spawning period along the west coast. Sawant and Mohite (2013) observed gonadial maturity during June–September and spawning from September to January in M. meretrix in Ratnagiri estuaries.
In the Kali estuary, maybe due to a hydroelectric project-related salinity decline, M. meretrix was found only within 1 km of the river mouth. The Sharavathi estuary once contained extensive clam beds, the most important species being M. meretrix (Alagarswami and Narasimham 1973). The species existed there up to the mid-1980s (Rao and Rao 1985, but obviously due to the constant discharge of fresh water from upstream dams (especially with the commissioning of the second power project at Gersoppa in 1999), the species seems to have disappeared without any trace (Ramachandra et al. 2012).
Meretrix casta (Chemnitz): A bivalve with considerable commercial and subsistence fisheries along the east and west coasts of India, M. casta occurs in the estuaries and backwaters of both coasts. It is a more euryhaline species than M. meretrix. In Aghanashini, the two species co-occur in mudflats. M. casta ranged in size from 16 mm to 30 mm in the Netravathi–Gurpur estuary (Rao and Rao 1985). Balasubramaniam and Natarajan (1987) reported sizes of 23 mm for the first year, 38.3 mm after 2 years and 50.6 mm for the third year for M. casta in the Vellar estuary. In the Chaliyar estuary of Kerala, the clams caught ranged in size from 16 mm to 33 mm. The mean length was 21.5 ± 2.26 mm. Over 50 per cent of the females were in a mature condition. The mean length in the Kavvai estuary of Kerala was 20.7 ± 3.14 mm, and over 34 per cent of the females were in a mature condition (Mansuri 2014). Salih (1973) found the clam attained a size of 35.4 mm in 11 months at the Cochin bar mouth. Too low a salinity value in the Sharavathi estuary due to the effect of hydroelectric projects in the river would have eliminated M. casta (Ramachandra et al. 2012), which was present very sparsely near the river mouth by Rao and Rao (1985). There was another negligible stock 600 m east of the Sharavathi bridge, near Mavinkurve Island (ibid.). In the Kali estuary its distribution was up to 3 km from the river mouth, whereas in Aghanashini and Gangavali, both natural estuaries without upstream dams, the occupation zone was up to 5 km from the river mouth (Ramachandra et al. 2012). The more saline conditions of Mandapam, however, reduced the growth rate.
In higher salinity conditions rate of filtration of water and feeding and sexual activities were ceased in M. casta (Durve 1970). Abraham (1953) reported that M. casta was a continuous breeder in the Adayar estuary, breeding during July–August and October–November and in summer. Rai (1932) observed that the principal breeding season of M. casta lasted from March to June and that with favourable weather the breeding would continue throughout the year except during the monsoon season. The abundance of M. casta was found to be positively correlated with the organic matter content in the substrate (Jayawickrema and Wijeyaratne 2009).
Katelysia opima (Gmelin): K. opima is third in abundance after the black clam Villorita spp. and great clam Meretrix spp. It occurs along both the east and west coasts. It grows in depths of 1–3 m, where the bottom is either muddy or a mixture of loose sand, gravel and broken shells. From March 1982, for a period of 1 year, 5436.5 tons of the clams was collected from Ashtamudi estuary. The collection was poor during March–May but increased from June onwards. The clams measured 20–60 mm with a dominance of 30–49 mm. December–February was reported to be the spawning period. From January to March the clam beds were rich in juveniles. The meat was locally used as well as exported (Appukuttan et al. 1985). Nagabhushanam and Mane (1975) observed that K. opima spawned twice in a year (October and March) in the Kalbadevi estuary of Maharashtra. K. opima being primarily marine, when the temperature and salinity are optimal, the clams spawn (ibid.). The species showed faster growth in conditions of higher salinity. The growth rate recorded by (Rao 1951) was 22.5 mm (1 year); 31.5 mm (2 years); 40.5 mm (3 years). Ranade (1964) found that 8–34 ppt promoted rapid growth. In Ratnagiri Bay he observed a growth rate of 21 mm (1 year), 31 mm (2 years) and 42 mm (3 years). A more or less similar pattern was recorded by Kalyansundaram and Kasinathan (1983).
Kambley and Muley (2015) found that K. opima bred twice a year. The first spawning period was April–June, and the second one was October–December. In Ratnagiri, ova matured in March, and April witnessed most of the spawning. In August, clams attained maturatity, and in September almost all the clams were mature. In October, the mature clams showed evidence of a second spawning. More than temperature, salinity has been considered the important factor in initiating spawning in bivalves of tropical areas (India). During the lowest temperatures in winter, gametogenesis slowed down but was not entirely arrested. Along the Indian coast, the water temperature does not fall below the optimum requirements of many molluscs as in temperate waters, and the temperature is comparatively high throughout the year, except for few degrees’ decrease in winter.
Villorita cyprinoides (Grey): Kerala leads India in the production of clams, with estimated annual landings of about 66,000 tons in 2008–2009. The black clam Villorita cyprinoides contributed 45,000 tons, or about two-thirds of this total, with Vembanad lake alone contributing 25,000 tons (CMFRI Annual Report 2009). In Goa it supported a sizeable fishery with an annual gross landing of about 500 tons (Ansari et al. 1981). The clam occurs from brackish to nearly freshwater conditions: 3–16 ppt salinity is the range reported for the species (Suja and Mohamed 2010). This clam is said to burrow deep into the soil to escape adverse conditions when the salinity rises above 15 ppt during the summer months.
Nair (1975) observed in Vembanad lake clam sizes of 30 mm in the first year and 41 mm in the second year. The length range of V. cyprinoides in Netravathi was 15–35 mm (Rao and Rao 1985). Vembanad and Ashtamudi lakes were major production centres (Narasimham 1991). Of the landings of about 66,000 tons of clams in Kerala during 2008–2009, about 25,000 tons came from the Vembanad estuary alone, where almost 4000 fisherpersons were engaged in its harvest. The salinity in the estuary, from 0.3 ppt in the interior to 18 ppt towards the lower reaches, is ideal for Villorita. Black clams are found just below the surface of soft bottom sediments (Suja and Mohamed 2010). The first spawning from Goa was reported from July to September and the second spawning was during January–February. November and May were the months of the highest protein content, 58.7 per cent.
Anadara granosa (Linnaeus): The popular name ‘blood clam’ for Anadara granosa is due to its red-coloured flesh as haemoglobin is present in the blood. It prefers shallow waters (< 2 m depth) sheltered from strong wave action and is generally abundant in areas where more than 50 per cent of the sediment particles are < 0.125 mm (Narasimham 1985). It prefers sandy bottoms in the intertidal zone. The size ranges between 40 mm and 80 mm. The shells are white and are large, thick and heavy, bearing prominent sets of tubercles. In Kakinada Bay they measured 41 mm in 1 year and 71 mm in 5.6 years (Narasimham 1988). Once this species thrived in Mumbai estuaries, but its population has declined alarmingly (Sundaram and Deshmukh 2011). Having the lowest growth in lower salinities, it thrives in the salinity range of 13.69–34.40 ppt, hence its presence closer to the river-mouth. In Kakinada Bay it spawns throughout the year, with two to four reproductive cycles in a year (Narasimham 1988). Although it survives in lower salinities, it functions better in salinities above 23 ppt and more efficiently between 26 ppt and 31 ppt (Pathansali 1963; Broom 1985). In Aghanashini estuary its distribution is within a 1 km zone from the river mouth, showing that it cannot stand seasonal lower salinities of the mid- or upper estuary portions. The species could have been present in Sharavathi but for the hydroelectric projects upstream (Ramachandra et al. 2012).
Polymesoda erosa (Solander): The mud clam prefers mangrove habitat inhabiting the landward fringe in the thick mangrove forest. Its abundance in Avicennia zone was noted by Meehan (1982). Based on studies along central west coast of India Clemente (2007) noted that almost all clams were in the high tide region inside the Avicennia forest; the species attained high values of abundance and biomass in areas dominated by Avicenniacommunity. The root structure, the availability of microalgae, and the physical and chemical nature of the sediment surface where Avicennia grows are considered factors for the richness of this clam.It had high abundance in the mangrove forests of Chorao Island, Goa. (Ingole et al. 2002; Clemente 2007). It is a large sized clam possessing a massive shell, dark outside and white inside. Clemente (2007) measured the largest sample she collected from Chorao Island as 102 mm long, 98 mm wide and 54 mm in height; majority of the clams were 70 to 80 mm long. The length of clams she collected from Alvekodi creek of Kumta ranged between 37-92.9 mm. The mean density of settling post-larvae was 28 no.m-2.
The density of adult clams in the landward zone ranged from 7/m2 to 12/m2. The higher densities of juveniles observed at the low- and mid-tide levels were assumed to be due to frequent inundation, which allowed the young individuals to feed adequately and attain the critical sizes at which vulnerability to physical and biological constraints is substantially reduced, whereas at the high-tide levels, increased desiccation may account for the mortality of the settlers. From its preference for high intertidal regions of the mangrove forests, it was hypothesized that P. erosa has a high recruitment in the high tidal region and that the species actively selects this habitat. In its periodically exposed habitat it is subjected to desiccation, a wide range of salinities and starvation, being a filter feeder (Clemente and Ingole 2011). The high tide zone, with degraded or destroyed mangroves, will experience higher temperatures adverse to P. erosa. The clams need to maintain a sufficiently large volume of water inside the shell to create a watery environment for the survival of the body tissues during exposure (Seed 1968; Clemente 2007). Higher acidity in the mid-tide region compared with the high tide and low tide zones may be the reason for the lower presence. The acidic pH of the sediments also affects the clam by dissolution of the shell (Isaji 1995). Benthic diatoms constituted the main food of P. erosa. The gut content comprised phytoplankton species belonging to 13 diatom genera. The benthic diatoms Coscinodiscus and Navicula dominated the gut flora. Clams died in the freshwater condition after about 5–6 days. In fresh water, they closed their valves tightly. When the salinity was increased to 18 ppt, the clams began breathing through a partial opening, and at 30 ppt they functioned normally. No mortalities happened between 18 ppt and 30 ppt (Clemente 2007). How the species could survive the low salinity of the Sharavathi is a perplexing question. Morton and Morton (1983) stress that P. erosa has ‘extensive tolerance’ to low salinities, which may allow this species to survive in the mid- and upper eulittoral reaches of mangroves, where the interstitial and surface waters can be hypersaline. Eulittoral fringe rock pools may have variable salinity, ranging from 0 ppt to 100 ppt (Morrit and Williams 2000).
As regards reproduction, the gonad development of P. erosa begins in October in Chorao Island. Active maturation commenced in the month of January with advanced gametogenesis, and gametes matured by March–April. However, spawning began from June and lasted till early October, the major spawning happening during August–September, a time of food abundance (Clemente 2007). The spawning period in bivalves is related with high food levels rather than temperature, and as reported by Seed (1976), this synchronization favours the larval and post-larval development.
Perna viridis (Linnaeus): The green mussel is widely distributed in the Asia-Pacific region. This large mussel reaches 8–100 mm in length. The shell is deep greenish black in colour and is elongated and triangular with strong ligaments. It generally inhabits intertidal, subtidal and estuarine environments with high salinity. P. viridis attaches itself to hard substrata. Dense colonies can develop in optimal temperature and salinity conditions, sometimes with thousands of individuals per square metre. In estuarine habitats it occurs in salinities ranging from 18 ppt to 38 ppt and temperatures ranging from 11°C to 32°C (Global Invasive Species Database 2005). The salinity of the natural estuarine habitats of P. viridis usually ranges from 27 ppt to 33 ppt (Korringa 1976; Sivalingam 1977). AQUACOP and de Gaillande (1979) considered the optimum salinity for P. viridis to be 30 ppt. The meat is considered valuable for human consumption due to its high-quality protein and well-balanced nutritional composition. It has a good balance of all the essential amino acids (Saritha et al. 2015).
The green mussel tend to concentrate in its body heavy metals absorbed from seawater and therefore could be used as a bioindicator of heavy metal pollution in seawater (Putri et al. 2012). In tropical areas, however, as the environmental conditions remain relatively constant, the breeding periods remain consistent throughout the year. Juveniles may be able to attain maturity within 2–3 months and may live for 3 years. The population grows densely packed in suitable habitats. The population density is influenced by the availability of food, the environmental conditions and the presence of other species (Rajagopal et al. 2006). It is a very promising organism for culturing and management of natural populations in natural habitats as densities of up to 35,000 individual/m2 have been reported (Urian 2009). As regards utilization of mussels in Asia is concerned, India was considered the sole Asian country with a substantial mussel industry not based on cultured mussels. The estimated annual production of 3000 tons was landed by a traditional fishery exploiting natural stocks (Alagarswami et al. 1980). In 1950, the Philippines was one of the first countries outside Europe to explore the possibilities of intensive mussel culture. Thailand and New Zealand were considered two other countries notable for mussel culture (Vakily 1989). The number of countries with experimental mussel culture started increasing due to a broad interest in mussel culture in the Asian and Pacific region. Extraordinary growth performance, natural abundance, adaptability to new environments and fairly simple culture techniques make Perna an ideal candidate for culture (ibid.). Perna is found both in brackish estuaries and in open, though not very exposed, waters. The mussel attaches itself by means of byssal threads to a large variety of substrata, such as rocks, stones, piers, dead shells and even compact mud or sand (Macintosh 1982). Under natural conditions, of the greatest settlement of Perna viridis spat was reported to occur at shore levels where the spat remained submerged almost constantly (98 per cent submersion) (Vakily 1989). This was found to be true on observing Perna colonies at Kirubele, a rocky shore towards the mouth of the Aghanashini estuary, when comparing periodically exposed intertidal and the immediate subtidal habitats.
Vakily (1989) authored a very informative work on Perna culture which can be of great use especially in Karnataka, a state with great potential but yet to make any notable initiative in this regard. Perna cultureg could be carried out with relative ease compared with prawn culture, which has indeed harmed the estuarine ecology in many places of the state. Good water exchange is a necessary prerequisite for mass culture of Perna (Yap et al. 1979; Cheong and Lee 1984). It plays a crucial role in providing the mussel with food. Currents are important with respect to the distribution of the larvae and for controlling the build-up of pseudofaeces and silt in the culture area.
Crassostrea spp.: The oyster C. madrasensis (Preston) was widely distributed in the estuaries and backwaters of south-west India (Alagarswami and Narasimham 1973). In purely marine habitats its growth is stunted. The growth is faster in backwaters subjected to good tidal flows. In Karnataka, including Aghanashini estuary, the collection of this oyster is mainly from the wild. The irregular-shaped cell walls are usually longer. When a spat set is on flat surfaces and there is no crowding, a flat shape is attained by the oysters. Those growing on uneven areas have the shape of the niche to which they attach; overcrowding leads to oysters with highly twisted shells (Rao, K.S. 1987). In the Pulicat lake, oyster farming was started in the early 1920s, and though it helped meet the demand from Madras during the pre-war years, both demand and supply fell considerably subsequently (Alagarswami and Narasimham 1973).
In Mulki estuary, there was a major spawning activity from mid-April to June, followed by an inactive phase from mid-July to September. The inactive phase was synchronized mainly with the monsoon months. A minor spawning activity was observed towards the end of November (Stephen 1980). Joseph and Madhyastha (1984) found in a south-west Indian estuary an asexual phase from almost June to September, coinciding with the low salinity values of the south-west monsoon. December–January and April–May witnessed two spawning periods. Spawning took place with the increase in salinity, the maximum being 32 ppt.
Edibility value of bivalves: In most bivalves the protein level remains high except during the breeding season. In the Kajali and Kalbadevi estuaries of Ratnagiri, M. meretrix attained gonadial maturity from June to September; spawning happened between September and January, when the edibility of the clam declined. During April–October, the edibility value was highest, coinciding with the high protein–lipid content (Sawant and Mohite 2013). In Ashtamudi estuary, Appukuttan and Aravindan (1995) found for P. malabarica had high calorific values during the pre-monsoon period, which declined during the monsoon and the post-monsoon period due to the higher protein–lipid and lower carbohydrate levels in the pre-monsoon period. The lower salinity and the reproductive use of protein–lipids during the monsoon–post-monsoon lowered the calorific value. Mohite’s (2006) work in Ratnagiri estuaries on the same species supports this finding as the protein and lipid levels were higher during the period from February to May and June and the calorific values declined as the monsoon progressed, reducing considerably the percentage edibility. The energy storage was high during the period from February to May–June. In V. cyprinoides, November and May were the months of the highest protein content, 58.7 per cent. The carbohydrate level did not show much variation, with an average of 26.15 per cent. The lipid content also did not vary much, with an average value of 9.1 per cent. The maximum gain in body weight was between September and November and again in April–May (Ansari et al. 1981).
Production, standing stock and trade in bivalves: Clams at one time were considered more as locally important food items and were non-conventional in markets, having only limited demand and lower prices. The accounts of standing stocks, production rates, etc. are of a sketchy nature. James et al. (1972) observed in Dakshina Kannada district the presence of a large quantity of clams. Areas near the bar mouth were known to yield catches of about 10 kg/m2 compared with areas further up, which yielded only half the quantity. Exploitation of the clams in the estuaries was mostly carried out by women at low tide. Alagarswami and Meiyappan (1987) estimated that 10,000 tons was the total production of clams and oysters from Karnataka. This estimate, unfortunately, did not take into account the production from Aghanashini, or any other Uttara Kannada estuary, except Kali. Kerala was leading with 35,000 tons. The quantities from the rest of the states were not significant or data prevailed.
During 1979–1980 the estimated average production of clams per hectare in Gurpur estuary of Mangalore was 7.9 tons. The clam beds had a high intensity of clams. Mulky topped with a production rate of clams and oysters of 18 tons/ha. The density of clams (standing stock), mainly M. casta, was 11 kg/m2 in some beds. The overall production rate of clams was as high as17 tons/ha, and that of the oyster beds was 36 tons/ha. In Udyavara estuary of Udupi the production rate of clams was 12.7 tons/ha. The production rate of the C. madrasensis attached to a wharf towards the bar mouth was estimated at 30 tons/ha, although the total occupied area/habitat was only 0.8 ha. The oyster bed was unexploited due to poor demand and difficulty in harvesting. The standing stock of M. meretrix in May 1979 in Sita estuary of Udupi was 204 tons. C. madrasensis from a shallow habitat was about 23 tons/ha and the sizes ranged from 41 mm to 160 mm. The overall production of clams was 16 tons/ha in Kundapur estuary. The clams and oysters together occupied an estimated area of 101 ha, and the standing stock of clams and oysters in April 1979 was 1624 tons. A 3-ha oyster bed was stocked with 33 tons of oysters (Rao and Rao 1985).
The clam stocks of Karnataka were very under-exploited up to the 1980s. Rao and Rao (1985) found that against a standing stock of 1624 tons of clams and oysters in Kundapur estuary, during April 1979, the total landings were 450 tons only (375 tons of clams and 75 tons of oysters). The exploitation estimates for oysters were 100 tons from Mulki, 75 tons from Kundapur and 50 tons from Sita estuaries, totaling 225 tons against standing stocks of 244 tons, 383 tons and 91 tons respectively, amounting to only 33 per cent exploitation. As regards Uttara Kannada estuaries, Venkatapur estuary of Bhatkal was estimated in October 1979 to have a standing stock of 156 tons from 14 ha of clam and oyster beds. In Sharavathi estuary the clams and oysters were already on a decline due to dam-related salinity reduction. Nevertheless an estimate by Rao and Rao (1985) reported the clam and oyster beds covered 22 ha. As per an estimate in March 1980, the standing stock of Paphia malabarica was 136 tons in an 11 ha area and that of the oyster C. madrasenis was 533 tons, also from 11 ha (48.5 tons/ha of oysters was a high rate of natural production).
With rising demand and export potential, the exploitation/production of bivalves in India increased to an average 57,000 tons/year of clams for the period from 1995–1996 to 2004–2005 and that of oysters to 18,800 tons for the same period (Mohamed 2013). The author observed that the estimates for bivalve production were “mostly region specific, and therefore, the error of the estimates are likely to be big.” During this period the clam and oyster resources were under-utilized in Gujarat and Maharashtra, while in Kerala and Karnataka such resources were being exploited well. As bivalves have varied reproductive potential, these resource estimates have to be revalidated frequently. Shivshankar and Lakshmibai (2016) state that most estuaries to this day do not have any regular statistical data on yearly or at any other intervals on the standing stocks of food bivalves. The data available are more of a sporadic nature. In the Mulki estuary the standing stock of clams was placed at 17,813 tons, of which M. casta was 10,409 tons and P. malabarica 7404 tons.
Regarding the prices in the recent past, it is obvious that due to low demand the prices were abysmally low up to even a couple of decades ago. The price of the clams varied with size and season, but generally it ranged from Rs.0.20 to Rs.0.50 for a hundred clams (James et al. 1972). Alagarswami and Narasimham (1973) stated that at Karwar, Uttara Kannada’s headquartes, the price obtained was so low that 100 clams were sold for Rs.0.20 or less. Later, Rao and Rao (1985) reported the price per 100 clams of P. malabarica to be Rs.2.50, M. meretrix fetching Rs.2.00, V. cyprinoides Rs.0.75 and M. casta Rs.0.50.
Subsoil shell deposits: Gopal et al. (1976) and Venkatkumaran and Bhat (1978) estimated the subsoil lime shell deposits in Karnataka estuaries at 2,135,700 tons. Gopal et al. (1976) observed a complete absence of shell deposits in Netravathi, indicating poor clam resources in earlier periods. In the Kundapur estuary of Karnataka, Rao (1983) recorded that 20,436 tons was the average yearly extraction of molluscan shells during the period from 1975–1976 to 1981–1982. Rao et al. (1989) recorded the annual shell extraction of Uttara Kannada estuaries as Kalinadi (24,500 tons/year), Aghanashini (7600 tons/year), Sharavathi 100 tons/year) and Venktapur (100 tons/year). Dredging for subsoil deposits in the Kalinadi and Vembanad lake had damaged the habitat (Nayar et al. 1984; Achari 1988). Narasimham (1991) referred to similar habitat destruction when civil engineering works were taken up. He also recommended demarcation of an area for dredging the subsoil shells. The impact of shell mining for decades in portions of Aghanashini estuary has hampered the habitats of bivalves and, according to local bivalve collectors, has caused a precipitous and unprecedented fall in bivalve production over the last few years. After repeated protests, the matter was taken up with district authorities and a moratorium was imposed on shell mining in the estuary. This is not strictly adhered to, but the fishing communities are somewhat relieved as this summer (March–May 2017) good signs of recovery have been witnessed in bivalve beds and the products are getting fairly high prices in the market.
9.3 ECONOMIC VALUATION OF EDIBLE BIVALVES IN AGHANASHINI ESTUARY
Here we provide highlights of a study carried out by our team on the edible bivalves of the Aghanashini estuary of Uttara Kannada during between June 2006 and March 2007 (Boominanthan et al. 2008), the notable findings of which are inevitable for the completeness of the current project supported by GIZ, India. The findings, in the background of this chapter, are very helpful for developing a comprehensive management plan for the natural resources of the estuary, of which the bivalves are an integral part. Highlights of the report are furnished here.
Survey of bivalve-collecting villages: All bivalve-collecting villages were identified and mapped. Household surveys were undertaken in these villages to find out the number of persons (men and women) collecting bivalves. Estimates were done separately of the number of bivalve-collecting days, village-wise, to come out with the overall picture of number of working days spent in bivalve collection and the quantities collected. Collecting methods were also documented.
Studies on bivalve species: The bivalves, clams, mussels and oysters being harvested were identified and their habitats mapped (Figure 2).
Clams, mussels and oysters: Altogether nine taxa of edible bivalve were collected from the estuary. I. Clams: Paphia malabarica, Katelysia opima, Meretrix meretrix, M. casta, Villorita cyprinoides, Anadara granosa (Arca granosa), Polymesoda erosa. II. Oysters: Mainly Crassostrea spp. III. Mussel: Perna viridis. The biological and ecological aspects of these have been described already (Figures 3.1 to 3.9).
Simple processing: The collected bivalves are usually sorted by women, who also carry out the local trade. Empty shells are separated. A small portion of the catch may be boiled and the meat removed and dried for domestic use and trade. Bivalve shells are traditionally used for making lime for whitewashing and agricultural uses (liming the soil to control acidity, preparing Bordeaux mixture etc.) apart for various other industrial and trade uses. The empty shells in small scale are procured by small traders and local lime makers from bivalve collectors, whose scoops of soil from mudflats or estuary bottoms also yield empty shells of dead bivalves and of gastropods. The shells heaped in the backyards of households after removing the meat for food purposes make another notable source to meet local demands. The Uppar community of Kumta taluk are traditional lime makers, although few Christian families of Divigi on Aghanashini bank also made shell lime. Large scale shell extraction from the estuary, under the mining leases given by the government, mainly for industrial purposes, much destructive to the bivalve beds of the estuary, is a phenomenon of recent decades. However, of late, the government is seriously concerned about restricting or banning shell-minig in the estuaries.
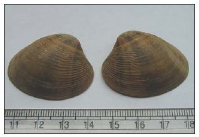
3.1Paphia malabarica |
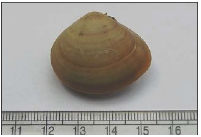
3.2 Katelysia opima |
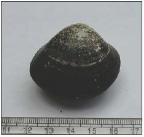
3.3Meretrix meretrix |
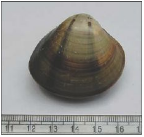
3.4 Meretrix casta |
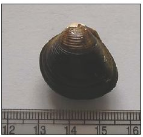
3.5 Villorita cyprinoides |
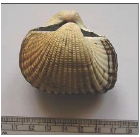
3.6 Anadara granosa |
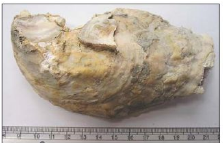
3.7Crassostrea sp. |
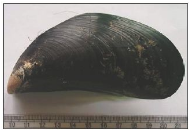
3.8 Perna viridis |
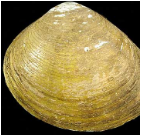
3.9 Polymesoda erosa |
Figure 3.1 to Figure 3.9. Edible bivalves of Aghanashini estuary
Villages of bivalve collectors: Altogether, people from 19 villages collected the bivalves from the estuary. An estimated 2347 persons were engaged in bivalve collection in the study period. Aghanashini, the village closer to the river mouth and nearer to the largest clam beds, had more bivalve collectors (825), followed by Divgi, upstream, with 440 persons. From Divigi, women go by rowing canoes to bivalve beds closer to Aghanashini village. They also collect the black clam Villorita cyprinoides in upstream areas, with less saline water, closer to their village. Gokarna had 227 bivalve collectors, Torke 184 and Mirjan 179 and so on.
Bivalve-collecting households and employment generation : Out of 9681 families of estuarine villages, 1202 (12.4 per cent) had members engaged in bivalve collection, at an average of almost two persons per family. Bivalve collection was carried out throughout the year.
Gender-wise division of bivalve collectors and quantities collected: Of the 2347 persons engaged in bivalve collection, 1738 were men, and 609 (26 per cent) were women. Bivalve collection being a non-specialized fishery with less risk, it may be considered the most important part of the coastal fishery generating employment for women. Except for the collection of Perna viridis , associated with steep rocky areas flanking the river mouth, women are involved in in the collection of most other bivalves. Women of more upstream villages, however, are expert swimmers, specialized in gathering the black clam Villorita cyprinoides by dipping themselves in several feet depth of water. The upstream areas of the estuary with less brackish water, the characteristic habitats for the black clam, are also localities subjected to sand extraction under licences. As sand mining pressures have increased in recent years the black clam habitats are threatened, and the women clam collectors of villages like Divgi, Manaki, Hegde, Mirjan etc. are put to increasing hardships, including risking their lives as they are required to plunge deeper in water to collect the bottom dwelling clams. The women play major role in sorting bivalves and in local vending, in which not even a single male takes part. Many women, even from non-fishing communities, collect bivalves for their families’ nutritional needs. Regarding the quantities of bivalves harvested, mainly the clams, the women, in general, collected these from the shallower parts of the estuary, where risks are lower. As such areas have fewer bivalves, the average collection by a woman was less than that of a man, which the study revealed as 65±24.78 kg/person/day for men and 22±13.46 kg/day/person for women.
Total harvests for the year: As the demand was high locally as well as from other towns and more from Goa state, the harvests were opportunistic and touched a total of 22,006 tons/year. A crash in production in subsequent years due to overharvests and maybe other reasons such as increased shell mining and sand mining, the latter especially in the upper regions, necessitated the evolution of a management mechanism for sustainable harvests. Details regarding markets were collected, and the prices prevailing at that time were noted to estimate the overall turnover from the bivalve trade.
THREATS AND PRESSURES
Until 50 years ago, bivalves were abundant on the Indian coast and within the purchasing power of even the poorest consumers. The situation began to change with various pressures operating along the coast, directly on the estuary, or upstream in the rivers. Mohamed and Sasikumar (2016) reported on the current alarming trends in the bivalve production scenario. The average edible bivalve annual production from 2009 to 2015 from the coastal states of Kerala, Karnataka, Andhra Pradesh, Tamil Nadu and Maharashtra was estimated at 1.03 lakh tons. This is a decline of 47 per cent compared with the period 1996–2000, when the production was 1.52 lakh tons. Indiscriminate exploitation of seed clams was seen in Kerala and Andhra Pradesh, where the clams were utilized in the lime shell industry. In Kakinada Bay, as the blood clam fishery had increased, even small-sized clams formed a major part of the landing. In the mussel fishery of Kerala, destruction of seed mussel was observed as discards. Except for regulations imposed on the pearl oyster fishery by the Government of Tamil Nadu, and management measures related to the short-neck clam fishery of Ashtamudi Lake (details follow), no regulations were in place on the bivalve fishery. Goa, which has considerable coastal and backwater resources and where the demand for bivalves for food was traditionally high, was one of the first to suffer depletion, prompting over-exploitation of bivalve resources especially in Karnataka and Kerala. Boominathan et al. (2008) reported that much of the collection from Aghanashini estuary was being transported to Goa.
The situation in the Periyar backwaters (Vembanad lake system) causing the decline of several bivalve species due to the construction of the Thanneermukkam barrage has been already referred to. Pollution by increased pH values due to coconut fibre retting and alteration of the sand bed due to sand mining were reported to affect the spat fall of M. casta in the Moorad and Chettuva estuaries of Kerala (Laxmilatha et al. 2006). The current scenario in the bivalve fishery along the south Indian west coast is reflected in Venkatesan et al. (2016). The drastic reduction of about 57 per cent in clam production from estuaries such as Kalinadi, Gangavalli, Aghanashini, Sharavathi, Venkatapur, Coondapur, Uppunda, Swarna-Sita, Udyavara, Mulki, Gurupur and Nethravathi in Karnataka during 2015 was mainly due to poor spat settlement during the post-monsoon months of 2014. Biomass surveys conducted during March–May and November 2015 in the shallow water clam beds in Aghanashini, Coondapur, Swarna-Sita, Udyavara, Mulki, Gurupur and Nethravathi estuaries also revealed natural mortalities of all clam species.
Ever since our report of 22,000 tons of harvests of commercial bivalves from the Aghanashini estuary (Boominathan et al. 2008), the market-driven exploitation went on unrelentingly. Combined with other pressures in the estuary like shell and sand mining, the bivalve beds started facing increased threats, a problem compounded by irregularity in the monsoon rains. Whereas an over 57 per cent reduction in clam production happened, affecting mainly South Indian west coast rivers, including massive deaths of clams (Venkatesan et al. 2016), Aghanashini, which had a prolific production all the while, was one of the worst affected. The crash in production necessitated sale of bivalves from Kundapur in the Kumta market at exorbitant prices. (During January–March 2017, Kundapur clams were sold in the Kumta market at Rs.200 for 100 pieces—an about 50-fold price rise in a matter of 35 years!) But for slow awareness creeping into the minds of people and the administration bringing in strong regulations regarding shell and sand mining, the Uttara Kannada situation would have gone the way of Goa as described in the following.
Warning signals from Goa: The situation in Goa was reported in the O Heraldo of 6 May 2007.
“As unknown pollutants have taken a heavy toll on the local variety of clams and mussels, especially in the Betul-Velim coast of River Sal, the void over demand and supply of shell fish is filled up by neighbouring Karwar and Kerala almost on a daily basis. Margao’s wholesale fish market is virtually flooded with bags of clams and mussels imported all the way from Kerala and Karwar,
Many a traditional Goan fisherman had to go without harvesting clams this year following destruction of the shell fish in the rich natural habitat at Betul. Imported clams and mussels are in big demand at the fish market. Clams are being sold in bags and sacks, while mussels are available in the price range of Rs.300–350 for 100 pieces.”
Suryakant Naik, a wholesaler in Margao stated, “Importing clams and mussels from across the border is not new; however, the import has grown over the years with the local production falling drastically in recent time. We do not know the causes behind the scarcity of the local variety of shell fish, but pollution of the river may be the prime cause behind the destruction of marine resources.”
Benjamin D’Silva, the MLA of Belim reflected, “Local fishermen from the Velim-Betul belt has been hit this year because of the large scale death of clams. They would have earned handsome income from harvesting of clams, but in vain. Pollution may be the prime reason behind the destruction.”
The famine of clams continues to haunt Goa unrelieved. Manju Lakshmi, N., scientist with the Fishing Resources Management Division of ICAR, observed that “There was no mussel spat available last year ( 2013 ).” She attributed the problem to “factors like pollution, climate change and sand mining, which have resulted in the dwindling number of mussel, found in the state’s estuarine waters.” She also commented that the shifting of monsoon patterns from its traditional calendar would have contributed to it (as reported in First Post 16 April 2014).
The Hindu reported on 21 May 2016:
“the Goa government…..launched an investigation into the mysterious death of a large number of clams, a well-known seafood delicacy, in a river near the capital. The investigation was launched after reports in media about the strange phenomenon of deaths of clams in Velim village…”
Environment Minister Alina Saldanha who ordered detailed investigation into the matter stated:
This mysterious episode will need detailed investigation to determine the true causes… According to preliminary investigation, the deaths could have been caused by a shell pathogen, shell fish toxin accumulated through filter feeding, stress induced mortality caused by hypoxia/anoxia or a very high biological oxygen demand in the lower water strata close to the sediments or salinity.”
Local fishermen have been claiming for over two months that most of the clams from clam beds in the area were found dead and decomposed with empty gaping shells.”
TOWARDS CONSERVATION AND SUSTAINABLE USE : One of the major bivalve resources, the short neck clam ( Paphia malabarica ) is well protected by the following regulations formulated by the Government of Kerala on the basis of recommendations made by CMFRI such as (a) ban on fishing activity during the breeding season from September to February, (b) use of gears of 30 mm mesh size to avoid exploitation of under-sized clams, (c) restriction of the grade of export of frozen clams meat to 1400/kg and above and (d) semi-culture or relaying of small clams by the fishers. Here the fishers are aware of the advantages derived by practicing the management measures, and they willingly stock seed clams obtained during fishing for further growth. The result is a well-balanced fishery that forms the livelihood of more than 5000 families. Similarly, the sea ranching of pearl oyster spat in the pearl beds has helped repopulate the stock to a certain extent. However, more effective measures are required to attain a productive level (Kripa and Appukuttan 2003).
The rising market demand for Kerala’s clams, especially from Southeast countries, and unregulated exploitation saw a steep decline in the clam production of Ashtamudi lake of south Kerala by the early 1990s. Due to the demand-driven clam fishery, the exploitation of the clams touched 10,000 tons in 1991 and crashed to 50 per cent of that by 1993, creating hardships to the community. The fishing communities approached the district administration with their problems, which in turn sought guidance from the CMFRI, Cochin. The WWF and the Kerala Fisheries Department also joined hands to find a solution. They together proposed many norms to be followed voluntarily by the fishers of especially the short-necked clam Paphia malabarica, the fishery of which about 5000 families were dependent on. As a first step, the Ashtamudi clam fishers formed the Village Clam Fishery Council to develop and implement management measures.The notable self-imposed regulations followed by the community are the following.
- A early closed season is being followed. The clam pickers at the initiative of the CMFRI adopted a 3-month closed season falling in the November–February period, synchronous with the recruitment of young clams into the shellfish beds.
- A mesh size restriction for nets was imposed. The mesh size of the fishing nets was restricted to >32 mm.
- A minimum standard size for export has been adopted. The clam meat count for export is not to exceed 1400/kg (whereas in unregulated export it went up to 3000/kg).
- Prohibition of mechanical fishing.
Because of the sustainable management practices adopted by the stakeholders, the Ashtamudi clam fishery became India’s first Marine Stewardship Council (MSC)-certified fishery in 2014. Transportation in large quantities started in 2015, and the clams were sold in markets extending from Kasaragod (north Kerala), bordering Karnataka, to Goa. Clam fishers who sell to these places get about Rs.200–260 per kg of whole clam, which is around 2.5–3 times more than local prices, and entire catches are now marketed to these states. The clams which are transported to Karnataka are relaid in estuaries at Kundapur. Relaying is done for a minimum period of 2 days, which may get extended, depending on the demand. Healthy clams get buried, while the stressed ones remain on the top of the relaid substratum. The estimated survival rate of the stressed clams collected from the top layer of the estuary was 38-48 per cent. The clams are repacked and sold in Goa and in the more distant markets of Ratnagiri and Mumbai at Rs.900–1000 per10 kg bag (42–47 clams per kg). Fishers from Ashtamudi Lake get Rs.20 per kg of whole clam, which is sold at a wholesale price of about Rs.95 per kg to the traders from Goa, Ratnagiri and Mumbai after it reaches Karnataka (Mohamed 2013; Appukuttan 2016).
AGHANASHINI: NEED FOR RAISING STANDARDS OF BIVALVE MANAGEMENT
Need for strict hygiene and pollution control: The bivalves are notorious for their propensity for accumulation of pathogenic bacteria, heavy metals and other pollutants as also biotoxic substances. Most of the regular shellfish-consuming countries have adopted strict standards of hygiene regarding the shellfish marketed. This awareness and regulatory measures are sorely lacking in India. Alagarswami and Meiyappan (1987) recommended depuration of shellfish before marketing. The depuration process is a purification process by which shellfish are held in tanks of clean seawater under conditions which maximize the natural filtering activity, which results in expulsion of intestinal contents, which enhances separation of the expelled contaminants from the bivalves. As such a process is highly desirable but difficult to implement in the set-up of Aghanashini, due to monitoring and logistic problems, it is very important that with Aghanashini being one of the highest potential centres for bivalve production, water pollution be prevented through the initiatives of local panchayats and the municipality of Kumta, as well as by the Pollution Control Board.
Community-based regulation of size classes of harvested clams: As different species of clam live for 2–5 years and exhibit growth throughout their lives, minimum species-specific harvestable sizes should be fixed by the bivalve collectors, in consultation with the CMFRI, and the norms arrived at adhered to. The juveniles and undersized clams should be left back in their habitats.
Forming bivalve collectors union: Sustainable harvests will materialize only when the bivalve collectors form an association. The membership of the association should be given to all the bivalve collectors, who are bound to adhere to the norms to be evolved. The Fisheries Department and the local-level Biodiversity Management Committees should take this as an important responsibility. The Ashtamudi model of management has to be introduced and practiced in the Aghanashini estuary under monitoring until sustainable production is achieved and good management practices systematized so that this fishery will also merit MSC certification. The community should be made aware of the importance of the MSC certification, which confers several advantages to the product, the ecolabelling of which enhances its tradability worldwide.
In conclusion it may be stated that the bivalves, because of their sessile and gregarious habit, high physiological adaptability, short food chains, prolonged breeding periods and fast growth rate, form the most ideal organisms for commercial cultivation on a large scale (Parulekar et al. 1984). Most kinds of edible molluscs were consumed at one time by poorer classes of people. The fishery of clams, mussels and oysters was of limited importance, more important locally. Hornell (1917), who was the Director of Fisheries of the Government of Madras Presidency, observed that “except in Malabar the utilization of shellfish properly so-called has comparatively little economic importance at the present moment in the Madras Presidency. Apart from the poorer classes of coast dwellers, shellfish as an article of food is generally despised, and except in the instance of oysters in Madras City, of mussels in Malabar, and squid in Ramnad district, none is ever seen exposed for sale in South Indian fish markets. When one remembers the important position occupied by various species of shellfish in the littoral fishing industries of other countries—Britain, France, the United States, and Japan are instances—this fact is much to be regretted, and it behoves the Fisheries Department to do everything possible to remove prejudice against the inclusion of shellfish in the general dietary of our towns and to increase the quantity and quality of those kinds which are both suitable from the food standpoint as well as susceptible by cultivation.” Today the situation has rapidly reversed and is facing deterioration due to the estuaries and coastal zones being overexploited and the bivalves turning into prime commodities for sale, even in the global market, yet grossly deficient in management. Karnataka’s estuaries can be brought under sustainable management norms through proper research, community education programmes and bringing various stakeholders under one roof for sustainable management of bivalves, achieving success in which will have overall spinoff benefits for estuarine and other coastal ecosystems.
9.4 MANGROVES OF AGHANASHINI ESTUARY
Before agricultural intervention, mangroves would have been widespread and dense, covering intertidal portions and water-stagnating marshes in the estuary of Aghanashini. With the introduction of agriculture, good portions of shallow estuarine areas were reclaimed by preparing earthen embankments to protect such areas for raising salinity-tolerant rice, mainly the Kagga, tall, and flood-tolerant with bold, long, awned grains. Two strains are found, the dark and the light, popularly called black Kagga and white Kagga. Obviously, mangroves had to be cleared for the creation of the estuarine rice fields locally called gaznis. The rice was grown during the rainy season, when the fields get flooded and salinity levels decline substantially. The farmers also adopted the practice of planting rows of mangrove trees, just outside the earthen bund which they built to safeguard the fields from salt water inundation as well as from river flooding. There were rows of mangroves along the estuarine side of the bunds, the latter fitted with sluice gates for entry of water or for drainage of the fields according to the needs of rice cultivation or for fishery purposes after the harvest of rice. The dense network of mangroves obviously fortified the earthen embankments from erosion.
Mangroves were also retained in many parts of the estuary, including mangrove sacred groves, where the local communities worship to this day. This traditional system of estuarine cultivation with mangrove planting was a sustainable system of rice cultivation, followed by fisheries in the flooded and nutrient-rich fields. This system suffered a severe setback with the replacement of earthen embankments for gazni fields with permanent stone bunds, beginning in the 1960s, built by the Government of Karnataka (then Mysore State). As these permanent bunds are stronger, the farmers felt no need to fortify them any further by planting mangroves alongside. On the contrary, in many places the existing mangroves were cut down for domestic use.
The retention of mangroves and marsh vegetation in the estuary declined with the introduction and promotion of prawn farms, an export-oriented drive of the government, implemented in this estuary from the early 1980s. The creation of prawn farms required the removal every other kind of plant, not just mangroves but also sedges and grasses. While making bunds around the prawn farms, most of the mangroves which existed along the layouts were decimated.
A realization of the importance of the mangrove vegetation dawned during the late 1980s, and the government, the Indian Institute of Science and NGOs like Snehakunja, Honavar, entered the arena to spread awareness about mangroves and attempt planting in sample plots in the Aghanashini estuary. But it was through systematic programmes of mangrove planting by the forest department, beginning in the late 1990s, that estuaries started turning greener with mangroves. The formation of village forest committees in estuarine villages promoted the people’s involvement, and better protection was afforded to the mangroves.
A note on the study: Much work on the mangroves of Aghanashini was done before the current project was sanctioned by GIZ India and the findings and recommendations submitted to the Honavar Forest Division of Karnataka Forest Department (Chandran et al. 2012). Therefore we have presented here mostly the salient features of the report which we have already submitted to the Karnataka Forest Department. However, as mangroves are an integral part of tropical estuaries, performing vital roles in estuarine and coastal ecosystems, we have made additional efforts here to present mangroves from a management perspective.
The main objectives of this chapter are:
- To inventory the mangroves of Aghanashini estuary and to assign the mangrove species to different salinity zones, viz. high, medium and low.
- To inventory the mangrove-associated flowering plants.
- To estimate the area under mangrove vegetation patches and to estimate the extent of the areas suitable for planting mangroves with recommendations of appropriate species.
- To bring out the role of mangroves in estuarine and coastal ecology.
- To present a perspective for management of mangroves in the future.
MATERIALS AND METHODS
The estuarine area with mangrove areas and potential areas available for planting in the Aghanashini estuary were digitized using open source GIS software (QGIS). Google Earth and Bing Earth Tile images were used to depict the estuaries, mangrove areas and potential areas for planting. Mangrove areas were identified and mapped in the field using GPS readings and their areas estimated in hectares. The estuaries were gridded, and sample surveys were carried out in selected grids for mangrove species composition and tree density. The post-monsoon salinity of the estuarine water was measured and depicted on maps as high (>15 ppt), medium (5–15 ppt) and low (<5 ppt). The mangrove species composition in any specific grid was correlated with the salinity status of the grid. In general the mangrove species of the study region were classified as high- medium- and low-salinity mangroves. The GPS readings of mangrove tree species which covered a minimum 5 m × 5 m canopy area were recorded and the species-wise area under tree mangrove distribution was estimated using the 2010 IRS p6 L4 MX 5M data (5 m resolution), using remote sensing software (GRASS). Using images of the estuary during low tides and with the help of bathymetric maps, the areas suitable for mangrove planting were also estimated.
Aghanashini estuary mangrove areas and potential areas: Through field surveys using GPS and remote sensing data (Google Earth and IRS P6 MSS), we mapped mangroves covering 169 ha of the Aghanashini estuary. Altogether an estimated 733 ha area of the estuary would be suitable for planting mangroves. The total estuarine spread, including private holdings, is 4941 ha.
Mangroves in relation to salinity: Mangroves have different salinity level preferences. During the rainy season, all mangroves can survive extremely low salinities approaching almost the levels of freshwater conditions. It is the dry season salinity that is decisive for the mangrove distribution within an estuary. The estuarine salinity in the natural state is between that of seawater (normally 35 ppt) and fresh water (< 0.5 ppt). The salinity keeps fluctuating with tides and seasons. Under normal conditions the salinity increases towards the river mouth, approaching nearly seawater salinity and decreases progressively in upstream areas where the river water meets the salt water tides. Mangroves, broadly can be classified as high salinity (> 15 ppt)-tolerant, medium salinity (5–15 ppt)-tolerant and low salinity (< 5 ppt)-tolerant. The details of such mangroves present in the Aghanashini estuary are given in Table 1.
Table 1. Mangrove species in relation to different salinity ranges
|
Mangrove Species |
> 15 ppt (high) |
5–15 ppt (medium) |
< 5 ppt (low) |
|
Acanthus ilicifolius |
+ |
+ |
+ |
|
Acrostichum aureum |
|
|
+ |
|
Aegiceras corniculatum |
|
+ |
|
|
Avicennia marina |
+ |
|
|
|
Avicennia officinalis |
+ |
+ |
|
|
Excoecaria agallocha |
+ |
+ |
|
|
Kandelia candel |
+ |
+ |
|
|
Rhizophora apiculata |
+ |
|
|
|
Rhizophora mucronata |
+ |
+ |
|
|
Sonneratia alba |
+ |
+ |
|
|
Sonneratia caseolaris |
|
+ |
+ |
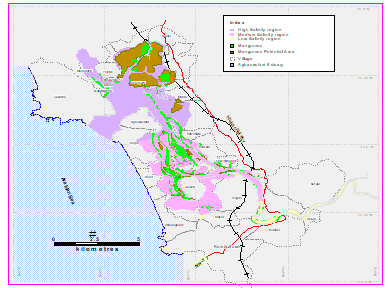
Figure 1. Aghanashini estuary showing mangrove patches, in relation to salinity zones and potential area estimated for planting
Mangrove areas and potential areas for planting: In the Aghanashini estuary we carried out the exercise of mapping area under mangroves and also estimating potential areas for planting. Altogether 119.36 ha area was found under the mangroves and 733 ha estimated as suitable for planting (Chandran et al., (2012). As under the relatively higher degree of protection given to the mangroves following the Coastal Regulation Zone Notification-1991, of the Government of India, and intensification of afforestation programmes thereafter natural growth of mangroves also is happening in the blank areas so that it is not critical that all the potential area needs to brought under afforestation. Mangrove patches in relation to high-, medium- and low- salinity zones and potential areas for mangrove planting are shown in Figure 1. Details of village-wise areas under mangroves and the potential area for mangrove planting are shown in Table 2. Masurkurve, with 32 ha, and Hiregutti, with 23 ha, have the highest area under mangroves. Hiregutti has 151 ha of suitable area for mangrove planting, followed by Madanageri, with 128 ha. Details of mangrove areas under high, medium and low salinity and areas available for planting are given in Table 3. With more careful afforestation using multiple species and proper management Aghanashini estuary could be developed as one of the finest mangrove areas of Karnataka. Details of the salinity zone-wise recommended mangroves are given in Table 4. Evaluating the site suitability, we have also listed mangrove associates for planting (Table 5).
Table 2. Village-wise area under mangroves and potential area for mangrove planting in Aghanashini estuary
| S. N. | Village | Mangrove Area (ha) | Potential Area for Planting (ha) |
| 1 | Aghanashini | 0.41 | |
| 2 | Aigalkurve | 1.29 | 1.21 |
| 3 | Antravalli | 1.08 | |
| 4 | Baad | 6.47 | 6.28 |
| 5 | Balale | 0.04 | 8.92 |
| 6 | Bargigazani | 5.96 | 24.99 |
| 7 | Betkuli | 0.35 | 12.17 |
| 8 | Chatrakurve | 1.18 | 2.49 |
| 9 | Divgi | 1.39 | |
| 10 | Gudeangadi | 0.94 | 1.71 |
| 11 | Halkar | 1.85 | |
| 12 | Hegde | 4.36 | 1.59 |
| 13 | Hiregutti | 22.80 | 151.07 |
| 14 | Hittalmakki | 1.20 | 90.60 |
| 15 | Hubbangeri | 0.65 | 0.68 |
| 16 | Kagal | 4.66 | |
| 17 | Karkimakki | 0.06 | |
| 18 | Kelagistala | 4.10 | |
| 19 | Keppekurve | 12.31 | 19.30 |
| 20 | Kodkani | 3.36 | 3.72 |
| 21 | Kumta | 0.29 | |
| 22 | Lukkeri | 8.63 | 17.37 |
| 23 | Madangeri | 6.94 | 128.04 |
| 24 | Manaki (r) | 0.03 | |
| 25 | Manikatta | 1.25 | |
| 26 | Masurkurve | 32.29 | 8.19 |
| 27 | Midlagazani | 2.15 | 106.98 |
| 28 | Mirjan | 1.57 | 0.83 |
| 29 | Morba | 4.48 | 54.70 |
| 30 | Nagerbail | 2.72 | |
| 31 | Naranapur | 3.86 | |
| 32 | Paduvani | 2.58 | |
| 33 | Pattubele | 19.33 | 13.05 |
| 34 | Savalkurve | 4.87 | 0.63 |
| 35 | Tannirhonda | 0.29 | 0.72 |
| 36 | Toregazani | 0.70 | |
| 37 | Torke | 1.03 | 11.48 |
| 38 | Yennemidi | 2.62 | 75.46 |
Table 3.Salinity status-wise mangrove area and potential area for planting in Aghanashini estuary
| Salinity Level | Mangrove Area (ha) | Potential Area (ha) | Total Water Spread Area (ha) |
| High | 29.25 | 675.3 | 2794 |
| Medium | 88.91 | 57.2 | 1910 |
| Low | 1.2 | 0 | 236.7 |
| Total | 119.36 | 732.5 | 4940.7 |
Table 4. Mangroves recommended for planting in potential areas
| S. N. | Mangrove Species | Salinity Zones | ||
| High | Medium | Low | ||
| 1 | Avicennia marina | √ | ||
| 2 | A. officinalis | √ | √ | |
| 3 | Excoecaria agallocha | √ | √ | |
| 4 | Kandelia candel | √ | √ | |
| 5 | Porteresia coarctata (grass) | √ | ||
| 6 | Rhizophora apiculata | √ | ||
| 7 | R. mucronata | √ | ||
| 8 | Sonneratia alba | √ | √ | |
| 9 | S. caseolaris | √ | ||
Table 5. Mangrove associates recommended for planting in suitable areas
| 1 | Acacia nilotica |
| 2 | Anthocephalus kadamba (for low-salinity edges only) |
| 3 | Barringtonia racemosa (for low-salinity edges only) |
| 4 | Calophyllum inophyllum |
| 5 | Dolichandrone spathacea |
| 6 | Erythrina indica |
| 7 | Ficus racemosa (low-salinity zone) |
| 8 | Pandanus fascicularis |
| 9 | Pongamia pinnata |
| 10 | Salvadora persica (high-salinity zone) |
| 11 | Thespesia populnea |
Site-wise presence of mangroves and associates: Mangroves and mangrove associates were studied in detail in about 18 sites. Their site-wise presence is given in Table 6. Of the tree mangroves, some of the most widespread are Rhizophora mucronata, Avicennia officinalis, Sonneratia alba and Excoecaria agallocha.
Table 6. Distribution of mangroves and associates at different study locations of Aghanashini
| S. N. | Name | Locations | |||||||||||||||||
| 1 | 2 | 3 | 4 | 5 | 6 | 7 | 8 | 9 | 10 | 11 | 12 | 13 | 14 | 15 | 16 | 17 | 18 | ||
|
|
True mangroves |
||||||||||||||||||
| 1 |
Acanthus ilicifolius |
√ | √ | √ | √ | √ | √ | √ | √ | √ | |||||||||
| 2 |
Acrostichum aureum |
√ | √ | √ | |||||||||||||||
| 3 |
Aegiceras corniculatum |
√ | √ | √ | |||||||||||||||
| 4 |
Avicennia marina |
√ | √ | ||||||||||||||||
| 5 |
A. officinalis |
√ | √ | √ | √ | √ | √ | √ | √ | √ | √ | √ | √ | ||||||
| 6 |
Excoecaria agallocha |
√ | √ | √ | √ | √ | √ | √ | √ | √ | √ | ||||||||
| 7 |
Kandelia candel |
√ | √ | √ | √ | √ | √ | √ | √ | √ | √ | √ | √ | ||||||
| 8 |
Porteresia coarctata |
√ | √ | ||||||||||||||||
| 9 |
Rhizophora apiculata |
√ | √ | √ | √ | √ | √ | √ | √ | ||||||||||
| 10 |
R. mucronata |
√ | √ | √ | √ | √ | √ | √ | √ | √ | √ | √ | √ | √ | |||||
| 11 |
Sonneratia caseolaris |
√ | √ | √ | |||||||||||||||
| 12 |
S. alba |
√ | √ | √ | √ | √ | √ | √ | √ | √ | √ | √ | |||||||
|
Mangrove associates |
|||||||||||||||||||
| 13 |
Acacia nilotica |
√ | |||||||||||||||||
| 14 |
Alstonia scholaris |
√ | |||||||||||||||||
| 15 |
Anthocephalus kadamba |
√ | |||||||||||||||||
| 16 |
Barringtonia racemosa |
√ | |||||||||||||||||
| 17 |
Caesalpinia crista |
√ | √ | √ | √ | √ | √ | √ | √ | √ | √ | √ | |||||||
| 18 |
Calophyllum inophyllum |
√ | √ | ||||||||||||||||
| 19 |
Canavalia cathartica |
√ | √ | ||||||||||||||||
| 20 |
Capparis spp. |
√ | √ | √ | |||||||||||||||
| 21 |
Clerodendrum inerme |
√ | √ | √ | √ | √ | √ | √ | √ | √ | √ | √ | √ | √ | √ | √ | √ | √ | √ |
| 22 |
Crateva religiosa |
√ | √ | ||||||||||||||||
| 23 |
Cynodon dactylon |
√ | √ | ||||||||||||||||
| 24 |
Cyperaceae spp. |
√ | √ | √ | |||||||||||||||
| 25 |
Cyperus malaccensis |
√ | √ | ||||||||||||||||
| 26 |
Derris scandens |
√ | √ | √ | |||||||||||||||
| 27 |
D. trifoliata |
√ | √ | √ | √ | √ | √ | √ | √ | √ | √ | ||||||||
| 28 |
Diospyros malabarica |
√ | |||||||||||||||||
| 29 |
Dolichandrone spathacea |
√ | √ | ||||||||||||||||
| 30 |
Erythrina variegata |
√ | √ | √ | √ | √ | √ | √ | |||||||||||
| 31 |
Ficus arnottiana |
√ | √ | ||||||||||||||||
| 32 |
F. racemosa |
√ | √ | ||||||||||||||||
| 33 |
Flacourtia sepiaria |
√ | |||||||||||||||||
| 34 |
Ipomoea sp. |
√ | √ | ||||||||||||||||
| 35 |
Morinda citrifolia |
√ | |||||||||||||||||
| 36 |
Odina wodier |
√ | √ | √ | √ | ||||||||||||||
| 37 |
Pandanus fascicularis |
√ | √ | √ | |||||||||||||||
| 38 |
Phyllanthus reticulata |
√ | √ | √ | |||||||||||||||
| 39 |
Pongamia pinnata |
√ | √ | √ | √ | √ | |||||||||||||
| 40 |
Premna corymbosa |
√ | √ | ||||||||||||||||
| 41 |
Salvadora persica |
√ | √ | √ | √ | √ | |||||||||||||
| 42 |
Sapium insigne |
√ | √ | ||||||||||||||||
| 43 |
Vitex negundo |
√ | √ | √ | |||||||||||||||
| 44 |
V. trifolia |
√ | |||||||||||||||||
| 45 | Zizyphus mauritiana | √ | |||||||||||||||||
1, Gudikoppa; 2, Tudibele (planted patch); 3, Masurkurve; 4, Jeshtapura; 5, Kekkinkodi; 6, Keppekurve; 7, Bargi-gazni; 8, Kimmani-kodi; 9, Kimmani; 10, Paduvani; 11, Aigalkurve; 12, Mudangi; 13, Hoskatta; 14, Nushikote; 15, Morba; 16, Mankon; 17, Karkimakki; 18, Manaki.
Localities studied for mangroves
Gudikoppa: Situated in Gudeangidi village, this locality, an uninhabited island, has a remnant patch of mangroves. The major part of the island is used for shrimp farming. We studied a linear mangrove patch using a belt transect of 50 m × 5 m. Alongside the natural patch were planted propagules, especially R. mucronata. R. apiculata rarely occurs. The natural patch has A. officinalis, R. mucronata, K. candel and S. alba in addition to the ubiquitous E. agallocha towards the bund. K. candel constitutes 28 per cent followed by A. officinalis (26 per cent), E. agallocha (17 per cent), R. mucronata (14 per cent) and S. alba, which formed the rest. Shallow water meadows of Karki fodder grass (Cynodon dactylon) are found. Villagers collect the grass for fodder. Among the mangrove associates are D. trifoliata, C. crista, Salvadora persica, Vitis trifolia and Capparis mooni.. The extrapolated stem density was 2720/ha, and the estimated basal area was 25.78 m²/ha. This is a fairly good patch of mangroves.
Tudibele: A good patch of mangroves raised about 10–12 years ago, mainly of R. mucronata (71 per cent), followed by others S. alba (16 per cent) and K. candel (13 per cent). The trees do not exceed 50 cm gbh. Though densely planted some gaps are found due to cutting by people for fuel. Regeneration in the shade is poor, but for saplings of K. candel sporadically. Natural regeneration of S. alba is good promising stock for the future. The estimated number of trees (10 cm gbh and above), was 4301/ha, although the basal area was merely 13.31 m²/ha.
Masurkurve: This is an uninhabited island with a temple, the deity of which is held in high veneration by the locals. A good patch of trees, dominated by A. officinalis, near the temple, is a rare instance of a sacred grove of mangroves. The trees are quite old and several birds congregate in the grove in the evenings. The spotted owlets live in the holes of some trees. Although no tree is cut here, dead wood is sometimes extracted only for use as fuel in the temple. In the mid-1980s, the Centre for Ecological Sciences of Indian Institute of Science had attempted mangrove afforestation at Masurkurve. Of the old natural growth in the sacred grove here A. officinalis forms 68 per cent, the largest having a gbh of 160 cm and about 12 m in height. R. mucronata constituted 18 per cent, K. candel (8 per cent) and S. alba (6 per cent). The sacred had has an estimated tree density of 678/ha and a basal area of 43.86 m²/ha, by far the highest for any mangrove patch in Aghanashini estuary. The island has some prawn farms which were formerly fields of Kagga rice.
Jeshtapura: Situated in Baad village, this is a continuity of the uninhabited Masurkurve. It is also also dotted with prawn farms. A natural strip of fringe mangroves was surveyed here using a belt transect of 50 m × 5 m. The dominant trees are R. mucronata and S. alba (37 per cent each), followed by A. officinalis (17 per cent), and the rest consists of K. candel. Acanthus ilicifolius occurs gregariously along the edges. E. agallocha is found along the raised edges. The mangrove associates are mainly D. trifoliata and C. crista. The estimated stem density (10 cm gbh and more) was 1840/ha, and the basal area estimated at 24.82 m²/ha.
Kekkinkodi: This is in continuation of Masurkurve island, towards downstream portion of estuary, in the jurisdiction of Hubbankeri village. The locality is rich in regenerating and planted mangroves. Regeneration is more since some of the prawn farms have been abandoned due to the losses suffered. R. mucronata planted 8 years ago is growing up well. S. alba grows naturally in all suitable localities. The others are K. candel, E. agallocha, Aegiceras corniculatum and A. officinalis. Some older trees of R. apiculata occur in the estuarine portion here favoured by higher salinity. The gazni bunds have bushes of the medicinal palnt Salvadora persica, a rare species in Uttara Kannada coastal zone.
Keppekurve: This is also part of Masurkurve island, further towards the sea. Among the mangroves fringing the river are R. apiculata, R. mucronata, E. agallocha, A. corniculatum, K. candel and A. ilicifolius. There are several trees of A. marina as well as R. apiculata, both indicators of higher salinity. Of the notable mangrove associates are the tree Morinda citrifolia and S. persica.
Bargi-gazni: Part of a small island known as Chowlikurve (falling within Kimmani village of Hiregutti Forest Range), it has very densely planted saplings of particularly Rhizophora. The number approaches almost 8/m², making almost 80,000/ha of planted area. The officer in charge stated that such dense planting was attempted, throughout his jurisdiction, due to the following reasons.
The casualties were heavy in previous plantings due to: (1) Lack of awareness about the importance of mangroves among the locals, who considered them more as a hindrance to boat landing and casting of nets. However, they are developing a more positive attitude towards mangroves. (2) Many did not associate mangroves with fish productivity; however, this attitude also is changing due to greater awareness. (3) Buffaloes were found to feed on the foliage, and the damage was found to be greater in saplings. (4) The barbed wires used for protecting the planted patches hardly last more than 2–3 months due to the corroding influence of salt water.
The vigilance of the forest watch and ward staff facilitated a high percentage of survival. It will be of interest to monitor constantly the growth patterns and overall impact on the ecosystem of these dense patches of upcoming mangroves all over the estuary, In the rest of Bargi-gazni, the mangroves are R. apiculata (several trees), R. mucronata, S. alba, A. officinalis, E. agallocha, A. ilicifolius, etc. Bargi-gazni has a mangrove nursery in which many species were raised.
Kimmani-kodi: This is a narrow natural tidal channel passing alongside the swampy Savalkurve, along which occur natural mangroves and densely planted and protected linear strips of mangrove saplings. R. apiculata is notable among the natural mangroves. Most of the planted propagules are R. mucronata. Occasionally found are S. alba.
Kimmani: Here natural growth of R. apiculata is found in addition to S. alba, A. officinalis, E. agallocha, etc. Some mangroves were raised here over a decade ago by Ibrahim Upparkar, a farmer and aqua-culturist, to protect his gazni from breaching. He set an example of how farmers could take the lead role in mangrove afforestation, an activity that needs encouragement from the state.
Paduvani: Fringing the gazni bund were natural populations of R. apiculata and S. alba. Densely planted mangroves were noticed near Chowlikurve. Pongamia pinnata, Alstonia scholaris, Erythrina variegata, Odina wodier and C. crista are the mangrove associates.
Aigalkurve: This is a densely populated island having a poor growth of fringe mangroves alongside. Occasional individuals of A. officinalis, K. candel and R. mucronata were found. The open shallow waters have meadows of the grass P. coarctata.
Mudangi: This locality, close to the saltpans of Sanikatta and alongside the road to Tadri, is notable for old mangrove trees. The trees are of R. mucronata, R. apiculata, A. officinalis, A. marina, K. candel and S. alba. E. agallocha, A. corniculatum and A. ilicifolius were the other mangroves. The non-mangroves had good diversity due to the habitat heterogeneity brought in by the steeply rising hill alongside. Notable were Premna corymbosa, Ficus arnottiana, Odina wodier, Capparis mooni, Ipomoea sp., Phoenix sp.and D. trifoliata. Shell mining and transportation caused disturbances in the habitat.
Hoskatta: This locality seems to have had good mangrove growth in the past. Due to the saltpans and shell mining and transportation, the mangrove habitat is qualitatively altered. Instead of soft mud, the soil has been overlaid with shell fragments and other rough particles. The mangroves here did not show any regeneration. Old trees of R. mucronata were found here. In shallow marshes cut off by roads there were A. officinalis and A. ilicifolius.
Nushikotte: The shallow backwaters of this locality were used for salt manufacture by Ballarpur Industries at Binaga, and subsequently salt production was abandoned. In this barren expanse of water the Forest Department, had been raising mangroves extensively and with protection for the last 15 years. In the coming years there is everylikelihood of this locality getting transformed into a biodiverse and productive mangrove ecosystem. A thing of great note is several-fold increase in the production of the mud crab Scylla serrata creating a lucrative crab fishery for hundreds of fishers and farmers, the latter having lost their erstwhile Kagga rice fields for salt production by the industry. More about crab fishery has been dealt with in the Chapter related to decapods.
Moraba: Fringe mangroves in low density occur here. The notable species were A. officinalis, S. alba and A. ilicifolius. E. agallocha grows well on the bunds. Well-spaced planted saplings of R. mucronata and K. candel were also found. The mangrove associates noted were C. crista, Derris scandens, D. trifoliata, S. persica, Acacia farnesiana, Zizyphus mauritiana, Capparis spp., etc.
Mankon: In this locality, towards the east of the National Highway bridge, the river is narrower and the salinity lower. The increased mixing of fresh water makes this place less suitable for true mangroves. Mangroves with greater tolerance of fresh water, like S. caseolaris and K. candel, occur in such places. The fern A. aureum has a healthy presence alongside the river below the lush greenery of household gardens. We came across newer mangrove associates of lesser brackish areas such as Crateva religiosa, Diospyros malabarica and Anthocephalus kadamba grow here in addition to the usual ones such as Pongamia pinnata, Pandanus fascicularis, C. crista and F. racemosa.Cyperus malaccensis is common along shallow edges. There is not much scope for raising mangroves here due to the narrowness of the river.
Karkimakki: This is also an upstream station with lower salinity and the only mangroves are occasional K. candel and S. caseolaris along with the fern A. aureum. The mangrove associates found are as in Mankon. Additionally, Barringtonia racemosa also is notable noted. Cynodon dactylon grows underwater at shallow depths.
Manaki: This is an upstream village on the south bank of the river. Mangroves form fringe vegetation, notable species being A. ilicifolius, A. offcinalis, S. caseolaris, E. agallocha and K. candel.
Spatial mapping of mangroves in Aghanashini using remote sensing: Using RS data from 2410 IRS p6L4 MX5 M, we could estimate the area under the three dominant tree mangroves, namely Avicennia officinalis, Rhizophora mucronata and Sonneratia alba along with other landscape/waterscape elements (Table 7). The interpreted imageries are given in Figures 2.and 3.1 to 3.4.
Table 7.Aghanashini estuary proper: area under individual tree mangroves (for three species only) and other landscape/waterscape elements as deciphered from 2410 IRS p6L4 MX5 M imagery
|
Category |
Area (ha) |
Percentage |
|
Rhizophora mucronata |
74.27 |
1.42 |
|
Sonneratia alba |
33.72 |
0.65 |
|
Avicennia officinalis |
5.40 |
0.11 |
|
Other vegetation |
857.46 |
16.37 |
|
Water |
3615.19 |
69.05 |
|
Open fields |
259.13 |
4.94 |
|
Bund |
390.83 |
7.46 |
|
Total area |
5236.00 |
|
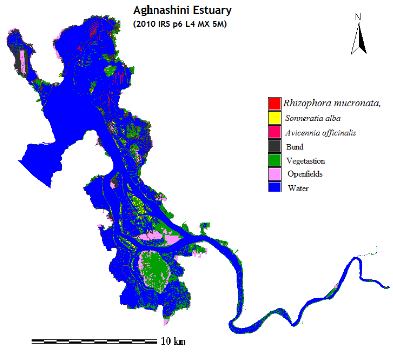
Figure 2. Aghanashini estuary proper, including islands, showing tree mangroves, bunds, other vegetation, fields and waterspread area (without the buffer zone)
Details of the area (in hectares) under vegetation, water and open fields/open areas, including the 1 km buffer zone, are provided in Table 6.8. Part of the increase in the area under vegetation in 2010, as compared to 1989 is due to an increase in mangroves. Details of the remote sensing data analysis for 1989, 2000, 2003 and 2010 for the major landscape/waterscape elements of Aghanashini estuary, including the 1 km buffer zone, are provided in Table 8.
Table 8. Remote sensing data analysis for 1989, 2000, 2003 and 2010 for major landscape/waterscape elements of Aghanashini estuary, including 1 km buffer zone
|
Year |
Vegetation |
Water |
Open fields/areas |
|||
|
Area (ha) |
Percentage |
Area (ha) |
Percentage |
Area (ha) |
Percentage |
|
|
1989 |
5675.238 |
40.79 |
2643.525 |
19 |
5595.85 |
40.22 |
|
2000 |
5483.632 |
39.41 |
2622.254 |
18.85 |
5808.728 |
41.75 |
|
2003 |
5435.506 |
39.06 |
3988.784 |
28.67 |
4490.323 |
32.27 |
|
2010 |
6250.39 |
44.92 |
3148 |
22.62 |
4516.21 |
32.46 |
|
Figure 3.1 |
Figure 3.2 |
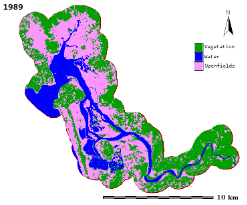
|
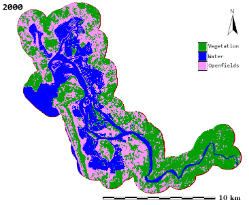
|
|
Figure 3.3 |
Figure 3.4 |
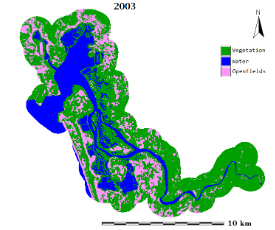
|
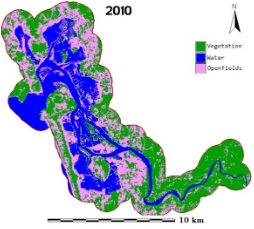
|
Figures 3.1 to 3.4. Remote sensing imagery showing area under vegetation, water and open fields/open areas in the Aghanashini estuarine belt (including 1 km buffer zone)
IDENTIFICATION OF MANGROVES: Most mangroves are woody plants, shrubs and trees. There are also a few herbs, mainly a grass. Among the woody plants one is a fern, namely Acrostichum aureum. This fern grows in colonies in swampy and marshy places where the tidal force is low and the salinity is not high. The important mangrove families and their members found in Aghanashini estuary are described here.
I. True mangroves
Family: Rhizophoraceae
This is the most important family of
mangroves. The members are usually
trees. The family displays spectacular
development of aerial stilt roots. These
roots spring from the main stem and even
from the branches. They branch
repeatedly and grow downwards and give
additional support to the tree in the
soft mud. The aerial roots, studded with
tiny air-passing windows the lenticels,
visible to the naked eye, also help with
aeration. The trees have opposite,
simple, dark green, leathery leaves. The
terminal bud is protected by a long
cover made up of stipules. These
stipules fall off when new leaves
emerge. The members of the family
produce from the fruits long, green,
cylindrical propagules. These on
maturity detach from the fruit and fall
vertically into the mud, where they
strike roots and become saplings or
might get transported by water, and
develop into saplings if the propagules
happen to get stuck to suitable
substratum.
Of the
Rhizophoraceae in the estuary,
Rhizophora mucronata is the
most dominant in the mangrove community.
R. apiculata, a relatively
small tree, is also present, more
towards the high-salinity river mouth
region. Kandelia candel,
another member of the family, is a
smaller tree, with oblong leaves
narrower than those of
Rhizophora. Flowers are white
and in dichotomously branched clusters
from leaf axils. The trees have flesh
coloured bases flattened into
buttresses. Stilt roots are closely
adpressed to the stem base. Bark reddish
brown, peeling off into flakes. Its
occurrence is more in mid-estuary and
upstream areas with lower
salinity.
Family: Sonneratiaceae
Buttresses absent; pneumatophores
(breathing roots) corky and soft, rising
vertically into the air from the mud.
Leaves opposite, simple; flowers large
with numerous free stamens.
Sonneratia alba, a species of small tree not exceeding 5
m. Many corky pneumatophores stick out
of the mud from all around the tree.
Leaves opposite, elliptic, oblong, blunt
at apex, narrowed at base. Flowers
2–3 together; calyx has a
cup-shaped base and 6–8 lobes
which are distinct in fruit. Petals
white, small; stamens numerous, free,
white; ovary depressed globose. Fruit
somewhat spherical, many seeded with
prominent, persistent, enlarged calyx.
Natural regeneration is plentiful,
especially in shallow places with low
tidal effects.
Sonneratia caseolaris consists of trees up to 12 m height.
Soft corky pneumatophores longer than
that of S. alba, reaching up to
1 m. characteristic.Young stem 4-angled.
Leaves almost without stalk, much
narrowed at base, opposite; leaf tip has
a pore known as hydathode through which
excess salt is secreted. Flowers reddish
purple, in singles at the tip of
branches; stamens numerous, reddish.
Fruits depressed globose. The species is
associated with low-salinity upstream
areas and can be found at Mankon,
Sirgunji and Uppinpattana villages.
Family: Avicenniaceae
Shrubs or trees without buttresses.
Breathing roots (pneumatophores)
numerous and protruding from the mud all
around the tree. Leaves opposite,
without stipules; flowers yellow. Fruit
one-seeded, dry when mature.
Avicennia marina
consists of small shrubs or small trees
up to 4 m high. Bark smooth yellowish
brown. Leaves 3–6 × 2-2.5
cm, elliptic oblong or ovate, narrowing
to an acute tip; leaf base rounded or
narrowing. Flowers small, stalkless,
yellowish, clustered towards tips of
floral axis; stamens not projecting out
from the corolla. Fruit at maturity
ovoid with a pointed tip, slightly
flattened. Dominantin in high-salinity
areas, especially in Hoskatta.
Avicennia officinalis is a larger tree of 8–10 m;
exceptional individuals of 12 m are
found in the sacred grove of Masurkurve
in Aghanashini. Tree with smooth whitish
grey bark has pneuatophores all around
sticking out from the mud. In addition,
masses of branching stilt roots hang
from the upper part of the trunk and
bases of large branches. Leaves
5–7.5 cm × 2.5–3.25
cm, ovate, oblong with more or less
rounded tips. Small, yellow stalkless
flowers seen in clusters towards the tip
of floral axis. Flowers distinguished
from A. marina by stamens seen
projecting outside the corolla.
It
is a commoner species in mangrove areas.
Family: Myrsinaceae
Plants without pneumatophores; flowers
with 4 sepals and 4 petals; and superior
ovary.
Aegiceras corniculatum: Shrubs or
small trees with slender stilt roots. In
Aghanashini mostly shrubby individuals
are found and the species is rarer too.
Leaves 4–8 cm × 2–4
cm, alternate, ovate-oblong or obovate,
may have a small notch at the blunt tip;
leaf base cone-like. Flowers small,
white, fragrant in umbellate bunches.
The fruits are 3–4 cm long and
curved with pointed tips.
Notes:
Found at edges and banks away from
strong tidal effects; notable for
fragrant white flowers.
Euphorbiaceae
Plants with latex. Male and female
flowers in separate clusters.
Excoecaria agallocha: Large shrubs or small trees occurring
along the edges of swamps, on bunds and
on wet soils. Acrid, blister-causing
latex present. Numerous serpentine roots
produced from base of stem. Leaves
alternate, margins entire or mostly
minutely toothed; leaves turn red before
being shed.
Acanthaceae
Family
of herbs and shrubs. Flowers not regular
in shape.
Acanthus ilicifolius:
A shrubby plant growing in colonies in
shallow parts of the swamp. Leaves
opposite, stiff, wavy and with sharp
spines along the margin. Flowers large,
blue, rich in nectar and a favoured host
for honeybees.
Poaceae
The
members are grasses. In the estuaries
these grasses are found often forming
meadows submerged during high tides and
exposed during low tides.
Porteresia coarctata: A stiff erect grass growing in
meadows in open shallow parts of the
estuaries, producing rice-like flowers
and caryopsis fruits.
II. Mangrove associates
Numerous species of plants occur in association with the mangroves. These are not obligate mangroves, and higher salinity levels are not often a prerequisite for their growth. They may also be often associated with inland habitats. These plants have a certain degree of salinity tolerance. They often grow along the margins of swamps or on estuarine bunds. Details of notable mangrove associates are found in Table 9.
Table 9. Details of notable mangrove associate species in Aghanashini estuary
|
S. N. |
Name |
Family |
Remarks |
|
1 |
Cerbera manghas (Kan: Cande) |
Apocynaceae |
Shrub or small tree with white latex and white flowers and mango-sized green fruits; old fruits fibrous, dispersed by water |
|
2 |
Barringtonia racemosa (Kan: Samudraphala) |
Barringtoniaceae |
Small to medium tree with 15–30 cm long leaves, and pink flowers in long hanging inflorescences |
|
3 |
Dolichandrone spathacea |
Bignoniaceae |
Tree close to coastal swamps with white fragrant flowers, and long bean-like compressed cylindrical pods |
|
4 |
Capparis spp. |
Capparidaceae |
Spiny climber on bunds |
|
5 |
Crateva religiosa |
Capparidaceae |
Small trees on the bank of Aghanashini near NH bridge; leaves 3-foliate; yellowish flowers with hard fruit; a rare species. |
|
6 |
Calophyllum inophyllum (Kan: Honne) |
Clusiaceae |
Large evergreen tree; white fragrant flowers and greenish yellow ripe fruits with a single seed. Seed oil used medicinally, applied as a protective cover for wooden canoes and boats; also source of biofuel |
|
7 |
Cyperus malaccensis |
Cyperaceae |
Tall sedge traditionally used for mat making |
|
8 |
Diospyros malabarica |
Ebenaceae |
Small evergreen tree with guava-sized gummy fruits; found also on banks of Aghanashini river in the interior areas |
|
9 |
Bridelia scandens |
Euphorbiaceae |
Climbing shrub with greenish yellow flowers and small bluish-black fruits |
|
10 |
Acacia farnesiana (Kan: Kasturijali) |
Fabaceae |
Thorny bush or small tree; leaves with minute leaflets; flowers yellow, fragrant; pod dull brown and inflated |
|
11 |
Acacia nilotica |
Fabaceae |
Small trees, rare on the coast; leaflets small; flowers golden yellow in globose heads |
|
12 |
Caesalpinia bonducella (Kan: Gajagakai) |
Fabaceae |
Climber with curved sharp prickles; compound leaves; yellow, fragrant flowers; dark brown dry pod 1–2 seeded. Seeds used for curing fever in local medicine |
|
13 |
Caesalpinia crista |
Fabaceae |
Large, woody climber climber; stem and leaves with sharp curved prickles; flowers fragrant, yellow; pod one-seeded |
|
14 |
Derris scandens (Kan: Handiballi) |
Fabaceae |
Woody climber with rosy flowers |
|
15 |
Derris trifoliata |
Fabaceae |
Woody climber common on the coast |
|
16 |
Erythrina variegata (Indian coral tree; Kan: Varjipe) |
Fabaceae |
Soft and fragile-wooded tree, branches covered with small black prickles; leaves with 3 foliage; coral coloured flowers |
|
17 |
Pongamia pinnata (Kan: Honge) |
Fabaceae |
Medium-sized tree with compressed pods, growing often near water courses, sea beaches and rarely on estuarine banks |
|
18 |
Prosopis juliflora |
Fabaceae |
Shrub or small trees with drought resistance |
|
19 |
Hibiscus tiliaceous |
Malvaceae |
Shrub or small tree with yellow flowers changing to pink in the evening |
|
20 |
Thespesia populnea (Kan: Hoovarase) |
Malvaceae |
A medium-sized coastal tree with heart-shaped leaves on long stalks and yellow flowers resembling cotton flowers |
|
21 |
Ficus racemosa (Kan: Atti) |
Moraceae |
Tree with milky latex and hollow, edible, fleshy false fruits |
|
22 |
Morinda citrifolia (Kan: Ainshe, Tagase) |
Rubiaceae |
Small tree with large leaves, dense heads of white flowers and glossy green fruit, white when ripe |
|
23 |
Pandanus fascicularis (Kan: Ketaki) |
Pandanaceae |
A palm-like but branched shrub with narrow, very long spinous leaves with small flowers on dense axis covered with white or light yellow, very fragrant bracts |
|
24 |
Cynodon dactylon |
Poaceae |
Grass, forming meadows in open shallow part of estuaries |
|
25 |
Sporobolus virginicus |
Poaceae |
Grass; perennial grass with good sand-binding properties |
|
26 |
Salvadora persica (Tooth-brush tree; Kan: Gonimara) |
Salvadoraceae |
Much branched shrub or small tree; rare along the bunds of Aghanashini; small round fruits dark red when ripe |
|
27 |
Clerodendrum inerme |
Verbenaceae |
Shrub with white flowers |
|
28 |
Odina wodier (Kan: Gojal) |
Verbenaceae |
Medium-sized deciduous tree with minute flowers in panicles and small, reddish, compressed fruits with one seed |
|
29 |
Premna corymbosa |
Verbenaceae |
Shrub |
|
30 |
Vitex negundo (Kan: Lakkigida; Nokki) |
Verbenaceae |
Shrubs, young stem 4-angled; aromatic; leaves 3–5 foliate; terminal leaflet longer |
|
32 |
Vitex trifolia |
Verbenaceae |
Shrubs, young stem 4-angled; leaves 3-foliate; leaflets without stalks |
DEVELOPING A MANAGEMENT PERSPECTIVE FOR MANGROVES OF AGHANASHINI
The mangrove community is benefitted by both erosion and deposition in the estuary of silt from upland and the nourishment which the marine tides bring. Mangroves are among the most productive terrestrial ecosystems and are a natural, renewable resource. However, the world’s mangroves are losing their habitats as rivers are dammed, their waters diverted and the intertidal zone extensively developed for agriculture or aquaculture and generally dried up. The mangroves are also exposed to other anthropogenic pressures from the densely populated coast (FAO 1994). The crucial role of mangroves in coastal protection, in moderating monsoonal tidal floods, ecosystem function and economic benefits to humans is not yet fully appreciated.
A heavily detritus-dependent ecosystem: From a mangrove-dominated ecosystem in the North River estuary of the Gulf of Mexico, Odum and Heald (1975) highlighted the significant role of vascular plant detritus in the trophic system. Examining the gut contents of 120 faunal species showed that roughly one-third were detritus consumers, defined as organisms whose digestive tract contents had at least 20 per cent vascular plant detritus on an annual basis. The consumers of detritus included herbivorous and omnivorous species of crustaceans, molluscs, insect larvae, nematodes, polychaetes and fishes. They appeared capable of digesting algae, vascular plant detritus, micro-organisms and dissolved substances sorbed on inorganic particles. Ansari and Parulekar (1998) found meiobenthic communities tending to dominate the top 2 cm of the sediment layer in a Goa estuary, mainly due to the availability of food in the form of detritus. The role of meiobenthic organisms in scavenging detrital particles, supporting thereby a detritus-based food chain has been made clear by Kulkarni et al. (2003). In the Hooghly–Matla estuarine complex of the Sundarban, Roy et al. (2012) estimated that almost 70 per cent of the detritus formed in the soil was being washed in the estuarine water to act as a source or sink of nutrients for the primary producers of the aquatic food chain. A large flux of mangrove detritus to the coastal ocean can have significant effects on aquatic food webs (Odum and Heald 1975).
Decomposition and subsequent remineralization of mangrove detritus is important in nutrient dynamics within the mangrove forest as well as in the offshore system, creating typical interdependences. Plant materials get converted into detritus and excreta of herbivores, which in turn become the substrate for the rich bacterial flora and subsequently pass through the bodies of detritus feeders (shellfish and other invertebrates), primary (small) carnivores and secondary and higher (large) carnivores (Saenger et al. 1983; Roy et al. 2012). For a stand of Rhizophora in southern Thailand, Christensen (1978) estimated 10 tons of plant production that is ultimately not used by man (twigs, leaves, fruit, etc., excluding wood). The production per square metre of mangrove forest is roughly five times the phytoplankton productivity of the same area of the coastal zone without mangroves. From these mangrove estuaries, a large net export of detrital material to the food chains of the continental shelf takes place.
The decay of mangrove litter begins with significant leaching of soluble organic substances. Newly fallen mangrove litter loses 20–40 per cent of its organic carbon when submerged in seawater for 10–14 days. The carbohydrates that leach out are mostly non-lignocellulose components. Tannins and other phenolics that are leached out make up about 18 per cent. Amino acids and sugars that are leached out of mangrove leaves are sources of nitrogen and carbon, respectively, for utilization by microbes. Nitrogen-fixing Azotobacter species increase the levels of nitrogen in the decomposing leaves. The nutrients released by mineralization are made available for primary production, which in turn supports a wide variety of consumers (Kathiresan 2014).
The resident herbivores, mainly invertebrates, play a major role in litter decomposition as leaves are returned to the system as finely shredded or partially digested faecal material. These fine materials provide increased surface area for colonization by microbes and are readily colonized by detritus-feeding organisms as microbial action enriches the nutritional value of the biomaterial. Leaf-eating sesarmid crabs play a major role in the mangrove ecosystem by breaking down mangrove litter into detritus-sized particles and thereby regulating the nutritive pathway in the mangrove environment. Microbial action is more in such crab-worked detrital materials. The sesarmid crabs also take mangrove leaves into their burrows for storage, where the decomposition continues. These crabs consume twice as much material as they actually assimilate, which effectively returns half of the materials they consume to the ecosystem as faecal material, making the same available for detritus food webs (Kathiresan 2014).
Krishnamurthy and Jeyaseelan (1981) found that the mangrove biota of Pichavaram in Tamil Nadu contained about 100 species of phytoplankton, 195 species of fish, 20 species of prawn, 20 species of crab and about 30 species of mollusc. They collected eggs of the fishes Glossogobius giurus, Arius falcarius, Arius subrostratus, Escualosa thoracata, Cynoglossus spp. and Caranx spp. from the Pichvaram mangroves. They also identified the larvae of 14 species of fish from the same mangrove areas. The fishes Terapon jarbua, Lutjanus johni, Drepane punctata, Scatophagus argus, Etroplus suratensis and Glossogobius giuris, the larvae of which occurred in Pichavaram, were recorded from Aghanashini estuary. A good number of the 77 species of fish recorded from Aghanashini (Bhat et al. 2014) had their juveniles in the estuary.
Detritus-based estuarine fish: According to Snedaker (1978), 90 per cent of marine fish pass some stages of their life cycle in mangrove habitats (where detritus-based food is abundant). Roy et al.’s (2012) Sundarban mangrove detritus study showed that a significant amount of detritus in the estuarine water was being readily consumed by a group of detritivorous fishes before being rematerialized completely into inorganic nutrient form. In the Pichvaram mangrove forests, of the 67 species of fishes recorded, 32 per cent were omnivores, of which 88 per cent consumed detritus as part of their food. Due to inadequate light penetration caused by the high amount of suspended matter, the plant growth (mainly algae and seaweeds) was not good, but there was “impressive” availability of prawn larvae and juveniles as well as other detritivores like nematodes, copepods and amphipods, which were important in the food chains of carnivorous fish, composing 45 per cent of the total fish species. The extensive prop root system of Rhizophora was helpful in protecting fishes from predators (Jeyaseelan and Krishnamurthy 1980). Prawns were abundant in the mangroves of Pichavaram. The carnivorous fishes feeding on these detritus-feeding prawns were also in great abundance (Krishnamurthy and Jeyaseelan 1981). The gut content of the white prawn Fenneropenaeus indicus and the tiger prawn Penaeus monodon from the Pichavaram mangroves had a load of 355 bacterial strains. The gut content of the golden mullet Lisa parsia, a mangrove fish which also fed on prawns, had a high bacterial load too (Thangamani and Rajendran 2016). Details of detritus-dependent fish and other organisms in the Aghanashini estuary, as compiled a literature review, are given in Table. 10.
Table10. Direct and indirect detritus dependence in the fishes of Aghanashini
|
Name of Fish |
Detritus Dependence |
Reference |
|
|
Direct Feeding |
Indirect Dependence (through Detritivore-Dependent Carnivory) |
||
|
Drepane punctata |
Omnivore with detritus |
|
Jeyaseelan and Krishnamurthy 1980 |
|
Gerres filamentosus |
Omnivore with detritus |
|
As above |
|
Gerres limbatus |
As above |
|
As above |
|
Liza parsia |
As above |
|
As above |
|
Scatophagus argus |
Detritus with carnivory |
|
Sivan and Radhakrishnan, 2011 |
|
Mugil spp. |
Completely detritivorous |
|
Ray and Strasˇkraba 2001 |
|
Mugil cephalus |
As above |
|
As above |
|
Arius arius |
|
Carnivorous on detritivores |
http://www.fishbase.org |
|
Arius caelatus |
|
As above |
As above |
|
Ambassis commersonii |
|
As above |
Jeyaseelan and Krishnamurthy 1980 |
|
Eleutheronema tetradactylum |
|
As above |
As above |
|
Lates calcarifer |
|
As above |
As above |
|
Lutjanus johni |
|
As above |
As above |
|
Secutor ruconius |
|
As above |
As above |
|
Sillago sihama |
|
As above |
As above |
|
Thryssa malabarica |
|
As above |
As above |
|
Thryssa mystax |
|
As above |
As above |
Other organisms dependent on mangroves: The prawns Penaeus and Metapenaeus, the mud crab Scylla serrata, the oyster Crassostrea madrasensis and the clam Polymesoda erosa are associated with mangrove swamps. Mangroves serve birds in different ways. Herons, storks, raptors and owls use them as nesting sites. Wintering Palaearctic waders use them as roosting sites after feeding in the tidal mudflats (Jayson 2001). According to the available information, 76 species of bird are known to occur in association with the mangroves of Kerala (ibid.). Pawar (2011) found 56 bird species associated with the mangroves of the Uran coast in Raigad district of Maharashtra. The mudflats of the mangrove ecosystems are reported to play a significant role in the conservation of resident birds, migratory birds and endangered birds (ibid.). Chaudharai-Pachpande and Pejaver (2016) recorded 95 species of bird from the mangrove creeks of Thane. Of these, 43 per cent were dependent on mudflats and another 43 per cent on mangroves, highlighting how the mangrove–mudflat system is very favourable for bird communities (more details can be found in a separate chapter on birds).
MANGROVE MANAGEMENT
The health of the coastal ecosystems of the tropics is strongly linked to the estuaries and particularly mangroves. A variety of basically marine organisms, notably economically important fishes, prawns and crabs, depend directly on mangroves, which support them in the early phases of their lives. For numerous bird species, especially migrant waders, mangrove-rich estuaries offer food and shelter, either during a good part of winter or as transit stations en route to their migratory flyways. These functions are in addition to their ecological roles as builders, consolidators and protectors of coastal plains, their roles in water purification through filtration and their attributed quality of protection of coastal life and property from cyclonic storms, and surges of the sea, etc. Mangroves support a huge community of directly or indirectly detritus-dependent organisms.
Despite such vital roles that mangroves have, they have been indiscriminately felled over the years for estuarine reclamation for various human needs, for industrial installations and ports, for aquaculture farms, for fuel and timber and so on. FAO (2008) estimated that nearly 150,000 ha of mangroves was lost each year. Silent deaths of mangroves can happen due to bunding of rivers on the coast for freshwater storage, with the mangroves trapped inside destined to die (eg. Kollur river in Udupi district), or due to upstream hydroelectric projects (as in Sharavathi river of Uttara Kannada, where only a few mangroves could survive), which wipe out almost all high-salinity habitat mangroves.
Qarto (2012) states that despite various mangrove restoration and rehabilitation programmes, very few organizations have so far dealt effectively with mangrove restoration, as only a few examples exist of successful, long-term mangrove rehabilitation, partly because most restoration attempts have not corrected the underlying problems responsible for mangrove loss. The great majority of mangrove restoration attempts are merely monocultures of Rhizophora, rather than restoring a biodiverse mangrove wetland, as monocultures have only limited potential for biodiversity. These plantations are less resilient to natural disasters, diseases or insect infestations. Also, the natural biodiversity and productivity of the original healthy mangrove forest is not achieved by this simple ‘gardening’ approach (Lewis 2009). Quarto (2012) attributes the many failures of widespread mangrove planting undertaken following the 2004 Indian Ocean tsunami to poor site selection, lack of understanding of mangrove ecology and hydrology, short project periods, a desire for quick results from donors, lack of community consultation and participation, relief agencies with no previous experience with mangroves, lack of follow-up and monitoring, and planting of mainly Rhizophora spp., regardless of whether this was appropriate for the selected site.
Jackson et al. (1995) consider ecological restoration an important “process of repairing damage caused by humans to the diversity and dynamics of indigenous ecosystems.” It differs from simple restoration in having four key steps: (1) judgement of need; (2) an ecological approach; (3) goal setting and objective evaluation of success in meeting those goals and (4) acknowledgement of limitations in our knowledge to complete the process. Ecological restoration of mangrove forests has received attention only very recently (Lewis 1999). Lewis (2001) considers that much of the research into mangrove restoration that has been carried out to date has been conducted without adequate site assessment, documentation of the methodologies or approaches used and the real costs of the work. Subsequent follow-up or evaluation for success in achieving these aims is essentially non-existent.
As regards mangrove restoration projects and efforts in the Aghanashini estuary, the bulk of the mangrove planting is based on a single species, Rhizophora mucronata. Other species are sparingly mixed, if at all, probably due to the relative ease with which Rhizophora can be raised by planting its long propagules and the good percentage of survival that can be expected, pleasing to the funding and monitoring agencies. We ourselves did such an evaluation survey for the Karnataka Forest Department in the Aghanashini estuary and got convinced that R. mucronata was planted with unjustifiable importance.
Ideally, while planting mangroves, we should think of the ecosystem and its valuation, which obviously necessitates monitoring and measuring using many parameters, as compiled by Spurgeon (1998), on the basis of valuations of benefits from mangrove plantings in various parts of the world. The benefits in principle to be considered are given in the following (benefits in monetary terms omitted here due to the limited scope of the current project undertaken in Aghanashini). We have added to Spurgeon’s list our own criteria as well, on the basis of ground surveys and interaction with the estuarine communities.
On-site sustainable fisheries: An evaluation of the prevailing fishery system in the mangrove proper and the immediate vicinity to be carried out periodically, as regards species caught, size class assignment, stage of capture (juvenile-subadult-adult), the gadgets used and recommendations to be made for sustainable harvests.
On-site crustacean and mollusc harvests: Crustacean harvests, especially of mud crabs (Scylla serrata) have been steadily increasing, mainly due to a greater area brought under mangrove plantations. Yet no statistics are available on the quantities caught, size classes, the number of people engaged in crabs capture, valuation and the quantity being sent to external markets, including foreign markets. As regards prawns, there is practically no appraisal of the species associated with mangrove areas.
On-site sustainable harvest of all products: Details of the quantities of all products together, including fodder, fuel, honey and all fishery products are to be obtained through periodical surveys.
Fish products: A survey needs to be conducted about the fish products made locally and in other places for commercial purposes so as to explore the applicability of Access and Benefit Sharing Notification, 2014 of the MoEFCC, Government of India for accountability and strengthening the cause of community-based monitoring and conservation.
Vicinity fish, shrimp, mollusc and crab harvests: Vicinity harvests of all these organisms, close to notable mangrove patches in different salinity zones to be studied, to differentiate the roles of such patches in fisheries, as nurseries/habitats for the respective organisms, supporting adult and sub-adult populations so as to facilitate the introduction of sustainability standards and responsible fishing.
Off-site fisheries (managed and open): Research has to be carried out on the nutrient flow from mangroves to zones within the estuary, and desirably to the sea, into gazni rice fields, including those under management and those which remain open for exploitation.
Contribution towards avian ecology: Although the birds of Aghanashini estuary have been listed, there is scanty information (except from secondary sources) on what they feed on in the estuary and towards which what contribution the mangroves make, in terms of kinds and quantities of food, the sites within the estuary where such food sources foster ecosystem functioning and the nesting/roosting/breeding sites which mangroves offer the birds.
Importance of participatory mangrove management: Before the introduction of aquaculture, mangrove planting by the side of the gazni rice fields, to strengthen the farmer-constructed earthen bunds, was a practice prevalent in the Aghanashini estuary. However, this practice diminished and waned away when the state government built permanent embankments with stones, fitted with sluice gates to regulate the water flow in and out of the fields. Not only that, as mangrove awareness was in a low state, it became a common practice to hack the remaining vegetation for fuel and minor timber requirements. Remediation of this alarming situation practically began in seriousness with the introduction of the Coastal Regulation Notification—1991 of MoEFCC, Government of India. This notification gave the highest importance to the protection of mangroves by providing mangroves an inviolable status under the CRZ-I category. Under different schemes the forest department started raising mangroves in the estuary. Awareness programmes on mangroves for the coastal communities were initiated in the 1980’s by the Centre for Ecological Sciences of the Indian Institute of Science and by especially an NGO, Snehakunja, based in Honavar, of Uttara Kannada. Through voluntary efforts some mangroves were also raised in the estuary. The NGO efforts were important in forming local-level Village Forest Committees to take care of mangroves. Yet, admittedly, none of the voluntary efforts had any continuity.
The forest department faces a difficult situation as it has no ownership of the estuary to execute unimpeded the mangrove planting and protection process. In fact, recently the department was even asked to discontinue mangrove planting in a large portion of potential mangrove habitat in Nushikotte village, the ownership of which is vested with Karnataka Industrial Area Development Board (KIADB), a government agency. By the time the order was served, through a period of over a decade, from early 2000, the forest department had already successfully conserved many good patches of mangroves in Nushikotte and elsewhere. Now that the Government of Karnataka is bent on executing an all-weather mega-port in the estuary, centred on Nushikotte village, if such a large project is executed, not just the well-restored mangrove vegetation but the entire estuarine ecology is destined to be disrupted seriously. The state government is expecting full clearance of the port project (Tadadi Port in Aghanashini estuary) by the MoEFCC shortly. This being the situation, it is needless to predict at this juncture what future Aghanashini estuary has, let alone the mangroves, which will face wholesale decimation in major parts of the estuary. The fate of the mangroves, which is so vital to the estuarine ecology and productivity, being uncertain, further recommendations in this report related to mangrove management will be infructuous.
9.5 CARBON SEQUESTRATION IN THE AGHANASHINI ESTUARY
Blue carbon is the ability of tidal wetlands and seagrass habitats to sequester, store or release carbon dioxide and other greenhouse gases. Seagrass beds, mangroves, saltmarshes, and other tidal wetlands—which capture atmospheric carbon and store it in the ground at rates 10 times greater than those of forests on a per-area basis are designated blue carbon ecosystems. In these blue carbon ecosystems, unlike forests, the carbon storage is primarily in the soils (rather than in the above-ground plant materials), where it can remain stored for centuries or more (Pidgeon 2009). Although coastal vegetated habitats occupy only 0.2 per cent of the ocean surface, it has been estimated that they account for approximately 50 per cent of the carbon burial in marine sediments, referred to as blue carbon (Donato et al. 2011; Duarte et al. 2013; Mcleod et al. 2011; Nelleman et al. 2009). As regards blue carbon studies, very often only topsoil samples are analysed, with a limited number of studies considering carbon storage in deeper horizons, although it has been recognized that these also store a significant amount of organic carbon (OC) (Elschot et al. 2016; Wang et al. 2011). Most studies only consider soil organic carbon (SOC) storage down to a depth of 0.3 m (Van de Broek et al. 2016).
Wetlands store significant amounts of soil carbon, 45–70 per cent of all terrestrial carbon according to Mitra et al. (2005). A significant fraction of coastal wetlands is occupied by tidal marshes. These are vegetated intertidal areas located along coastlines and estuaries in sub-Arctic to tropical climates. These are among the most productive ecosystems on Earth (Rocha and Goulden 2009). Despite this, the carbon dynamics in brackish-water and freshwater marshes is largely understudied. Moreover, most existing studies underestimate the total OC stocks due to shallow soil sampling, which also influences the reported patterns in OC storage along estuaries (Van de Broek et al. 2016). In all tidal marsh sediments the SOC concentration has a constant value from a certain depth below the surface downward. However, the authors found that SOC concentration decreases with increasing salinity, indicating that the amount of stabile SOC decreases from the upper estuary towards the coast (ibid.). Morrissey et al. (2014) attributed this phenomenon to a positive correlation between increasing salinity and microbial action on organic matter. A negative correlation of SOC with salinity was already observed by Craft (2007). Decreasing SOC stocks with increasing salinity were also found by Hatton et al. (1983); Wieski et al. (2010) etc. These findings have created the apprehension that rising sea levels submerging freshwater marshes and brackish water areas would enhance microbial action on organic debris, causing higher releases of carbon into the atmosphere. Whether wetlands continue to survive the sea-level rise depends largely on how human impacts interact with rapid sea-level rises and socio-economic factors that influence transgression into adjacent uplands (Kirwan and Megonigal 2013). As regards the sedimentation process in the intertidal wetlands, Fagherazzi et al. (2012) observed that the elevation of these wetlands increases as a consequence of the deposition of both mineral sediments and allochthonous organic matter (OM) during flooding events and by the incorporation of in situ-produced biomass (both above and below ground). Recently formed young tidal marshes, with a low elevation, receive more mineral sediments than do their higher counterparts, with sedimentation rates decreasing through time until the elevation of the marsh platform is in equilibrium with the local mean high water level (Temmerman et al. 2003).
MATERIALS AND METHODS:
Three of the several gazni rice fields of Aghanashini estuary, namely the Bridge (Lukkeri), Manikatta and Kagal gaznis, were chosen for the carbon study (Figure 1). The Bridge gazni (223.5 ha) is farthest from the river mouth, in a winding portion of a river channel that encircles Lukkeri island. Adjoining the Bridge gazni, ahead on the same channel of the river, is the Manikatta gazni (166 ha). Both these gaznis are in the medium-salinity zone of the estuary, where the summer salinity does not exceed 20 ppt in a normal rainfall year. The Kagal gazni (51 ha) is farthest, closer to the river mouth, where two main channels of the river meet, encircling small islands, and form the main channel that meets the Arabian Sea between Aghanashini village, on the south bank, and Tadadi village, on the north bank (Figure 2). Kagal gazni is more or less on the border of the high-salinity zone of the estuary, where the summer salinity exceeds 20 ppt and might approach 35 ppt in the peak dry months.
These gaznis are estuarine rice fields used for cultivation of the salinity-tolerant traditional Kagga variety of rice. The salinity of the soil varies with the season. It reaches the maximum between the months of January and May and decreases thereafter with the onset of the monsoon season. The south-west monsoon, beginning in June, brings in copious rainfall during the June–September period, the main time used for raising the Kagga rice in the gazni fields. By September end, while the monsoon is tapering off, the Kagga rice attains maturity and is harvested by mid-October to early November. The gazni rice fields are subjected to backwash from the sea, tidal waters, wind-borne salts and underground intrusion of seawater in subsoils (Amanullah et al. 2007).
The gaznis are flood-prone and water-logged lowland ecosystems subjected to seawater intrusion. They have seasonally varying salinity, which is lowest during the rainy season, June–September, and highest in the peak summer months of March–May. The Planning Commission of the Government of India (1981) estimated the extent of the gajni (gazni) lands along coastal Karnataka to be about 12,000 ha. The cultivation of rice begins from late June, depending on the receipt of sufficient rains from the south-west monsoon, which washes off much of the salt from the gazni rice fields. The gaznis are shallow intertidal portions adjoining the estuary, prepared for cultivation of rice during the monsoon period, when the salinity is lowest. Thereafter the gaznis are used for storing tidal water for growing fishes and crustaceans (mainly prawns). The gaznis are protected by embankments fitted with sluice gates for letting out water into the estuary during low tides and for taking in water during high tides. In the rainy season, fresh water is stocked for growing salinity-tolerant Kagga rice, and the water level is adjusted to favour the growth of seedlings.
Salinity-resistant Kari-Kagga (Kagga with blackish grain) and Bili-Kagga (‘white Kagga’) are traditionally grown in the gaznis, the former to a greater extent. Greater tolerance to salinity is attributed to Kari-Kagga (Bhattacharya 1971). Krishnamurthy et al. (2014) consider Bili-Kagga to be a landrace having “medium” tolerance to salinity and Pokkali of southern Kerala brackish waters as having “high” tolerance. Their studies of 57 genotypes indicated that, among the cultivars (apart from the tolerant wild rice), Kagga and Pokkali alone appear to be traditional salt-tolerant landraces. Kaipad rice, spread in the north of Malabar district and Kozhikode, Kannur and Kasargod river banks is reported to be salinity-tolerant by Lalitha and Vinayan (2017). The gaznis of Aghanashini cover about 2000 ha, but many have suffered degradation due to conversion into aquaculture ponds for prawn farming, many such ponds abandoned currently due to losses suffered.
Reasons for choosing gaznis for soil carbon studies: The gaznis are intertidal zones extensively spread alongside the main course of the estuary, on a flatter alluvial terrain. They have dark organic matter and rich, silty soils indicative of high carbon content. As the abandoned or neglected gaznis are subjected to a succession of vegetation beginning with sedges, other salinity-tolerant herbs and mangroves, there is strong reason to believe that before the introduction of agriculture in the estuarine zone the areas currently under gaznis would have been mangroves and brackish water marshes with sedges and herbs. As these marshes are practically devoid of carbon studies, almost all over the west coast, we have initiated the current study in the Aghanashini gaznis for estimation of the SOC. Moreover, it has been the traditional practice to harvest only the ear-heads of the Kagga rice, leaving behind the tall straw back in the marshy field, where it undergoes only incomplete oxidation due to anoxic conditions, thereby adding organic carbon to the gazni soils through the ages. But this source of soil carbon being unstudied, whereas studies have been conducted the world over on mangrove soil carbon, we initiated the current study, admitting that there is more to be done in this direction when the planet is in the throes of climatic change.
Silt-soil depth profile of gaznis: For measuring the carbon-rich silt-soil depth and to prepare a depth profile of the gaznis under study, a 5 m long graduated steel rod probe (after Kauffman and Donato 2009) was used in different portions of the gaznis to find out the depth of the carbon-rich silty soil. The rod is pushed vertically into the silty, detritus-rich substratum until it touches the hard bottom, which offers more resistance, an indication that the probe need not be pushed any further as it would have touched a compact layer of sand, gravel, pebbles or rock, indicators of the real depth of the gazni.
Figure 1. Estuary of Aghanashini river, where three of the gaznis (Lukkeri, Manikatta and Kagal) are under study for SOC estimates
Figure 2. Aghanashini estuary showing three broad salinity zones, high, medium and low (also locations of mangrove areas as well as suitable areas for planting which are high-carbon areas)
Soil sample collection: For collecting soil samples, we designed a soil auger of total length 150 cm, made of a galvanized iron (GI) metallic hollow cylindrical pipe having inner diameter 5 cm. This auger could be inserted into the mud to a maximum depth of 125 cm, and the rest, a length of 25 cm, had to be left outside for gripping the auger. The core is prepared in a fashion such that subsamples can be collected from the same spot at desired depths. Following Murdiyarso et al. (2015), the subsamples were collected from the soil cores representing intervals of depths of 0–15 cm, 15–30 cm, 30–50 cm, 50–100 cm and 100–150 cm. From each of these five depth intervals, the subsample cores were drawn using an injection syringe from which the needle and syringe bottom portion were cut away to leave a wide open end convenient for drawing the subsample. Subsamples were collected in duplicate for each representative depth interval (one meant for analysis and the second for safe custody for any future verification or additional studies). The samples were transferred to airtight bottles and labelled in the field itself before they were carried into the laboratory of the Centre for Ecological Sciences Field Station at Kumta, the coastal town closest to Aghanashini Estuary.
The soil samples were measured for fresh weight and volume and dried in a hot air oven for 48 hours at a temperature not exceeding 60°C, so as to prevent the loss of volatile organic compounds. The dried samples were transferred to desiccators and allowed to cool down to room temperature. The weights of these samples were recorded, and the samples were oven dried for two more hours and weighed again. The procedure may be repeated until the dry weight of the samples becomes constant.
Determination of organic carbon in the soil: The bulk density (BD) was calculated first. The BD is the weight of soil in a given volume, or to be more precise, the weight of dry soil per unit of volume, typically expressed in grams per cubic centimetre. When determining the BD, the amount of soil moisture must be found out. Therefore the fresh volume of the soil collected for bulk density calculation is essential. The bulk density typically increases with soil depth since the subsurface layers are more compacted and have less organic matter, less aggregation, and less root penetration compared with the surface layers and therefore contain less pore space. The BD is calculated by taking the ratios of the dry weights to the corresponding fresh volumes of the respective samples (https://www.nrcs.usda.gov/Internet/FSE_DOCUMENTS/nrcs):
Bulk density (g/cm3) = Dry weight/Fresh volume
(or dry weight of bulk sample/volume of soil core)
One of the most widely followed methods for SOC estimation was established by Walkley and Black (1934). The method depends principally on efficient conversion of SOC into carbon dioxide using chromic acid, a strong oxidizing agent. The excess of chromic acid is back-titrated against standard ferrous ammonium sulphate (FAS) solution to find the OC concentration in the soil sample. The method has been advanced subsequently by various scientists. The ISO-certified modified Walkley and Black method, as used and prescribed by Irrigation Research & Development, Government of Maharashtra (2009) was used for SOC estimates in our estuarine study.
Procedure: A known quantity of soil sample is taken into a 500 ml volumetric flask, and 10 ml of K2Cr2O7 (potassium dichromate) is added, after which 20 ml concentrated H2SO4 is added with a pinch of silver sulphate to avoid the interference caused by salinity (for saline soils). The flask is closed for 30–50 minutes to cool to room temperature. Then 150 ml of distilled water is added, after which 10 ml of H3PO4 (ortho phosphoric acid) is added, and the flask is kept for digestion of OC in a water bath for an hour. The solution is transferred to a 250 ml volumetric flask and distilled water is filled to the mark. The flask is shaken to homogenize the solution thoroughly and kept for 15 minutes, after which it is shaken again. Twenty-five millilitres of the solution is pipetted out into a 100 ml conical flask. Three or four drops of ferroin indicator are added and titration against standard FAS is carried out till the colour changes to wine red.
The titration procedure is repeated by taking 25 ml of the solution until concurrent readings are obtained. The blank titration is run, followed by the same procedure without a soil sample. Calculate the OC using the formula
SOC % = (Vb-Vs) × 10 × 0.003 × N × 100/Ws
where, Vb is the volume of FAS consumed for the blank
Vs is the volume of FAS consumed for the sample
Ws is the weight of sample taken
and N is the normality of the FAS
The SOC per hectare (SOC Mg/ha) was obtained by multiplying the SOC percentage values multiplied by the bulk density, and the interval values of the samples, 0–15 cm, 15–30 cm, 30–50 cm, 50–100 cm and 100–150 cm, were extrapolated to each hectare. As the SOC tends to decline with depth with only minor variations after 1 m depth, we extrapolated the actual value obtained for the 100–150 cm class for the deeper layers of carbon soil wherever it was applicable.
RESULTS
I. Bridge gazni: In Figure 3, details regarding the estimated areas under different silt soil depth classes are given with the total carbon content in each such depth zone (see Table 1 for more details).
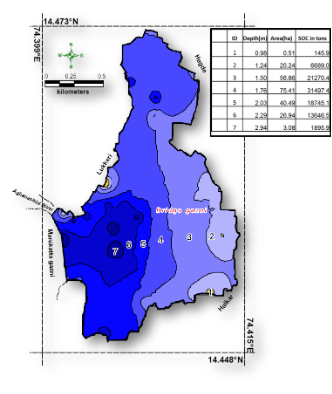
Figure 3. Areas under different silt-soil depth classes and SOC estimate for each depth class for the Bridge gazni
It can be seen from the map and table that Bridge gazni has depth ranging from 0.98 m to 2.94 m. The maximum area is under the mean depth of 1.76 m depth (75.41 ha). Altogether the gazni, of an extent of 223.53 ha, has an estimated soil carbon of 93,890.23 tons at an average of 420 tons/ha.
Table 1. Estimated SOC in tons for Bridge gazni
|
|
|
Carbon (tons) |
||||||
|
MeanDepth (m) |
Total Area (ha) |
0–15 Cm |
15–30cm |
30–50 cm |
50–100 cm |
100–150 cm |
More than 150 cm |
Total SOC (tons) |
|
0.98 |
0.51 |
42.97 |
26.80 |
25.78 |
50.38 |
|
|
145.92 |
|
1.24 |
20.24 |
1705.15 |
1063.61 |
1022.99 |
2082.76 |
814.54 |
|
6689.04 |
|
1.50 |
56.86 |
4790.25 |
2987.99 |
2873.87 |
5851.06 |
4767.23 |
|
21270.40 |
|
1.76 |
75.41 |
6353.02 |
3962.79 |
3811.44 |
7759.91 |
6322.48 |
3287.69 |
31497.35 |
|
2.03 |
40.49 |
3411.14 |
2127.75 |
2046.48 |
4166.54 |
3394.74 |
3598.43 |
18745.08 |
|
2.29 |
26.94 |
2269.60 |
1415.70 |
1361.63 |
2772.21 |
2258.69 |
3568.73 |
13646.55 |
|
2.94 |
3.08 |
259.48 |
161.85 |
155.67 |
316.94 |
258.23 |
743.71 |
1895.89 |
|
|
223.53 |
18,831.61 |
11,746.50 |
11,297.87 |
22,999.80 |
17,815.91 |
11,198.55 |
93,890.23 |
II. Manikatta gazni: In Figure 4, details regarding the estimated areas under different carbon rich silt-soil depth classes are given with the total carbon content in each depth zone (Table 2 for more details).
Table 2. Estimated SOC of Manikatta gazni
|
|
|
Carbon (tons) |
||||||
|
Mean Depth (m) |
Total Area (ha) |
0–15 cm |
15–30 cm |
30–50 cm |
50–100 cm |
100–150 cm |
More than 150 cm |
Total SOC (tons) |
|
0.7 |
0.86 |
70.31 |
45.63 |
47.09 |
42.57 |
|
|
205.59 |
|
1.3 |
26.90 |
2199.08 |
1427.38 |
1472.78 |
3328.88 |
1967.06 |
|
10,395.17 |
|
1.7 |
40.29 |
3293.71 |
2137.89 |
2205.88 |
4985.89 |
4910.34 |
1964.14 |
19,497.84 |
|
2.3 |
36.87 |
3014.12 |
1956.41 |
2018.63 |
4562.66 |
4493.53 |
7189.65 |
23,235.01 |
|
2.6 |
48.59 |
3972.23 |
2578.31 |
2660.30 |
6013.01 |
5921.91 |
13028.19 |
34,173.95 |
|
3.1 |
11.75 |
960.56 |
623.48 |
643.31 |
1454.06 |
1432.03 |
4582.50 |
9695.95 |
|
3.7 |
0.42 |
34.34 |
22.29 |
23.00 |
51.98 |
51.19 |
225.23 |
408.00 |
|
4.3 |
0.25 |
20.44 |
13.27 |
13.69 |
30.94 |
30.47 |
170.63 |
279.42 |
|
|
165.93 |
13,564.78 |
8804.66 |
9084.67 |
20,469.98 |
18,806.53 |
27,160.33 |
97,890.95 |
The results show that of the 165.93 ha area of the Manikatta gazni, the 2.6 m depth class is the largest, covering altogether 48.59 ha. This gazni, with a smaller area than the Bridge gazni, contains more SOC, with a total SOC of 97,890.95 tons at 589.95 tons/ha, almost 170 tons/ha more than the Bridge gazni.
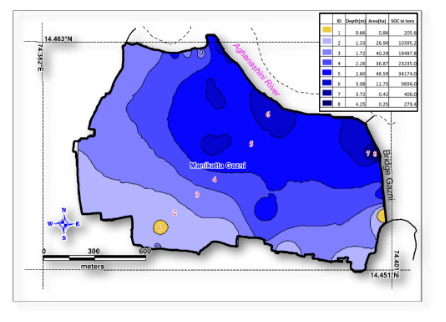
Figure 4. Areas under different silt-soil depth classes and SOC estimate for each depth class for the Manikatta gazni
III. Kagal gazni: in Figure 5 details regarding the estimated areas under different silt soil depth classes are given with total carbon content in each such depth zone (Table 7.3 for more details).
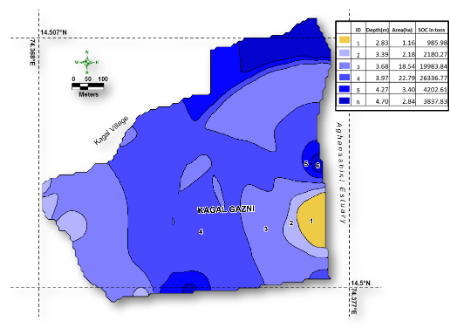
Figure 5. Areas under different silt-soil depth classes and SOC estimate for each depth zone for the Kagal gazni
The results show that the 50.91 ha-sized Kagal gazni is deeper than the other gaznis, the largest depth class being 3.97 m, covering an area of 22.79 ha. This gazni has an estimated total SOC of 57,527.31 tons and the highest SOC content of 1129.97 tons/ha. Table 3. Estimated SOC of Kagal gazni Carbon (tons) Mean Depth (m) Total Area (ha) 0–15 cm 15–30 cm 30–50 cm 50–100 cm 100–150 cm More than 150 cm Total SOC 2.83 1.16 88.27 69.27 85.97 173.33 155.50 413.64 985.98 3.39 2.18 165.89 130.18 161.57 325.74 292.24 1104.66 2180.27 3.68 18.54 1410.82 1107.12 1374.08 2770.28 2485.36 10,836.19 19,983.84 3.97 22.79 1734.22 1360.90 1689.07 3405.32 3055.09 15,092.17 26,336.77 4.27 3.4 258.73 203.03 251.99 508.03 455.78 2525.04 4202.61 4.7 2.84 216.11 169.59 210.48 424.36 380.71 2436.57 3837.83 50.91 3874.03 3040.09 3773.16 7607.06 6824.70 32,408.27 57,527.31 SOC for top 1 m of soil depth: The Bridge gazni, although shallower than the other two gaznis, has more SOC in the top 1 m (290.24 tons/ha) than the Manikatta gazni (239.06 tons/ha), but Kagal, the smallest, has the most SOC, 350 tons/ha for top 1 m (Table 4). Table 4. SOC in top 1 m depth of gazni soil Name of Gazni SOC in top 1 m (tons) Bridge 290.242 Manikatta 239.06 Kagal 350.00 DISCUSSION Comparison with mangroves: Recent investigations have rated mangroves among the most carbon-rich forests in the world. Fujimoto et al. (1999) estimated the SOC in the top 1 m of mangrove soils in their Micronesian studies to be 544–682 tons/ha. Studies covering 25 mangrove forests tropical Indo-Pacific region found 1025 Mg (tons) carbon per hectare. Organic-rich soils ranged from 0.5 m to more than 3 m in depth and accounted for 49–98% of carbon storage in these systems (Donato et al. 2011). Kauffman et al. (2011) estimated that total organic carbon of Micronesian mangrove forest sites ranged from 479 Mg/ha to 1385 Mg/ha; about 70% these mangrove ecosystem C stocks were in the soil and the rest in the biomass and debris. Murdiyarso et al. (2015), based on 39 Indonesian sites, estimated a grand mean of 848.9 Mg/ha SOC and 233.6 Mg/ha of OC respectively for the biomass and debris together. Weiss et al. (2016), found in some marine island mangroves of Indonesia 570 tons of carbon/ha in the top 1 m of soil, while in undegraded estuarine mangroves it was approximately 310/ha. Although ocean’s vegetated coastal habitats, such as seagrasses, salt-marshes, macroalgae and mangroves, occupy only 0.2 to 0.5 per cent of the ocean’s surface, they account for about 50 per cent and perhaps as much as 71 per cent of the carbon burial in marine sediments. The carbon sequestered in vegetated coastal ecosystems, specifically mangrove forests, seagrass beds, and salt marshes, has been termed “blue carbon”. (Nelleman et al. 2009; Mcleod et al. (2011; Durate et al. 2013). Mangrove loss is assumed to be responsible for 10 per cent of the total deforestation-derived emissions worldwide (Donato et al. 2011). Mangroves are the source of >10 per cent of the globally dissolved organic carbon (DOC) exported to the oceans (Jennerjahn and Ittekkot 2002; Dittmar et al. 2006). Soils are most decisive for the fate of carbon in mangroves as they account for up to 98 per cent of the total carbon stored in these ecosystems (Donato et al. 2011). Our own preliminary observations on the mangrove swamp carbon in Aghanashini estuary from seven cores of 1 m depth led us to estimate 310.68 tons/ha of SOC. Considering the fact that compared with the high-statured mangroves of equatorial regions, the rather dwarf mangroves and newly planted areas having an average of 310.68 ton/ha at the 14.4°N latitude is very promising. Given a chance, even fragmentary mangroves such as those of Aghanashini, and probably other estuaries of the south Indian west coast, where the mangroves are in a decadent condition or where restoration efforts are ongoing for the last two decades or so, need to be paid greater attention as the potential storehouses for blue carbon, and as one of India’s notable contribution towards mitigation of global climatic change. What is more of a surprising find emerging from our current studies is that that even the estuarine rice fields, the gaznis, have an estimated 230–350 tons/ha of SOC and that too in the top 1 m. In this regard the Kagal gazni, without even a single mangrove tree, has almost 1130 tons/ha SOC, comparable with some of the best mangrove areas of the equatorial region. The other two gaznis where we have analyzed the soil reveals 420 tons of SOC per ha in Bridge gazni and about 590 tons/ha in the Manikatta gazni. This is for the first time that we have been able to unravel the fact that the currently neglected estuarine rice fields can, if their traditional cultivation system is restored, make a tremendous contribution towards more sequestration of SOC (in addition to biomass carbon) and provide without any human input, except labour, food security of a rare kind in terms of the very nutritious Kagga rice (which is currently on the verge of extinction). At the same time restoration of estuarine agriculture, in the gazni rice fields, while contributing substantially towards the local fishery will also strengthen the key role of estuaries as nurseries for marine fishes and crustaceans, through nutrient enrichment and improvement of habitat quality even without mangroves, being rice fields.
REFERENCES
-
Ajmalkhan, S., Raffi, S.M. and Lyla, P.S. 2005. Brachyuran crab biodiversity in natural (Pitchavarum) and artificially developed mangroves (Vellar estuary). Current Science 88: 1316–1324.
-
Alcock, A.W., 1900. Materials for a carcinological fauna of India. No. 5. Brachyura Primigenia or Dromiacea. Journal of the Asiatic Society of Bengal, Calcutta, 68, part 2(3): 123-169.
-
Bandekar, P.D., Neelakantan, K. and Kakati, V.S. 2011. Biodiversity of crabs in Karwar mangrove environment west coast of India. Recent Research in Science and Technology 3(4): 1-5.
-
Beleem, I.B., Kumar, J.S.Y., Satyanarayana, Ch., Venkataraman, K. and Kamboj, R.D. 2014. Distribution of marine crabs from the Marine National Park, Gulf of Kachchh. Scholars Academic Journal of Biosciences 2(7): 419–427.
-
Bhat, M., Nayak, V.N., Chandran, M.D.S. and Ramachandra, T.V. 2014. Impact of hydroelectric projects on the finfish diversity in the Sharavathi estuary of Uttara Kannada district, central west coast of India. International Journal of Environmental Sciences 5(1): 58–66.
-
Bond-Buckup, G., Jara, C.G., Perez-Lozada, M., Buckup, L. and Crandall, K.A. 2007. Global diversity of crabs (Aeglidae: Anomura: Decapoda) in freshwater. Hydrobiologia 595: 267–273.
-
Bondad-Reantaso, M.G., Subasinghe, R.B., Josupeit, S., Cai. J. and Zhou, X. 2012. The role of crustacean fisheries and aquaculture in global food security: Past, present and future. Journal of Invertebrate Pathology 110(2): 158–165.Boominathan, M., Ravikumar, G., Chandran, M.D.S. and Ramachandra, T.V. 2014. Impact of hydroelectric projects on bivalve clams in the Sharavathi estuary of Indian west coast. The Open Ecology Journal 7: 52–58.
-
Chandran, M.D.S., Ramachandra, T.V., Joshi, N.V., Mesta, N.M., Settur, B. and Vishnu, D.M. 2012. Conservation and Management of Mangroves in Uttara Kannada, Central West Coast. ENVIS Tech. Report 50. Centre for Ecological Sciences, Indian Institute of Science, Bangalore.
-
Chapman, A.D. 2009. Numbers of Living Species in Australia and the World. Australian Biodiversity Information Services, Toowoomba, Australia.
-
Chatterjee, S., Mazumdar, D. and Chakraborty, S.K. 2014. Ecological role of fiddler crabs (Uca spp.) through bioturbatory activities in the coastal belt of East Midnapore, West Bengal, India. Journal of Marine Biological Association of India 56(1): 1–10.
-
Christy, J.H. and Morgan, S.G. 1998. Estuarine immigration by crab post-larvae: Mechanisms, reliability and adaptive significance. Marine Ecology Progress Series 174: 51––65.
-
De Grave, S., Pentcheff, N.D. and Ahyong, S.T. et al 2009.A classification of living and fossil genera of decapod crustaceans. Raffles Bulletin of Zoology Suppl. 21: 1–109.
-
Dineshbabu, A.P., Durgekar, R.N. and Zacharia, P.U. 2011. Estuarine and marine decapods of Karnataka, inventory. Fishing Chimes 30(10–11): 20–24.
-
Dittel, A.I. and Epifanio, C.E. 1990. Seasonal and tidal abundance of crab larvae in a tropical mangrove system, Gulf of Nicoya, Costa Rica. Marine Ecology Progress Series 65: 25–34.
-
FAO. 2011. Reducing Environmental Impacts of Coastal Aquaculture. GESAMP Reports and Studies No. 47. FAO, Rome.
-
FAO. 2015. FAO Global Aquaculture Production Database updated to 2013: Summary Information.
-
FAO. 2010-2017. Cultured Aquatic Species Information Programme: Scylla serrata. Text by Quinitio, E.T. SEADEC. In FAO Fisheries and Aquaculture Department (online), Rome. Updated 2010 (accessed on 26 April 2017).
-
FAO Catalogue Vol. I. 1980. Shrimps and Prawns of the World. An Annotated Catalogue of Species of Interest to Fisheries. L.B. Holthuis. FAO Fisheries Synopsis No.125.
-
FAO, 2017. Scylla serrata (null, 2001). Species Fact Sheets, FAO FishFinder. Fisheries and Aquaculture Department, FAO. http://www.fao.org/fishery/species/2637/en
-
Haefner, P.A. Jr. 1985. The biology and exploitation of crabs. In Provenzano Jr., A.J. (ed.), The Biology of Crustacea, Volume 2. Economic Aspects: Fisheries and Culture, Vol. 10. Academic Press, New York.
-
Haragi, S.B., Naik, U.G. and Rathod, J.L. 2010. Brachyuran diversity in sublittoral zone of tropical estuary, Karwar, west coast of India. Paper presented at Lake 2010, 22–24 December 2010. Centre for Ecological Sciences, Indian Institute of Science, Bangalore.Henderson, P.A. 1989. On the structure of the inshore fish community of England and Wales. Journal of the Marine Biological Association of the United Kingdom 69: 145-163.
-
Jeyabaskaran, R., Wafar, S. and Wafar, M.V.M. 2002. CD on brachyuran crabs of west coast of India. National Institute of Oceanography, Goa.
- Josileen, J. 2015. Classification, Biodiversity and Conservation of Marine Crabs. Summer School on Recent Advances in Marine Biodiversity Conservation and Management, 16 February to 8 March 2015, Central Marine Fisheries Research Institute, Kochi. Pp. 84–92.
- Kulkarni, A. and Mukadam, M. 2015. Brachyuran crab diversity in the mangroves of Bhatye region, Ratnagiri. International Journal of Agriculture Innovations and Research, 4(1): 35–36.
-
Kurien, C.V. and Sebastian, 1976. Prawn and Prawn Fisheries of India. Hindustan Publishing Co., Delhi.
-
Linton, S.M.and Greenaway, P. 2007. A review of feeding and nutrition of herbivorous land crabs: Adaptations to low quality plant diets. Journal of Comparative Physiology. B, Biochemical, Systemic, and Environmental Physiology 177(3): 269–286.
-
Lopez-Durate, P.C., Christy, J.H. and Takersley, R.A. 2011. A behavioral mechanism for dispersal in fiddler crab larvae (genus Uca) varies with adult habitat, not phylogeny. Limnological Oceanography 56(5): 1879–1892.
-
Marine Biodiversity Database of India (http://www.biosearch.in)
-
Meynecke, J.O. and Richards, R.G. 2014. A full life cycle and spatially explicit individual-based model for the giant mud crab (Scylla serrata): A case study from a marine protected area. ICES Journal of Marine Science 71(3): 484–498.
- Meysman, F.J.R., Middelburg, J.J. and Heip, C.H.R. 2006. Bioturbation: A fresh look at Darwin’s last idea. Trends in Ecology & Evolution. 21: 688–695.
- Ministry of Agriculture, Government of India. 2002. Shrimp farming in India: Lessons and challenges in sustainable development. Aquaculture Authority News 1(1): 1–4.
- Motoh, H. 1985. Biology and ecology of Penaeus monodon. In Taki, Y., Primavera, J.H. and Llobrera, J.A. (eds.). Proceedings of the First International Conference on the Culture of Penaeid Prawns/Shrimps, 4–7 December 1984, Iloilo City, Philippines. SEAFDEC Aquaculture Department, Iloilo. Pp. 27–36.
- Myers, P. 2001. Crustacea (online), Animal Diversity Web. http://animaldiversity.org/accounts/Crustacea/, accessed 23 April 2017
- National Institute of Oceanography website (http://www.niobioinformatics.in)
- Pandya, P.J. and Vachhrajani, K.D. 2013. Brachyuran crab diversity of lower estuarine mud flats of Mahi river with new record of two species from Gujarat, India. Arthropods 2(4): 242–250.
- Pati, S.K., Roy, M.K.D. and Sharma, R.M. 2012. Fresh water crabs. https://www.researchgate.net/publication/267862557_Freshwater_Crabs
- Ng, P.K.L., Guinot, D. and Davie, P.J.F. 2008. Systema brachyurorum: Part I. An annotated checklist of extant brachyuran crabs of the world. Raffles Bulletin of Zoology. 17: 1–286.
- Pittman, S.J. and McAlpine, C.A. 2003. Movements of marine fish and decapod crustaceans: Process, theory and application. Advances in Marine Biology 44: 205–294.
-
Primavaera, J.H. 1998. Mangroves as nurseries: Shrimp populations in mangrove and non-mangrove habitats. Estuary, Coastal and Shelf Science 46(3): 457–464.
- Quinitio, E.T., De Pedro, J. and Parado-Estepa, F.D. 2007. Ovarian maturation stages of the mud crab Scylla serrata. Aquaculture Research 38: 1434–1441.
- Rajyalakshimi, T., Pillai, S.M. and Ravichandran, P. 1985. The biology of Penaeus monodon in the capture fisheries of Orissa coast in the context of occurrence of natural brood stock. In Taki, Y., Primavera, J.H. and Liborera, J.A. (eds.), First International Conference, Culture of Penaeid Prawn and Shrimp, 4–7 December 1984, Iloilo City, Philippines. SEAFDEC Aquaculture Department.
- Ravichandran, S., Kannupandi, T. and Kathiresan, K. 2006. Mangrove leaf litter processing by sesarmid crabs. Ceylon Journal of Sciences (Biological Sciences) 35(2): 107–114.
- Ravichandran, S. Soundarapandian, P. and Kannupandi, T. 2002. Zonation and distribution of crabs in Pichavaram mangrove swamp, southeast coast of India. Indian Journal of Fisheries 48(2): 221–226.
- Satheeshkumar, P. and Khan, A.B. 2011. An annotated checklist of brachyuran crabs (Crustacea, Decapoda) from Pondicherry mangroves, southeast coast of India. World Journal of Zoology 6(3): 312–317.
- Shanij, K., Praveen, V.P., Suresh, S., Oommen, M.M. and Nayar, T. S. 2016. Leaf litter translocation and consumption in mangrove ecosystems: the key role played by the sesarmid crab Neosarmatium malabaricum, Current Science, 110(10): 1969-1976.
- Shastri, R.N. 1987. Status of brackish water prawn farming in Karnataka. In Srivastava, U.K., Dholakya, B.H. and Vathsala, S. (eds.), Brackish Water Aquaculture Development in India: Status and Task Ahead.
- Shet, G.N., Chandran, M.D.S. and Ramchandra, T.V. 2016. Brachyuran crabs of Aghanashini estuary, south Indian west coast, Karnataka. Paper presented at Lake 2016: Conference on Conservation and SustainableManagement of Ecologically Sensitive Regions in Western Ghats, Moodbidri, 28–30 December 2016.
- Shukla, M.L., Patel, B.K., Trivedi, J.N. and Vachhrajani, K.D. 2013. Brachyuran crab diversity of Mahi and Dhadhar estuaries, Gujarat, India. Research Journal of Marine Sciences 1(2): 8–11.
- Srivastava, U.K. et al. 1985. Inland Fish Marketing in India, Vol. VI. Concept Publishing Co., New Delhi.
- Stevcic, Z. 2005. The reclassification of brachuran crabs (Crustacea: Decapoda: Brachyura) Natura Croatica 14(1), Suppl. 1: 1-159.
- Sukumaran, K.K. 1995. Fishery Biology and Population Dynamics of Portunus (Portunus) sanguinolentus (Herbst) and Portunus (Portunus) pelagicus (Linnaeus) along the Karnataka coast. Ph.D. thesis. School of Ocean Sciences, Karnataka University, PG Centre, Karwar.
- Suseelan, C. 1996. Crustacean biodiversity, conservation and management. In Menon, N.G. and Pillai, C.G.S. (eds.), Marine Biodiversity Conservation and Management, CMFRI, Cochin. Pp. 41–78.
- Venkataraman, K. and Wafer, M. 2005. Coastal and marine biodiversity of India. Indian Journal of Marine Sciences 34(1): 57–75.
- Virnstein, R.W. 1977. The importance of predation by crabs and fishes on benthic fauna in Chesapeake Bay. Ecology 58(6): 1199–2017.
-
Vorsatz, J.P. 2009. Ecological Role
of Estuarine Brachyuran Crabs in
Mangrove and Salt Marsh Estuaries,
Eastern Cape, South Africa. Ph.D.
thesis. University of Port
Elizabeth.World Register of Marine
Species (WoRMS) website
(http://www.marinespecies.org)
-
Abraham, K.C., 1953. Observation on the biology of Meretrix casta (Chemnitz) Journal of the Zoological Society of India. 5: 163–190.
-
Achari, G.P.K. 1988. Characteristics of clam resources of Vembanad Lake - A case study. Bulletin of Central Marine Fishereis Research Institute. 42: 344-348.
-
Alagerswami, K., Kuriakose, P.S., Appukuttan, K.K. and Rangarajan, K. 1980. Present status of exploitation of mussel resources in India. Paper prepared for the Workshop on Mussel Farming, Madras, India, 25–27 September, 1980.
-
Alagerswami, K. and Meiyappan, M.M. 1987. Prospects and problems of management and development of the marine molluscan resources (other than cephalopods) in India. Paper 30. National Symposium on Research and Development in Marine Fisheries, Mandapam Camp, 16–18 September 1987, CMFRI, Cochin.
-
Alagerswami, K. and Narasimham, K.A. 1973. Clams, cockle and oyster resources of the Indian coast. In Proceedings of the Symposium on Living Resources of the Seas around India, CMFRI, Cochin. Pp. 648–658.
-
Appukuttan, K.K. 1993. Studies on the Ecobiology and Fishery of Paphia malabarica Chemnitz (Veneridae: Bivalvia) from Ashtamudi estuary, southwest coast of India. Ph.D. thesis. University of Kerala. 185 pp.
-
Appukuttan, K.K. 1996. Short neck clam fishery in Ashtamudi estuary. Seafood Exp. J. 27(10): 17–24.
-
Appukuttan, K.K. 2016. Ashtamudi clam fisheries: The first MSC certified fishery from India. In Nandan, S.B., Oliver, P.G., Jayachandran, P.R. and Asha C.V. (eds.), Training Manual of International Training Workshop on Taxonomy of Bivalve Molluscs, Directorate of Public Relations and Publications, Cochin University of Science & Technology, Cochin. Pp. 55–65.
-
Appukuttan, K.K. and Aravindan, C.M. 1995. Studies on the biochemical composition of the short neck clam Paphia malabarica from Ashtamudi estuary, southwest coast of India. Seafood Export Journal. 26(5): 17–21.
-
Appukuttan, K.K., Thomas, K.T., Mathew, J. and Nair, P.T. 1985. Baby clam (Katelysia opima) fishery in Ashtamudi backwaters. Journal of the Marine Biological Association of India 27(1&2): 15–20.
-
Ansari, Z.A., Parulekar, A.H. and Matondkar, S.G.P. 1981. Seasonal changes in meat weight and biochemical composition in the black clam Villorita cyprinoides (Grey). Indian Journal of Marine Sciences 10: 128–131.
-
AQUACOP and deGaillande, D. 1979. Spat production and culture of the green mussel, Mytillus viridis in the French Polynesia. The South Pacific Commission Fish News 19: 4–10.
-
Balasubramanian, K. and Natarajan, R. 1987. Age and growth of Meretrix casta (Chemnitz) in Vellar estuary, Parangipettai. Bulletin of Central Marine Fisheries Research Insttitute 42(1): 145–147.
-
Bayne, B.L. and Newell, R. 1983. Physiological energetics of marine molluscs. In Wilbur, K.M. (ed.), The Mollusca, Vol. 4, Physiology, Part I. Academic Press, New York. Pp. 407–499.
-
Blanchette, C.A., Helmuth, B. and Gaines, S.D. 2007. Spatial patterns of growth in the mussel, Mytilus californianus, across a major oceanographic and biogeographic boundary at Point Conception, California, USA. Journal of Experimental Marine Biology and Ecology 340(2): 126–148.
-
Boominathan, M., Chandran, M.D.S. and Ramachandra, T.V. 2008. Economic Valuation of Bivalves in the Aghanashini Estuary, West Coast, Karnataka. Envis Technical Report 30, Ministry of Science and Technology, Government of India.
-
Boominathan, M., Ravikumar, G., Chandran, M.D.S. and Ramachandra, T.V. 2014a. Impact of hydroelectric projects on commercial bivalves in a south Indian west coast estuary. Journal of Biodiversity 5(1–2): 1–9.
-
Boominathan, M., Ravikumar, G., Chandran, M.D.S. and Ramachandra, T.V. 2014b. Impact of hydroelectric projects on bivalve clams in the Sharavathi estuary of Indian west coast. The Open Ecology Journal 7: 52–58.
-
Bouchet, P., Rocroi, J.P., Bieler, R., Carter, J.G. and Coan, E.V. 2010. Nomenclator of bivalve families with a classification of bivalve families. Malacologia 2: 1-184.
-
Broom, M.J. 1985. The Biology and Culture of Marine Bivalve Molluscs of the Genus Anadara. International Center for Living Aquatic Resources Management, Manila, Philippines.
-
Chapman, A.D. 2009. Numbers of Living Species in Australia and the World, 2nd edition. Australian Biological Resources Study, Canberra.
-
Cheong, L. and Lee, B. 1984. Mussel Farming. SAFIS Extension Manual No. 5. 51 pp. Southeast Asian Fisheries Development Center, Bangkok, Thailand.
-
Clemente, S. 2007. Ecology and population dynamics of the mangrove clam Polymesoda erosa (Solander 1876) in the mangrove ecosystem. Ph.D. thesis. Goa University, Dona Paula, Goa.
-
Clemente, S. and Ingole, B. 2011. Recruitment of mud clam Polymesoda erosa (Solander, 1876) in a mangrove habitat of Chorao island, Goa. Brazilian Journal of Oceanography 59(2). Online version.
-
CMFRI. 2014. Annual data available at http://www.cmfri.org.in/annual-data.htm
-
CMFRI Annual Report 2009. As quoted by Suja, N. and Mohamed, K.S. 2010. The black clam, Villorita cyprinoides, fishery in the state of Kerala, India. Marine Fisheries Review 72(3): 48–61.
-
Dey, A. 2008. Commercial and medicinal important molluscs of Sundarbans, India. Records of the Zoological survey of India, Occasional Paper No. 286: 1-54; Zoological Survey of India, Kolkata.
-
Durve, V.S. 1970. On the growth of the clam Meretrix casta (Chemnitz) from the Marine Fish Farm. J. Mar. Biol. Assoc. India. 12: 125–135.
-
Global Invasive Species Database. 2005. Perna viridis (mollusc). Invasive Species Specialist Group (ISSG) of the IUCN Species Survival Commission.
-
Gopal, B., Muniswamaiah, M. and Reddy, B.M.K. 1976. Lime Shell Deposits of Mangalore Taluq, South Kanara Dt. Geological Studies No. 114. Department of Mines and Geology, Government of Karnataka.
-
Gosling, E. 2015. Marine Bivalve Molluscs, second edition. Wiley Blackwell, West Sussex, UK.
-
Harkantra, S.N. 1975. Benthos of the Kali estuary, Karwar. Mahasagar 8: 53–58.
-
Hornell, J. 1917. The Edible Molluscs of the Madras Presidency, Report No. 1 (Madras Fisheries Bulletin, Vol. XI, pp. 1–51). Forgotten Books, United States.
-
Ingole, B.S., Naik, S., Furtado, R. and Chatterjee, A. 2002. Population characteristics of the mangrove clam Polymesoda (Geloina) erosa (Solander, 1786) in the Chorao mangrove, Goa. Executive Summaries. NCCAR, Old Goa.
-
Isaji, S. 1995. Defensive strategies against shell dissolution in bivalves inhabiting acidic environments: The case of Geloina (Corbiculidae) in mangrove swamps. Veliger 38(3): 235–246.
-
James, P.S.B.R., Shanbhogue, S.L. and Gupta, T.R.C. 1972. Estuarine fisheries resources of South Kanara district, Karnataka. http://eprints.cmfri.org.in/7506/1/526
-
Jayabal, R. and Kalyani, M. 1987. Reproductive cycle of the estuarine bivalve Meretrix meretrix (Linn.) of the Vellar estuary. Indian Journal of Fisheries 34(2): 229–232.
-
Jayawickrema, E.M. and Wijeyaratne, M.J.S. 2009. Distribution and population dynamics of the edible bivalve species Meretrix casta (Chemnitz) in the Dutch canal of Sri Lanka. Sri Lanka. J. Aquatic Sci. 14: 29–44.
-
Jones, S. 1970. The molluscan fishery resources of India. Proc. Symp. Mollusca, Mar. Biol. Asso. India, Pt III: 906–918.
-
Joseph, M.M. and Madhyastha, M.N. 1984. Annual reproductive cycle and sexuality of the oyster Crassostrea madrasensis (Preston). Aquaculture 40(3): 223–231.
-
Kalyanasundaram, M. and Kasinathan, R. 1983. Age and growth in the estuarine clam, Katelysia opima (Gmelin) from the Vellar estuary. Indian J. Mar. Sci. 12: 247–248.
-
Kamble, S. and Muley, D. 2015. Histological study of reproductive cycle of estuarine clam, Katelysia opima. Int. J. Adv. Res. Biol. Sci. 2(10): 39–43.
-
Korringa, P. 1976. Farming Marine Organisms Low in the Food Chain: A Multidisciplinary Approach to Edible Seaweed, Mussel and Clam Production. Elsevier Scientific Publishing Co., Amsterdam.
-
Kripa, V. and Appukuttan, K.K. 2003. Marine bivalves. In Joseph, M.M. and Jayaprakash, A.A. (eds.), Status of Exploited Marine Fishery Resources of India. CMFRI, Kochi. Pp. 211–220.
-
Laxmilatha, P. and Alloycious, P.S. 2001. A report on the organized fishing for the black clam (Villorita cyprinoides), in Aryad, Vembanad lake, Kerala. Marine Fisheries Information Service T & E Series 169.
-
Laxmilatha, P., Velayudhan, T.S., Mohamed, K.S., Kripa, V., Radhakrishnan, P. and Sharma, C.J. 2006. The fishery and biology of Meretrix casta (Chemnitz) in the Moorad estuary, Kerala. Indian Journal Fisheries 53(1): 109–113.
-
Lotze, H., Lenihan, H., Bourque, B., Bradbury, R., Cooke, R., Kay, M., Kidwell, S., Kirby, M., Peterson, C. and Jackson, J. 2006. Depletion, degradation, and recovery potential of estuaries and coastal seas. Science 312: 1806–1809.
-
Mansuri, R. 2014. Active population of the edible clam Meretrix casta (Chemnitz) (International Union for Conservation of Nature status: weak) from two estuaries of north Kerala, south west coast of India. African Journal of Fisheries 2(2): 62–69.
-
Macintosh, D.J. 1982. Fisheries and aquaculture significance of mangrove swamps, with special reference to the lndo-West Pacific region. In Muir, J.F. and Roberts, R.J. (eds.), Recent Advances in Aquaculture. Croom Helm Ltd., London. Pp. 3–85.
-
McKeon, C.S., Tunberg, B.G., Johnston, C.A. and Barshis, D.J. 2015. Ecological drivers and habitat associations of estuarine bivalves. PeerJ doi:10.7717/peerj.1348.
-
Meehan, B., 1982. Shell Bed to Shell Midden. Australian Institute of Aboriginal Studies, Canberra.
-
Mohamed, K.S. 2013. Status of molluscan fisheries of India. ICT-Oriented Strategic Extension for Responsible Fisheries Management, Central Marine Fisheries Research Institute, Cochin, 5–25 November 2013. CMFRI, Cochin.
-
Mohamed, K.S. and Sasikumar, G. 2016. Overview of bivalve fisheries of India. In Nandan, S.B., Oliver, P.G., Jayachandran, P.R. and Asha, C.V. (eds): Training Manual of First International Training Workshop on Taxonomy of Bivalve Molluscs. Cochin University of Science and Technology, Cochin. Pp. 47–53.
-
Mohan, M.K.R. and Velayudhan, T.S. 1998. Studies on the salinity tolerance of the venerid clam, Paphia malabarica (Chemnitz). Journal of the Marine Biological Association of India 40(1 & 2): 185–188.
-
Mohite, S.A. 2006. Biology, Ecology and Culture of Paphia malabarica. Ph.D. thesis. Dr. Balasaheb Sawant Konkan Krishi Vidyapeeth (Agricultural University), Dapoli, India. 276 pp.
-
Mohite, S.A. and Mohite, A.S. 2009. Gonadal development in the short neck clam Paphia malabarica in relation to hydrographic parameters in Kalbadevi estuary. Journal Mar Biol Ass India. 51(2): 164–172.
-
Morrit, D. and Williams, G.A. 2000. Osmoregulation in larvae of the mosquito Aedes togoi from super-littoral rock pools at Cape D’Aguilar, Hong Kong. In Morton, B. (ed.), Proceedings of the 10th International Marine Biological Workshop, 1998. Hong Kong University Press, Hong Kong. Pp. 277–286.
-
Morton, B. and Morton, J. 1983. The Seashore Ecology of Hong Kong. Hong University Press, Hong Kong.
-
Nagabhushanam, R. and Mane, U.H. 1975. Seasonal variation in the biochemical, chemical composition of the clam Katelysia opima. Rivista De Biologia.
-
Nair, K.N., Ramadoss, K. and Rajan, C.T. 1984. Molluscan resources of Kali river estuarine system in Karnataka. Marine Fisheries Information, Service 58.
-
Nair, S. 1975. Studies on the rate of growth of Villortia cyprinoides var. cochinchinensis (Hanley) from the Cochin backwaters. Bulletin of the Departmentt of Marine Sciences University Cochin 4: 919–929.
-
Narasimham, K.A. 1985. Ecology of the clam bed in the Kakinada bay. Journal of the Marine Biological Association of India. Biol. Ass. India 27(1 & 2): 97–102.
-
Narasimham, K.A. 1988. Biology of the blood clam Anadara granosa (Linnaeus) in Kakinada bay. Journal of the Marine Biological Association of India 30(1 & 2): 137–150.
-
Narasimham, K.A. 1991. Present status of clam fisheries of India. Journal of the Marine Biological Association of India 30(1 & 2): 76–88.
-
Narasimham, K.A., Muthiah, P., Sundararajan, D. and Vaidyanathan, N. 1988. Biology of the great clam Meretrix meretrix in the Korampallam creek, Tuticorin. Indian Journal of Fisheries 35(4): 288-293.
-
O’ Heraldo. 6 May 2007. Clams, mussels from Karwar, Kerala flood Margao market.
-
Parulekar, A.H., Nair, S.A., Ansari, Z.A., Harikantra, S.N., Chatterjee, A., Ingole, B.S. and Roy, J.M. 1984. Ecology and culturing of edible bivalves in Goa. Indian Journal of Marine Sciences 13: 190–192.
-
Pathansali, D. 1963. On the effect of salinity changes on the activity of the cockle, Anadara granosa (L). Malaysian Agricultural Journal 44: 18–25.
-
Patil, S.V. 2002. Effect of stocking density, salinity and aerial exposure on survival of the clam Paphia malabarica. M.F.Sc. thesis. Submitted to Dr. Balasaheb Sawant Konkan Krishi Vidyapeeth, Dapoli. Pp. 1–117.
-
Putri, L.S.E., Prasetyo, A.W. and Arifin, Z. 2012. Green mussel (Perna viridis) as bioindicator of heavy metals of pollution at Kamal Estuary, Jakarta Bay, Indonesia. Journal of Environmental Research and Development 6(3): 389–396.
-
Rai, H.S. 1932. The shell fisheries of the Bombay Presidency. Journal of the Bombay Natural History Society 35(4): 35(4): 826–847.
-
Rajagopal, S., Venugopalan, V.P., van der Velde, G. and Jenner, H.A. 2006. Greening of the coasts: A review of the Perna viridis success story. Aquatic Ecology 40: 273–297.
-
Ramachandra, T.V., Chandran, M.D.S., Joshi, N.V. and Boominathan, M. 2012. Edible Bivalves of Central West Coast, Uttara Kannada District, Karnataka, India. ENVIS Technical Report 48. Centre for Ecological Sciences, Indian Institute of Science, Bangalore.
-
Ranade, M.R. 1964. Studies on the Biology, Ecology and Physiology of the Marine Clams. Ph.D. thesis. University of Bombay. 286 pp.
-
Rao, G.S. 1983. Exploitation of clam shell deposits in the Kundapur estuary. Marine Fisheries Information Services. T&E Series. 49: 20–22.
-
Rao, G.S. 1987. Biology of Meretrix casta (Chemnitz) and Paphia malabarica (Chemnitz) from Mulky estuary, Dakshina Kannada. In National Seminar on Shellfish Resources and Farming, Tuticorin, 19–21 January 1987. CMFRI Bulletin 42(1): 148–153.
-
Rao, G.S., Kuriakose, P.S., Ramachandran, N., Meiyappan, M.M., Achari, G.P., Nagaraja, D. and Shivanna, H.S. 1989. Atlas of clam resources of Karnataka. CMFRI Special Publication 46: 1–56.
-
Rao, G.S. and Rao K. S. 1985. Survey of clam and oyster resources of some Karnataka estuaries. Indian Journal of Fisheries 32(1): 74–89.
-
Rao, K.S. 1987. Taxonomy of Indian oysters. In Nayar, K.N. and Mahadevan, S. (eds.), Oyster Culture: Status and Prospects. CMFRI Bulletin 38. CMFRI, Cochin.
-
Rao, K.V. 1951. Studies on the growth of Katelysia opima (Gmelin). Proc. Indo-Pacific Fish. Council. p. 11.
-
Salih, M.K.Y. 1973. On the growth of the backwater clam Meretrix casta (Chemnitz) in the clam beds off Cochin barmouth. Journal of the Marine Biological Association of India 15(1): 345-353. Saritha, K., Mary, D. and Patterson, J. 2015. Nutritional status of green mussel Perna viridis in Tamil Nadu, southwest coast of India. Journal of Nutrition and Food Sciences S14: 003. doi:10.4172/2155-9600.S14-003.
-
Sastry, A.N. 1979. Pelecypoda (excluding Ostreidae). In Giese, A.C. and Pearse, J.S. (eds.), Reproduction of Marine Invertebrates, Vol. 5. Molluscs: Pelecypods and Lesser Classes. Academic Press, New York. Pp. 113–292.
-
Sawant, P.P. 2012. Morphology and Biology of Meretrix meretrix (Linnaeus, 1758) along Ratnagiri Coast, Maharashtra. M.Sc. thesis. Dr. Balasaheb Sawant Konkan Krishi Vidyapeeth, Dapoli.
-
Sawant, P.P. and Mohite, S. 2013Study of proximate composition of Meretrix meretrix (Linnaeus, 1758) of the Ratnagiri coast, Maharashtra, India. Biosciences Biotechnology Research Asia 10(1): 311–317.
-
Seed, R. 1968. Factors influencing shell-shape in mussel Mytilus edulis. Journal of the Marine Biological Association of the United Kingdom 48: 561-584.
-
Seed, R. 1976. Ecology. In Bayne, B.L. (ed.), Marine Mussels: Their Ecology and Physiology. Cambridge University Press, Cambridge. Pp. 13–65.
-
Shivashankar, N. and Lakshmibai, T.C.H.J. 2016. Bivalve resources of Mulky estuary, Karnataka. International Journal of Science, Environment 5(1): 25–32.
-
Sivalingam, P.M. 1977. Aquaculture of green mussel, Mytilus viridis Linnaeus, in Malaysia. Aquaculture 11: 297–312.
-
Stephen, D. 1980. The reproductive biology of the Indian oyster Crassostrea madrasensis (Preston). I. Gametogenic pattern and salinity. Aquaculture 21(2): 139–146.
-
Suja, N. and Mohamed, K.S. 2010. The black clam, Villorita cyprinoides, fishery in the state of Kerala, India. Marine Fisheries Review 72(3): 48–61.
-
Sundaram, S. and Deshmukh, V.D. 2011. Onthe commercially exploited edible bivalves off Mumbai. Fishing Chimes 31(5): 23–24.
-
Sur, S., Konar, R., Das, P., Roy, P., Paul, S. and Bardhan, S. 2006. Ecology of an endangered bivalve species Meretrix meretrix (Linnaeaus): A case study from Chandipur on Sea, Orissa. Indian Journal of Earth Sciences 33(1–4): 1–14.
-
The Hindu. 21 May 2016. What is killing Goa’s clams?
-
Thangavelu, R., Poovannan, P. and Rudramurthy, N. 2008. Distribution of bivalve resources in Kandleru estuary, Krishnapatnam basin, Nellore District, Andhra Pradesh. Marine Fisheries Information Service, Technical and Extension Series 198, CMFRI, Cochin, pp. 8-12.
-
Thomas, S. and Nasser, M. 2009. Growth and population dynamics of short-neck clam Paphia malabarica from Dharmadom estuary, North Kerala, southwest coast of India. Journal of the Marine Biological Association of India 51(1): 87-92.
-
Thomas, S., Laxmilatha, P., Nasser, M. and Sivadasan, M.P. 2003. Fishery and biology of Paphia malabarica from Dharmadom estuary, north Kerala. Indian Journal of Fisheries 50: 519–523.
-
Urian, A.G. 2009. Potential for range expansion of the invasive green mussel, Perna viridis, in the Southeastern United States . UNF Theses & Dissertations. Paper 210, University of North Florida.Vakily, J.M. 1989. The Biology and Culture of Mussels of the Genus Perna International Center for Living Aquatic Resources Management, Manila, Philippines.
-
Venkatesan, V. and Mohamed, K.S. 2015. Bivalve classification and taxonomy. In Summer School on Recent Advances on Marine Biodiversity Conservation and Management 16 February – 8 March, 2015, Central marine Fisheries Research Institute, Cochin, pp. 42-48.
-
Venkatesan, V., Sasikumar, G., Vidya, R. and five others. 2016. Shift in market channels for short neck clam of Ashtamudi and Kayamkulam Lakes. Marine Fisheries Information Services., T & E Ser. 229: 11–13.
-
Venkatkumaran, C.S. and Bhat, A.S.1978. Lime shell deposits of coastal beds, North Kanara district, Karnataka. Geological Studies No.122, Department of Mines and Geology, Government of Karnataka.
-
Yap, W.G., Young, A.I., Orano, C.E.F. and de Castro, M.T. 1979. Manual on Mussel Farming. Aquaculture Extension Manual No. 6. Southeast Asian Development Center, Aquaculture Department, Iloilo, Philippines. 17 pp.
-
Yusof, A.M., Yanta, N.F. and Wood, A.K.H. 2004. The use of bivalves as bio-indicators in the assessment of marine pollution along a coastal area. Journal of Radioanalytical and Nuclear Chemistry 259(1): 119–127.
-
Wilson, C., Scotto, L., Scarpa, J., Volety, A., Laramore, S. and Haunert, D. 2005. Survey of water quality, oyster reproduction and oyster health status in the St. Lucie Estuary. Journal of Shellfish Research 24: 157–165.
-
Ansari, Z.A. and Parulekar, A.H. 1998. Community structure of meiobenthos from a tropical estuary. Indian J Mar Sci 27:362–366.
-
Bhat, M., Nayak, V.N., Chandran, M.D.S. and Ramachandra, T.V. 2014. Fish distribution dynamics in the Aghanashini estuary of Uttara Kannada, west coast of India. Current Science 106(12): 1739–1744.
-
Chandran, M.D.S., Ramachandra, T.V., Joshi, N.V., Mesta, P.N., Settur, B. and Mukri, V.D. 2012. Conservation and Management of Mangroves in Uttara Kannada, Central Western Ghats. ENVIS Technical Report 50. Centre for Ecological Sciences, Indian Institute of Science, Bangalore.
-
Chaudhary-Pachpande, S. and Pejavar, M.K. 2016. A preliminary study on the birds of Thane Creek, Maharashtra, India. Journal of Threatened Taxa 8(5): 87–97.
-
Christensen, B. 1978. Primary production of mangrove forests. In Proceedings of International Workshop for Mangrove and Estuarine Area Development for the Indo-Pacific Region, 14–19 November 1977, Manila. Los Banos, Laguna, Philippine Council for Agriculture and Resources Research. Pp. 131–136.
-
FAO. 1994. Mangrove Forest Management Guidelines. FAO Forestry Paper No. 117. Rome.
-
FAO. 2008. Loss of mangroves alarming. Food and Agriculture Organisation of the United Nations, Rome. http://www.fao.org/newsroom/en/news/2008/1000776/index. htm
-
Jayson, E.A. 2001. Structure, composition and conservation of birds in Mangalavanam mangroves, Cochin, Kerala. Zoo’s Print Journal 16(5): 471–478.
-
Jackson, L.L., Lopoukhine, N. and Hillyard, D., 1995. Ecological restoration: A definition and comments. Restoration Ecology 3: 71–75.
-
Jeyaseelan, M.J.P. and Krishnamurthy, K. 1980. Role of mangrove forests of Pichavaram as fish nurseries. Proceedings of Indian National Science Academy 46(1): 48–53.
-
Kathiresan, K. 2014. Interconnectivity of coastal ecosystems: An overview. Indian Journal of Geo-Marine Sciences 43(6): 985–994.
-
Krishnamurthy, K. and Jeyaseelan, M.J.P. 1981. The early history of fishes from Pichavaram mangrove ecosystem of India. Rapports et procès-verbaux des réunions 178: 416-423.
-
Kulkarni, S.S., Rivonker, C.U. and Sankdkar, U.M.X. 2003. Role of meiobenthic assemblages in detritus based food chain from estuarine environment of Goa. Indian Journal of Fisheries 50(4): 465–471.
-
Lewis, R.R. 1999. Key concepts in successful ecological restoration of mangrove forests. In Proceedings of the TCE-Workshop No. II, Coastal Environmental Improvement in Mangrove/Wetland Ecosystems, Bangkok. Network of Aquaculture Coordination in Asia. Pp. 19–32.
-
Lewis, R.R. 2001. Mangrove restoration: Costs and measures of successful ecological restoration. In Proceedings of the Mangrove Valuation Workshop, Universiti Sains Malaysia, Penang, 4–8 April 2001. Beijer International Institute of Ecological Economics, Stockholm, Sweden.
-
Lewis, R.R. 2009. Methods and criteria for successful mangrove forest restoration. In Perillo, G.M.E., Wolanski, E., Cahoon, D.R. and Brinson, M.M. (eds.), Coastal Wetlands: An Integrated Ecosystem Approach. Elsevier Press, Amsterdam. Pp. 787–800.
-
Odum, W.E. and Heald, E.J. 1975. The detritus-based food web of an estuarine mangrove community. In Cronin, L.E. (ed.), Estuarine Research, Vol. I. Chemistry, Biology and the Estuarine System. Academic Press, New York. Pp. 265–286.
-
Pawar, P.R. 2011. Species diversity of birds in mangroves of Uran (Raigad), Navi Mumbai, Maharashtra, west coast of India. Journal of Experimental Sciences 2(10): 73–77.
-
Quarto, A. 2012. Ecological mangrove restoration: Re-establishing a more biodiverse and resilient coastal ecosystem with community participation. http://mangroveactionproject.org/wp-content/uploads/2015/03/Quarto-2012-CBEMR-MFF-paper-pg-277-290.pdf
-
Ray, S. and Strasˇkraba, M. 2001. The impact of detritivorous fishes on a mangrove estuarine system. Ecological Modelling 140: 207–218.
-
Roy, M., Ray, S. and Ghosh, P.B. 2012. Modelling of impact of detritus on detritivorous food chain of Sundarban mangrove ecosystem, India. Procedia Environmental Sciences 13: 377–319.
-
Saenger, P., Hegerl, E.J. and Davie, J.D.S. (eds.). 1983 Global status of mangrove ecosystems. IUCN Comm. Ecol. Pap. 3. 88 pp.
-
Sivan, G. and Radhakrishnan, C.K. 2011. Food, feeding habits and biochemical composition of Scatophagus argus. Turkish Journal of Fisheries and Aquatic Sciences 11: 603–608.
-
Snedaker, S.C. 1978. Mangroves: Their value and perpetuation. Natural Resources 13: 6–13. UNESCO, Paris.
-
Spurgeon, J. 1998. The socio-economic costs and benefits of coastal habitat rehabilitation and creation. Marine Pollution Bulletin 37(8–12): 373–382.
-
Thangamani, V. and Rajendran, N. 2016.Total heterotrophic bacterial load in the gut of detritus fishes: A case study of Pichavaram mangrove environment, southeast coast, India. Current World Environment 11(3).
-
Amanullah, M., Natarajan, S., Vanathi, D., Ramasamy, S. and Sathyamoorthi, K. 2007. Lowland rice in coastal saline soils: A review. Agricultural Science Digest 28(4): 235–238.
-
Bhattacharyya, R.K. 1971. Rice cultivation in saline soils. In Proceedings of Symposium on Science & India Food Problem, 6–8 October 1967, New Delhi, organized by ICAR and Indian National Science Academy. Pp. 184–190.
-
Craft, C. 2007. Freshwater input structures soil properties, vertical accretion, and nutrient accumulation of Georgia and US tidal marshes. Limnology and Oceanography. 52(3): 1220–1230.
-
Dittmar, T., Hertkorn, N., Kattner, G. and Lara, R.J. 2006. Mangroves, a major source of dissolved organic carbon to the oceans. Global Biogeochemical Cycles 20: 1–7.
-
Donato, D.C., Kauffman, J.B., Murdiyarso, D., Kurnianto, S., Stidham, M. and Kanninen, M. 2011. Mangroves among the most carbon-rich forests in the tropics. Nature Geoscience. 4: 293–297.
-
Donato, D.C., Kauffman, J.B., Mackenzie, R.A., Ainsworth, A. and Pfleeger, A.Z. 2012. Whole-island carbon stocks in the tropical Pacific: implications for mangrove conservation and upland restoration. Journal of Environmental Management. 97: 89–96.
-
Duarte, C.M., Losada, I.J., Hendriks, I.E., Mazarrasa, I. and Marbà, N. 2013. The role of coastal plant communities for climate change mitigation and adaptation. Nature Climate Change 3: 961–968.
-
Elschot, K., Bakker, J.P., Temmerman, S., Van De Koppel, J. and Bouma, T.J. 2016. Ecosystem engineering by large grazers enhances carbon stocks in a tidal salt marsh. Marine Ecology Progress 5379–21. doi:10.3354/meps11447.
-
Fujimoto, K., Imaya, A., Tabuchi, R., Kuramoto, S., Utsugi, H. and Murofushi, T. 1999. Belowground carbon storage of Micronesian mangrove forests. Ecological Research 14: 409–413.
-
Hatton, R.S., Delaune, R.D. and Patrick, W.H.J. 1983. Sedimentation, accretion, and subsidence in marshes of Barataria Basin, Louisiana. Limnology and Oceanography 28(3): 494–502.
-
Irrigation Research and Development. 2009. Laboratory Testing Procedure for Soil and Water Sample Analysis. Document No. SSD/GL.01. Directorate of Irrigation Research and Development, Pune, Government of Maharashtra.
-
Jennerjahn, T.C., and V. Ittekkot. 2002. Relevance of mangroves for the production and deposition of organic matter along tropical continental margins. Naturwissenschaften 89: 23–30.
-
Kauffman, J.B. and Donato, D.C. 2009. Protocols for the Measurement, Monitoring and Reporting of Structure, Biomass and Carbon Stocks in Mangrove Forests. Working Paper 86. CIFOR, Bogor, Indonesia.
-
Kauffman, J.B., Heider, C., Cole, T.G., Dwire, K.A. and Donato, D.C. 2011. Ecosystem carbon stocks of Micronesian mangrove forests. Wetlands 31: 343–352.
-
Kirwan, M.L. and Megonigal, J.P. 2013. Tidal wetland stability in the face of human impacts and sea-level rise. 504: 53–60.
-
Krishnamurthy, S.L., Sharma, S.K., Kumar, V., Tiwari, S., Batra, V. and Singh, N.K. 2014. Assessment of genetic diversity in rice genotypes for salinity tolerance using Saltol markers of Chromosome 1. Indian Journal of Genetics and Plant Breeding 74(2): 243–247.
-
Lalitha, N. and Vinayan, S. 2017. GIs for Protecting Agro-biodiversity and Promoting Rural Livelihoods: Status, Strategies and Way Forward. GIDR Working Papers Series 240. Gujarat Institute of Development Research, Ahmadabad.
-
Mcleod, E., Chmura, G.L., Bouillon, S., Salm, R., Björk, M., Duarte, C.M., Lovelock, C.E., Schlesinger, W.H., and Silliman, B.R. 2011. A blueprint for blue carbon: Toward an improved understanding of the role of vegetated coastal habitats in sequestering CO2 Frontiers in Ecology and the Environment. 9: 552–560.
-
Mitra, S., Wassmann, R. and Vlek, P.L. 2005. An appraisal of global wetland area and its organic carbon stock. Current Science 88: 25–35.
-
Morrissey, E.M., Giiespie, J.L., Morina, J.S. and Franklin, R.B. 2014. Salinity affects microbial activity and soil organic matter content in tidal wetlands. Global Change Biology 20: 1351–1362.
-
Murdiyarso, D., Purbopuspito, J., Kauffman, J.B., Warren, M.W., Sasmito, S.D., Donato, D.C. et al. 2015. The potential of Indonesian mangrove forests for global climate change mitigation. Nature Climate Change. 5: 1089–1092.
-
Nelleman, C., Corcoran, E., Duarte, E., Valdés, L., De Young, C., Fonseca, L. and Grimsditch, G. (eds.). 2009. Blue Carbon. United Nations Environment Programme, GRID-Arendal.
-
Planning Commission, Government of India. 1981. Report on Development of Coastal Areas Affected by Salinity. Pp. 8–9.
-
Rocha, A.V. and Goulden, M.L. 2009. Why is marsh productivity so high? New insights from eddy covariance and biomass measurements in a Typha marsh. Agriculture and Forest Meteorology. 149: 159–168. doi:10.1016/j.agrformet.2008.07.010.
-
Temmerman, S., Govers, G., Meire, P., Wartel, S., 2003. Modelling long-term tidal marsh growth under changing tidal conditions and suspended sediment concentrations, Scheldt estuary, Belgium. Marine Geology. 193(1–2): 151–169.
-
Van de Broek, M., Temmerman, S., Roel Merckx, R. and Govers, G. 2016. The importance of an estuarine salinity gradient on soil organic carbon stocks of tidal marshes. Biogeosciences Discussion. 285: 2–36.
-
Walkley, A. and Black, I.A. 1934. An examination of the Degtjareff method for determining soil organic matter, and a proposed modification of chromic soil titration method. Soil Science. 37(1): 29-38.
-
Wang, J.J., Dodla, S.K., Delaune, R.D., Hudnall, W.H. and Cook, R.L. 2011. Soil carbon characteristics in two Mississippi river deltaic marshland profiles. Wetlands 31: 157–166. doi:10.1007/s13157-010-0130-y.
-
Weiss, C., Weiss, J., Boy, J., Iskandar, I., Mikutta, R. and Guggenberger, G. 2016. Soil organic carbon stocks in estuarine and marine mangrove ecosystems are driven by nutrient colimitation of P and N. Ecology and Evolution 6(14): 5043-5056.
-
Wieski, K., Guo, H.Y., Craft, C.B. and Pennings, S.C. 2010. Ecosystem functions of tidal fresh, brackish, and salt Marshes on the Georgia coast. Estuaries and Coasts 33: 161–169. doi:10.1007/s12237-009-9230-4.
-
Weiss, C., Weiss, J., Boy, J., Iskandar, I., Mikutta, R. and Guggenberger, G. 2016. Soil organic carbon stocks in estuarine and marine mangrove ecosystems are driven by nutrient co-limitation of P and N. Ecology and Evolution. 6(14): 5043–5056.