Email: cestvr@ces.iisc.ac.in
SOLAR ENERGY – THE SUSTAINABLE ENERGY OPTION IN KARNATAKA
ABSTRACT
Solar energy incident on the earth’s surface primarily depends on parameters like geographic location, earth-sun movements, tilt of the earth’s rotational axis and atmospheric attenuation due to suspended particles. The intensity of solar energy insolation quantifies the solar resource potential or availability of a region. A techno-economic analysis of the solar power technologies and a prospective utilization of wasteland in each taluk demonstrate the immense power generation potential with the prospects of greenhouse gases (GHG) emission reduction. Karnataka has a very good solar potential which gets an average insolation more than 5 kWh/m2/day, having about 300-330 clear sunny days. The study deals with the prospects and opportunities to harvest nature’s bountiful solar potential to meet the decentralized energy demand by all regions and activities.
Land required for electric power generation (direct or indirect usage) is a major concern due to the associated ecological and environmental concerns such as deforestation, population displacement, pollution of air, water and land environment. Considering the scope of harvesting solar energy at each household’s roof tops, would minimize the demand for land. Approximate area required to install 1kW SPV panels is about 100 m2. Rooftop area required through SPV to meet the monthly household demand of 50-100 units (kWh), would be afraction of 100 m2 (5-6%) as area required is directly proportional to the installed capacity or demand.Similarly, to meet the irrigation energy demand in rural area, the assessment shows that 1to 3% of current wasteland is sufficient.
Analysis the techno-economic aspects of different solar technologies (thermal and photovoltaic) with the current scenario and future challenges have the equal importance in this context. Solar thermal systems and photovoltaic systems are two fundamentally different concepts of solar energy conversion. Solar thermal system concentrates heat energy in solar radiations and transfers that energy to a carrying medium (liquid or gas). Solar photovoltaic directly converts solar radiations into direct current (DC) using photoelectric effect. It uses semiconductor device (silicon) which is called as PV cell. Techno-economic analysis shows the energy harvesting from solar radiations in large scale is feasible considering the other power technologies.
Karnataka is the pioneer in Renewable Energy (RE) based power generation. Though 25% of the energy come from RE sources, majority of the RE potential are still not exploited which include rooftop PV technology and PV installation in waste/barren lands. Currently state is facing electricity deficiency problem where the supply –demand gap is becoming wider. Hence it is recommended that rather than installing capacity fossil fuel based plants, RE based decentralized electric energy generation is effective and reliable.
Karnataka receives an average insolation of 5.55 kWh/m2/day annually. Insolation varies from 4.5 to 7 kWh/m2/day throughout the year. All districts of the state receive average insolation of 5.5 to 6.5 kWh/m2/day annually except Kodagu (5-5.5 kWh/m2/day). This highlights that solar energy based electricity generation would help in meeting the growing energy demand.
The government support and encouragement for decentralized rooftop generation would significantly contribute to meet the present and future electricity demand of the state. A generation based incentive (GBI) would encourage decentralized electricity generation at individual rooftops. Some of the other initiatives to be taken are 1) solar public and road lighting, 2) RE based generation in government organizations and infrastructure, 3) implementation of solar rooftop generation in existing govt. building and financial encourage for the same. Switching over to RE technologies would also help in bringing down GHG emission and pressure on dwindling stock of fossil fuels.
KEYWORDS: Insolation, land use, wasteland, thermal and photovoltaic, photoelectric effect, semiconductor device.
1. INTRODUCTION
Sun is the largest and everlasting energy source. Human civilization is harvesting energy from solar radiations from time immemorial. India being in favorable location in the solar belt (40°S to 40°N) and more than 300 clear sunny days in a year receives plenty of solar energy, which plays an important role in food production (from photosynthesis) and sustains the economic growth of a region [1]. Energy from the sun is received in the form of electromagnetic radiations. About 99% of the solar energy received is in the wavelength band of 0.15-4 µm and about 40% of the radiation received is visible radiation ranges from 0.4 to 0.7 µm [2]. Solar radiations are broadly classified as direct solar radiations, diffused solar radiation and global solar radiation. Depending on the type of incidence direct solar radiation is divided into two types. Radiation received on unit area which is held normal to the solar beam at the earth’s surface in unit time is the direct solar radiation at normal incidence (IN). Direct solar radiation on a horizontal surface is the radiation passing through a horizontal surface in a unit time (IH). This is also called the vertical component of the direct solar radiation. Diffuse solar radiation is the radiation scattered due to suspended particles and cloud (D). Global solar radiation(G) includes both direct and diffused solar radiations. It is the total quantity of solar radiation received on unit horizontal surface area on the earth’s surface in a unit time [3, 4, 7]. The relation between G, D, IN and IH is
IH = (G - D) and IN = ![]() (1)
(1)
where ‘h’ is the angle of elevation of the sun.
Solar energy also referred as insolation,incident on the earth’s surface, primarily depends on parameters like geographic location, earth-sun movements, tilt of the earth’s rotational axis and atmospheric attenuation due to suspended particles [4]. Solar technologies such as Solar Photovoltaic (SPV) and Concentrated Solar Power (CSP) systems utilize solar radiation wavelengths between 0.29-5.5μm as major part of the spectrum gets attenuated in other wavelengths due to either absorption or scattering in the atmosphere. Factors affecting the solar insolation are the solar elevation (at noon), atmospheric particles, duration of the day, and the total amount of water vapor in the air and the type and amount of the cloud. Installation of SPV arrays or CSP systems requires land area and the availability of land in a region is one of the important factors in solar based energy plants [5].
2. SOLAR ENERGY: NEED AND OPPORTUNITIES
India has the second highest population (1.24 billion) in the world. The industrialization, urbanisation and consequent activities have increased the energy demand. Electricity meets a major portion of this energy demand and is notably related to the socio-economic progress of the country. The energy from conventional sources accounts to 87.89%. The Compound Annual Growth Rate (CAGR) of power generation in India since 2005 is 5.2% while there was a peak shortage of 12.7% (over 15 GW) and average Transmission and Distribution (T&D) loss of 27.2% recorded during 2009-2010. The total installed generating capacity in the country has increased by 255% from 58,012 MW (1989) to 2,06,456 MW (2011) [6]. Coal is dominant (56.81%) among conventionalenergy sources.The Integrated Energy Policy (IEPR 2006) in India has envisaged more than 8,00,000 MW (Megawatts) by 2032 which is 5 times the existing power generation capacity. Considering the growing environmental problems coupled with the diminishing stock of fossil fuels, the focus has now shifted to the renewable sources of energy, which as on today accounts to only 12.11%.Globally India ranks fifth in harvesting renewable energy with 15,691.4 MW grid-connected plantsand 367.9 MW off-grid plants [7].
Per capita electricity consumption has gone up by 170 %, from 283 (1992-93) to 765 (2010-11) kWh. The energy/GDP in India is 10-20 times higher than that of the industrialized countries like USA, Japan, etc.), indicating scope for improvement of the efficiencies in energy consumptions. In order to have more disposable energy, plausible approach hence would be to increase the end-use efficiency or to minimize the loss and meeting the energy demand through the renewable sources.
Adrastic growth in the power sector during post-independence is unable to meet every ones’ energy demand evident from about 74 million households still not having access to electricity and nearly 32,800un-electrified villages in the country [8]. This necessitates a decentralized, low-carbon, reliable,efficient and renewable options for energy generation. Key features of RE based generation are;
- Decentralized generation, reducing T&D losses;
- Easier voltage management at substation levels and minimized voltage fluctuations;
- Easier maintenance and reduced pilferages;
- Possibility of remote location electrification [9];
- Scope for decentralized development at local levels with job opportunities due to the assured energy supply and availability of natural resources [10];
- Lowered carbon emissions and scope for availing the benefits under clean development mechanism (CDM) as per Kyoto Protocol;
- Energy independence due to the reduced dependency of fossil fuels and imports.
In this perspective, power sector regulators, central policy makers with state authorities have taken many initiatives to encourage RE generation and usage in the country. Some of the prominent initiatives are discussed below.
2.1. Renewable Purchase Obligation (RPO): RPO is an agreement between Regulatory authorities and the consumers or power supplying utilities. According to this agreement Load Serving Entities (LSE), Open Access customers and Captive Power Plants (CPP) are required to purchase a fixed fraction of annual energy purchase from RE based power plants or they are required to generate that energy by their own. The RPO target is fixed for the energy purchase and not on the total installed capacity [11]. Table 1 gives the state wise RPO (Renewable Purchase Obligation for solar energy in % of total energy purchase) in India.
Table 1: State wise RPO in India (% of total energy purchase)
| State | Order dated | 2010 - 11 | 2011 - 12 | 2012 - 13 | 2013 - 14 | 2014 - 15 | 2015 - 16 | 2016 - 17 | 2017 - 18 | 2018 - 19 | 2019 - 20 | 2020 - 21 | 2021 - 22 |
| Andhra Pradesh | Final-26th July, 2010 | 0.25 | 0.25 | 0.25 | 0.25 | ||||||||
| Assam | Draft-21st June, 2010 | 0.05 | 0.1 | 0.15 | 0.2 | 0.25 | |||||||
| Bihar | Final-16th November, 2010 | 0.25 | 0.5 | 0.75 | 0.1 | 1.25 | |||||||
| Chhattisgarh | Draft – 9th November 2010 | 0.25 | 0.25 | 0.25 | |||||||||
| Gujarat | Final-17th April, 2010 | 0.25 | 0.5 | 1 | |||||||||
| Haryana | Final-November, 2010 | 0.25 | 0.5 | 0.75 | 1 | 1.25 | 1.5 | 1.75 | 2 | 2.25 | 2.5 | 2.75 | 3 |
| Himachal Pradesh | Final-12th March, 2010 | 0.1 | 0.1 | 0.1 | |||||||||
| Jharkhand | Final-31th March, 2010 | 0.25 | 0.5 | 1 | |||||||||
| Karnataka | Final-16th March, 2011 | 0.25 | |||||||||||
| Kerala | Final-23rd November, 2010 | 0.25 | |||||||||||
| Madhya Pradesh | Final-19th November, 2010 | 0.4 | 0.6 | 0.8 | 1 | 0.5 | |||||||
| Maharashtra | Final-7th June, 2010 | 0.25 | 0.25 | 0.25 | 0.5 | 0.5 | |||||||
| Manipur (JERC) | Final-5th May, 2010 | 0.25 | 0.25 | 0.25 | |||||||||
| Meghalaya | Final-21st December, 2010 | 0.2 | 0.3 | 0.4 | |||||||||
| Mizoram (JERC) | Final-5th May, 2010 | 0.25 | 0.25 | 0.25 | |||||||||
| Nagaland | Final-20th October, 2010 | 0.25 | 0.25 | 0.25 | |||||||||
| Orissa | Final-16th March, 2010 | 0.5 | 0.75 | 1 | 1.25 | ||||||||
| Rajasthan | Final-31st January, 2011 | 100 MW (PPA*) | 0.5 | 0.75 | 1 | ||||||||
| Tamil Nadu | Draft-19th May, 2011 | 0.15 | 0.25 | 0.25 | |||||||||
| Tripura | Draft-9th November, 2009 | 0.1 | 0.1 | 0.1 | |||||||||
| Uttar Pradesh | Final-17th August, 2010 | 0.25 | 0.5 | 1 | |||||||||
| Uttarakhand | Final-6th July, 2010 | 0 | 0.03 | 0.05 | |||||||||
| WB (total RE) | Final-10th August, 2010 | 2 | 3 | 4 | 5 | 6 | 7 | 8 | 9 | 10 |
*Power Purchase Agreement
2.2. Renewable Energy Certificate (REC) mechanism: REC mechanism provides a choice to the customer or utility so that RE generated can be sold at pre decided tariffs. This will help to utilize locally available RE source potential to generate energy and also enables energy trading option.
REC is a market based aspect which helps customers and utilities to meet their obligations. It is not related to carbon credits but traded through auction in power exchanges. REC price is determined once a month and quantified considering at least one MWh of electricity injected into the grid from renewable energy sources [12].
2.3. Policy Initiatives: The National Action Plan of Climate Change (NAPCC) set the target of 5% purchase of electrical energy from RE based generation (FY 2009-10), which is to be increased by 1% per year for the next 10 years. Various federal governments in the country have also taken up many initiatives through incentives to boost the RE sector. The Ministry of New and Renewable Energy Resources (MNRE), Government of India formulated Electricity Act 2003 realizing the scope of RE sector. Major highlights are;
- The State Electricity Regulatory Commissions (SERCs) to specify, for the purchase of electricity from RE sources, a percentage of the total consumption of electricity in the area of a distribution licensee.
- SERC has to promote co-generation and RE based generation with suitable measures to connect grid or to supply local consumers.
- Friendly tariff structure to encourage co-generation and RE based generation by SERC.
- SERCs have to specify a Renewable Purchase Obligation (RPO) with the specified feed-intariff and other terms and conditions to promote co-generation and/or generation of electricity from renewable energy sources.
Subsequent, policy interventions are:
-
National Electricity Policy 2005: Emphasis on the share of electricity from RE sources and purchase by distribution companies shall be through competitive bidding process.
-
National Tariff Policy 2006: NTP, 2006 mandates that SERCs purchase a minimum percentage of energy from renewablesources. This policy was further revised to include solar power purchase obligation of 0.25% in Phase 1 with the expected growth of 3% by 2022.State utilities can also purchase solar‐specificRenewable Energy Certificates (RECs) from participating projects [13].
2.4. Feed-in Tariffs (FITs)were introducedto encourage the RE based generation. It is basically a payment given for the consumer for generating electricity from RE sources and feeding it to the grid. FIT is fixed by the power supplying utilities based on the generation cost or the present per unit cost of electricity. Normally the FIT is fixed for certain years in order to encourage the consumer to have long term generation of electricity from all RE sources. Federal states in India have separate FIT structure for RE generation [14-16]. State wise FIT structure for solar PV and solar thermal generation is given in the Table 2.
Table 2: State wise Feed-In tariff (FIT) structure for solar power plants in India
| State | Order Dated | Tariff structure (Rs/kWh) |
Tariff period (Years) |
Incentives | |
| Solar PV | Solar Thermal | ||||
| Andhra Pradesh | Overall- Rs. 17.91 without Accelerated depreciation (AD) and Rs. 14.95 with AD | 25 | |||
| Assam | Draft-13.07.2010 | Rs. 5.50 for 1st year and 3% increment in every subsequent year | 25 | ||
| Bihar | Final-02.08.2010 | Overall - Rs. 10.9 without AD and Rs. 9.85 with AD | 25 | ||
| Chhattisgarh | Final-09.07.2010 | Rs. 15.84 (1 MW and above) | Rs. 13.26 (1 MW and above) | 10 | Additional Rs. 3.84/kWh for SPV and 3.26/kWh for solar thermal (1 MW and above) |
| Delhi | Final-09.072010 | Rs. 17.91 | Rs. 15.31 | ||
| Gujarat | Final-31.08.2010 | Rs. 15 for (for initial 12 years) and RS. 5 (from 13th to 25th year) | Rs. 11 (for initial 12 years) and RS. 4 (from 13th to 25th year) | 25 | |
| Haryana | Final-08.07.2010 | Rs. 9.18 for Crystalline SPV and Rs. 8.90 for thin film SPV | 25 | ||
| Jammu & Kashmir | Final-02.06.2010 | Rs. 17.91 | Rs. 15.31 | ||
| Jharkhand | Final-23.06.2010 | Rs. 17.91 | Rs. 15.31 | ||
| Karnataka | Final-13.07.2010 | Rs. 14.50 | Rs. 11.35 | 25 | |
| Kerala | Final-01.01.2009 | Overall- Rs. 15.18 (including incentives) | 10 | Maximum of Rs. 10/kWh for solar thermal projects (commissioned by 31.12.2009 ) and Rs. 9.50/kWh for solar thermal and Rs. 11.40/kWh for SPV for projects (commissioned after 31.12.2009) | |
| Madhya Pradesh | Final-06.07.2010 | Rs. 15.35 (>2 MW and for rooftop PV upto 2 MW 15.49) | Rs. 11.26 | 25 | |
| Maharashtra | Final-07.06.2010 | To be higher by Rs.0.50/kWh or such higher amount as decided by commission | 25 | ||
| Orissa | Final-09.07.2010 | Overall - Rs. 15.39 | 25 | Rs. 3.13/kWh | |
| Punjab | Overall – Rs. 10.39 | 25 | Accelerated depreciation Rs. 1.04/kWh | ||
| Rajasthan | Final-29.09.2010 | Rs. 15.32 (commissioned by 31.03.2012) |
Rs. 12.58 (commissioned by 31.03.2013) | 25 | |
| Tamil Nadu | Final-08.07.2010 | Overall – Rs. 15.51 | 25 | Accelerated depreciation Rs. 3.35/kWh | |
| Uttar Pradesh | Final-22.06.2010 | Rs. 5.50 (for 1styear and increment of 3% every year) | 25 | ||
| Uttarakhand | Final-06.07.2010 | Overall – Rs. 17.7 | 25 | Accelerated depreciation Rs. 1.65/kWh | |
| West Bengal | Final-10.08.2010 | Rs. 16.13 (100 kW to 2 MW) |
25 | ||
3. OBJECTIVE
Objectives of the current study are
- Assessmentof solar energy potential-region and month wise;
- Assessment of rooftop available in the region;
- Estimating the wasteland required to harvest electrical energy using solar PV technology to meet the present demand in all districts; and
- To suggest viable approaches for harvesting electricity from solar sources.
4. MATERIAL AND METHOD
4.1. Study Area: Karnataka
Karnataka is located between 74.2° to 78.5° longitudes and 11.3° to 18.8° latitudes covering the area of 1,91,791 km2 (Figure 1). It is the 8th biggest state of the country with population density of 320/km2. Karnataka state is located in peninsular India and has 30 districts, 176 Taluks with more than 29,000 villages. State receives an average rainfall of 3,638 mm per annum and annual average insolation of 5.55 kWh/m2/day. Figure 1 gives the overview of the state.
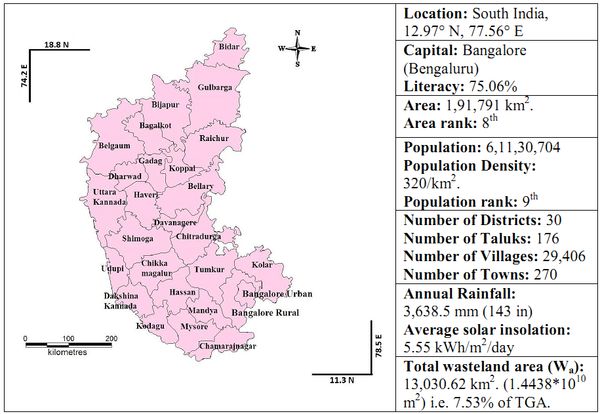
Figure 1: Overview of Karnataka
(Source: Census of India 2011; Directorate of Economics and Statistics, GoK and Wastelands Atlas of India 2011)
4.2. Quantification of Solar Potential
NASA SSE Global insolation datasets are derived from a physical model based on the radiative transfer in the atmosphere along with parameterization of its absorption and scattering properties. The primary inputs to this model include visible and infrared radiation, cloud and surface properties, temperature, perceptible water, column ozone amounts and atmospheric variables such as temperature and pressure measured using diverse satellite instruments. The long wave and shortwave solar radiations reflected to the satellite sensors along with the collected primary inputs are studied to obtain the global insolation for different locations and durations. The 1°X1° spatial resolution SSE global insolation data derived from NASA SSE web portal – (http://eosweb.larc.nasa.gov/sse/) for a period of 22 years (July 1st, 1983 to June 30th, 2005) were validated (RMSE of 10.28%) with Baseline Surface Radiation Network (BSRN) data available as daily, monthly and annual averages obtained from measured values every 3 hours [17,18].
In this study, the state wise NASA SSE monthly average Global insolation data is collected for more than 900 grids which optimally cover the entire topography of India within the latitudes 8° to 38°N and longitudes 68° to 98°E. A geo-statistical bilinear interpolation is employed to produce monthly average Global insolation maps for all the states.The Direct insolation is given by
I = (G – D)/sin Φ (2)
where G is the Global insolation, D is the diffuse component and Φ is the sun’s elevation angle.
4.3. Sector wise Electrical Energy consumption
Sector-wise electrical energy consumption from 2002-03 to 2010-11 is listed in Table 3. Consumption has increased gradually from 21698.23 GWh (2002-03) to 36975.2 GWh (2010-11). Figure 2 shows the relativeincrease in the consumption of electrical energy by various sectors during 2002-03 to 2010-11. State is currently facing electric energy deficiency as consumption has exceeded the generation.
Table 3: Sector wise electric energy consumption in GWh
| Year | Domestic | Commercial | Agri. /Irgn. | Industry | Others | Total |
| 2002-03 | 4251.95 | 1162.76 | 8507.91 | 6504.78 | 1270.83 | 21698.23 |
| 2003-04 | 4462.13 | 1616.15 | 8992.48 | 6068.46 | 2003.95 | 23143.17 |
| 2004-05 | 4923.79 | 1925.48 | 9323.81 | 6470.47 | 2137.97 | 24781.52 |
| 2007-08 | 6322.94 | 3549.87 | 10808.65 | 6903.21 | 2403.27 | 29987.94 |
| 2008-09 | 6876.84 | 4014.53 | 11541.41 | 7266.81 | 2525.83 | 32225.42 |
| 2009-10 | 7360.09 | 4349.48 | 11894.9 | 7513.47 | 2692.39 | 33810.33 |
| 2010-11 | 8280.84 | 5018.51 | 12435.2 | 8442.11 | 2798.54 | 36975.2 |
(Note: Electrical energy consumption data for year 2005-06 and 2006-07 is not available)
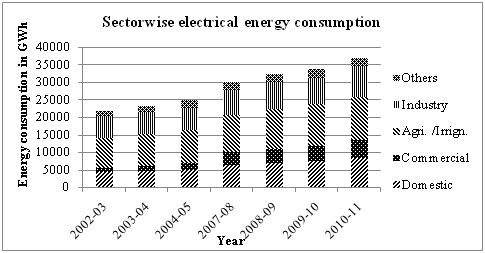
Figure 2: Sector wise electrical energy consumption from 2002-03 to 2010-11
Figure 3 illustrates the sector wise electrical energy consumption in 2010-11. Agricultural and irrigation pump sets tops the consumption with 34% (12435.2 GWh), followed by industrial sector (23%, 8442.11 GWh), domestic (22%, 8280.84 GWh) and commercial sector (14%, 5018.51 GWh).
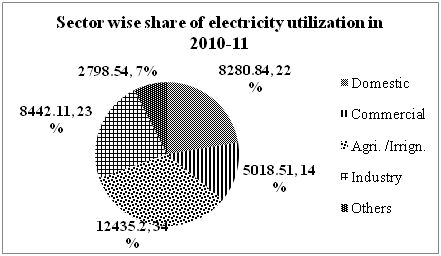
Figure 3: Sector wise share of electric energy consumption (2010-11)
Figure 4 gives the share of energy from various sources, where coal powered thermal power generation constitutes a major share (45%), followed by hydropower (27%) and renewable sources of energy (Renewable Energy: RE) sources (24%). Diesel and nuclear energy sources supply a small share of 4% (2% by each source).
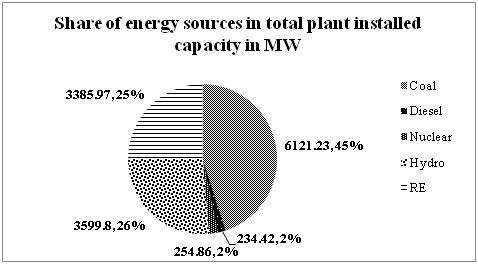
Figure 4: Share of various energy sources in total installed plant capacity
(Source: CEA, India)
5. RESULTS AND DISCUSSION
5.1 Solar energy utilization in Karnataka
Solar energy is used as both grid interactive system and as off grid solar system in Karnataka. It has 6 MWp grid interactive system and 29.41 kWp capacity stand alone solar power plants. The off grid solar systems in the state are given in Table 4.
Table 4: Solar energy utilization in Karnataka (as on 31.03.2011)
|
|
|
Street lighting 2,694 in nos. SPV pumps 551 in nos. House lighting 36,134 in nos. Solar lantern 7,334 in nos. Solar cookers 253 in nos. Power plants 255.41kWp |
As of March 2013, state has cumulative installed capacity of 14 MW from solar energy under different schemes by the government. Table 5 gives the details of the installed solar power plants in Karnataka.
Table 5: Installed solar power plants in the state
| Installer | Capacity (MW) | Technology | Scheme |
| Karnataka Power Corporation Limited (KPCL) | 5 | Solar PV | JNNSM |
| KPCL (Kolar) | 3 | Solar PV | Arunodaya Scheme |
| KPCL (Raichur) | 3 | Solar PV | Arunodaya Scheme |
| KPCL (Belgaum) | 3 | Solar PV | Arunodaya Scheme |
| Total | 14 |
5.2. Solar potential in Karnataka
Karnataka receives an average insolation of 5.55 kWh/m2/day annually. Insolation varies from 4.5 to 7 kWh/m2/day throughout the year (Figure 5). All districts of the state receive average insolation of 5.5 to 6.5 kWh/m2/day annually except Kodagu (5-5.5 kWh/m2/day).
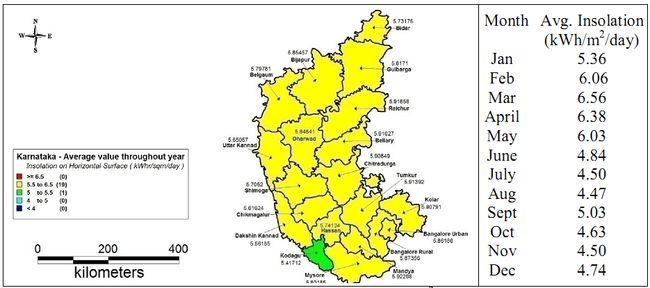
Figure 5: Average annual solar insolation (kWh/m2/day) in Karnataka
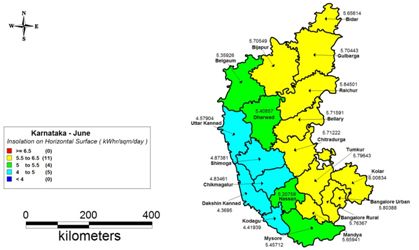
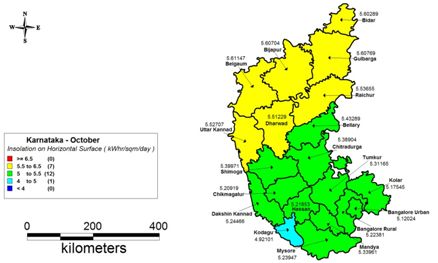
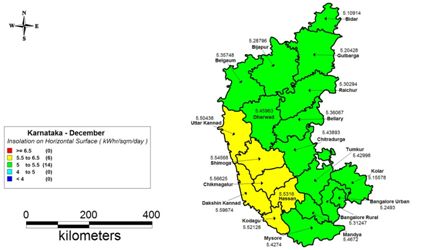
Figure 6 (6.1-6.12) gives the annual global insolation details of the state. Global insolation details of all the districts are shown for every month, Figure 6.1 (January) to Figure 6.12 (December).
|
| During January, except Gulberga and Bidar (5-5.5 kWh/m2/day) all other districts receive the insolation of 5.5-6.5 kWh/m2/day. Over all, state gets an average insolation of 5.36 kWh/m2/day in this month. |

|
| During February, most of the districts receive insolation ranging from 5.5-6.5 kWh/m2/day except Dakshina Kannada and Mandya which gets higher insolation over 6.5 kWh/m2/day. |
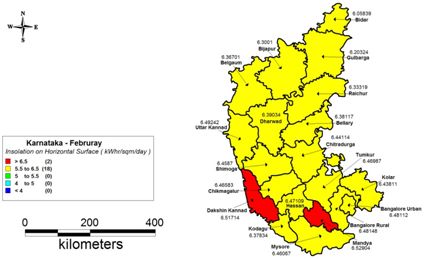
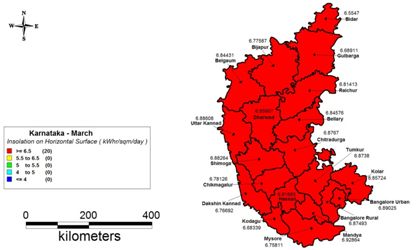
Figure 6.3: Solar potential during March
|
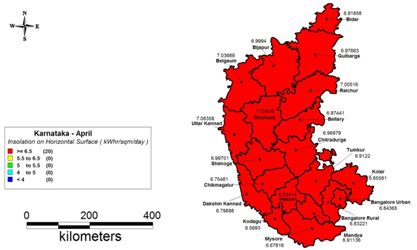
| Figure 6.3 and 6.4 shows the insolation received in March and April; state gets highest insolation in these months. All the districts of the state receive the insolation more than 6.5 kWh/m2/day. |
|
| During May, 5 districts in the south-west region receive insolation of 5.5-6.5 kWh/m2/day and other districts get insolation over 6.5 kWh/m2/day. |

|
| Districts in the coastal region gets lower insolation of 4-5 kWh/m2/day in June. Mysore, Hassan, Dharwad and Belgaum receive the insolation of 5-5.5 kWh/m2/day in this month. All other districts receive insolation of 5.5-6.5 kWh/m2/day. |
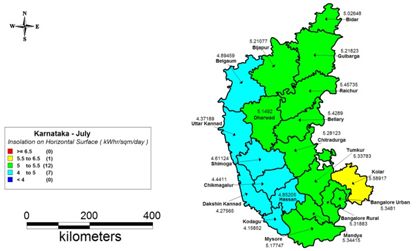
|
| Districts in the western region (coastal region) gets lower insolation of 4-5 kWh/m2/day in July. Other 12 districts except Kolar (5.5-6.5 kWh/m2/day) receive insolation of 5-5.5 kWh/m2/day. |
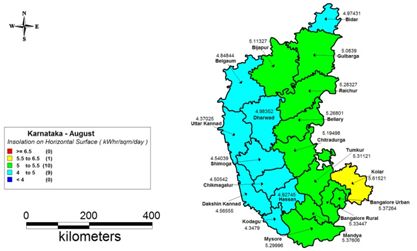
|
| During August, 8 districts in the westrrn region and Bidar get lower insolation of 4-5 kWh/m2/day. Other districts except Kolar (5.5-6.5 kWh/m2/day) get insolation of 5-5.5 kWh/m2/day. |
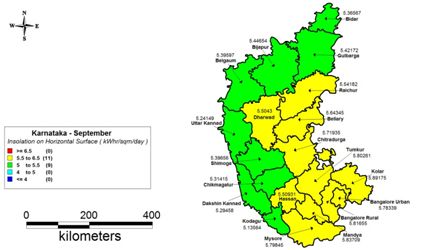
|
| During September, all districts in the western part and northern part of the state receive insolation of 5-5.5 kWh/m2/day. Other 11 districts get higher insolation of 5.5-6.5 kWh/m2/day. |
|
| During October 7 districts in the northern part of the state receive insolation of 5.5-6.5 kWh/m2/day. Southern districts get insolation of 5-5.5 kWh/m2/day, but kodagu gets lowest insolation in this month (4-5 kWh/m2/day). |
|
| Most of the districts of the state receive insolation of 5-5.5 kWh/m2/day except Kolar (4-5 kWh/m2/day) and Uttara Kannada (5.5-6.5 kWh/m2/day) in November. |

|
| During December, Uttara Kannada, Dakshina Kannada, Shimoga, Chikkamagalur, Hassan and Kodugu receive insolation of 5.5-6.5 kWh/m2/day. All other districts receive insolation of 4-5 kWh/m2/day. |
5.3. Land requirement
Land use by power plants is one of the major factors to be considered in the early planning of any power plant. The assessment shows that to setup 1 kW solar power plant (SPV based) land required is about 100 m2. Scope for solar energy is assessed considering i) the present energy demand, ii) extent of wasteland available in the region, and iii) scope for rooftop based SPV for meeting the respective household demand.
5.4. District wise availability of wastelands and barren land
Table 6 summarizes the district wise waste land and barren land in the state as per the ATLAS of wastelands (2011). Availability of wasteland in Karnataka ranges from 1.88% (Bijapur) to 15.88% (Bellary) of TGA (Total Geographical Area). Unproductive barren land ranges from 0.02% (Haveri) to 1.58% (Raichur)
Table 6: District wise distribution of wastelands and barren lands in km2
| Districts | TGA (km2) | WL (NRSC) (km2) | % of WL in TGA | Barren Land* (km2) | % of Barren Land in TGA | % of Barren Land in WL |
| Bagalkot | 6575 | 787.55 | 11.98 | 82.75 | 1.26 | 10.51 |
| Bangalore Rural | 5815 | 588.27 | 10.12 | 87.86 | 1.51 | 14.94 |
| Bangalore Urban | 2190 | 90.3 | 4.12 | 1.68 | 0.08 | 1.86 |
| Belgaum | 13415 | 1108.38 | 8.26 | 1.31 | 0.01 | 0.12 |
| Bellary | 8419 | 1336.8 | 15.88 | 75.41 | 0.90 | 5.64 |
| Bidar | 5448 | 383.01 | 7.03 | 2.12 | 0.04 | 0.55 |
| Bijapur | 10494 | 198.43 | 1.89 | 44.71 | 0.43 | 22.53 |
| Chamarajanagar | 5685 | 373.94 | 6.58 | 5.41 | 0.10 | 1.45 |
| Chikmagalur | 7201 | 284.96 | 3.96 | 14.65 | 0.20 | 5.14 |
| Chitradurga | 8440 | 935.97 | 11.09 | 77.79 | 0.92 | 8.31 |
| Dakshina Kannada | 4843 | 172.88 | 3.57 | 26.99 | 0.56 | 15.61 |
| Davanagere | 5966 | 483.81 | 8.11 | 4.87 | 0.08 | 1.01 |
| Dharwad | 4230 | 112.38 | 2.66 | 0.6 | 0.01 | 0.53 |
| Gadag | 4657 | 305.75 | 6.57 | 16.13 | 0.35 | 5.28 |
| Gulbarga | 16224 | 994.35 | 6.13 | 107.19 | 0.66 | 10.78 |
| Hassan | 6814 | 328.48 | 4.82 | 5.49 | 0.08 | 1.67 |
| Haveri | 4851 | 137.14 | 2.83 | 0.86 | 0.02 | 0.63 |
| Kodagu | 4102 | 107.4 | 2.62 | 3.25 | 0.08 | 3.03 |
| Kolar | 8223 | 752.8 | 9.15 | 129.11 | 1.57 | 17.15 |
| Koppal | 7189 | 472.42 | 6.57 | 53.06 | 0.74 | 11.23 |
| Mandya | 4961 | 374.41 | 7.55 | 35.29 | 0.71 | 9.43 |
| Mysore | 6269 | 115.71 | 1.85 | 1.82 | 0.03 | 1.57 |
| Raichur | 6828 | 658.25 | 9.64 | 108.14 | 1.58 | 16.43 |
| Shimoga | 8465 | 481.53 | 5.69 | 2.98 | 0.04 | 0.62 |
| Tumkur | 10598 | 623.77 | 5.89 | 102.16 | 0.96 | 16.38 |
| Udupi | 3598 | 181.45 | 5.04 | 36.75 | 1.02 | 20.25 |
| Uttara Kannada | 10291 | 640.48 | 6.22 | 7.59 | 0.07 | 1.19 |
| Total | 191791 | 13030.62 | 6.79 | 1035.97 | 0.54 | 7.95 |
*Barren Lands: Sands-Coastal, Sands-Desertic, Sands-Semi Stab.-Stab>40m, Sands-Semi Stab.-Stab 15-40m, Mining Wastelands, Industrial wastelands, Barren Rocky/Stony waste.
5.5. Scope for electricity generation using solar potential
Electric energy can be harvested directly from solar radiations using solar photovoltaic (SPV) cells (modules). These SPV modules can be mounted on rooftop (domestic supply) or can be installed in an outdoor area (wasteland/barren land) for higher capacity of generation which shall meet the irrigation demand.
5.5.1. Solar rooftop PV technology
About 68.43% of the population lives in rural areas of the state where the domestic electrical energy consumption ranges from 40 to 60 kWh per month per household. In rural area per capita energy consumption is about 10 to 12 kWh/month. This domestic demand can be supplied using solar PV installation on the rooftop where the average rooftop area available is 109.83 m2. Figure 7 shows the digitization of rural and urban household rooftop in the state. To generate 60 kWh per month using rooftop solar PV technology, roof area required is about 4.12% (3.62 m2) of the total area available (η=10%, effective area = 80% of available area).
In a typical urban household the available rooftop area is about 1,200 sq. feet (112 m2) in which 80% of the area can be optimized for solar energy harvesting. The average electricity consumption in urban area ranges from 100 to 150 kWh. This domestic energy demand can be met by rooftop PV installation which utilizes 10.1% (9.1 m2) of the available roof top area.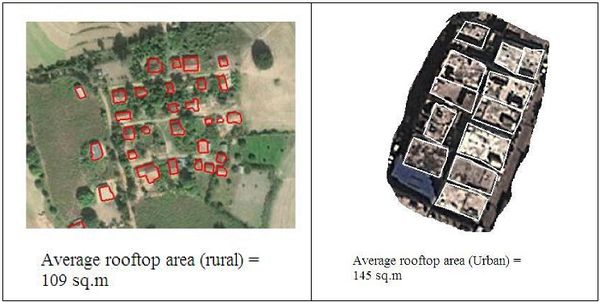
Figure 7: Digitized images of urban and rural household rooftop area (Google Earth image 2012)
5.5.2. Electric energy harvested from solar energy using wasteland
Figure 8 shows the month wise electric energy that could be generated using 2% of wasteland area (260.61 km2 or 25.1% of the barren lands) and the average demand. The estimate shows that the electricity generated would be at least 1.9 times higher than the present demand (2010-11).
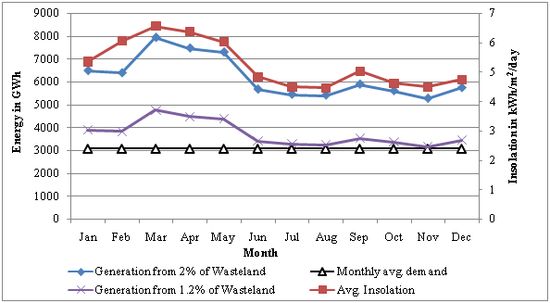
Figure 8: Electrical power generation from wasteland with monthly average demand and average insolation
Figure 8 also gives the wastelands required (1.2%, 156.36 km2) to generate sufficient electrical energy which could meet the present electricity demand (36,975 GWh) in Karnataka.
6. RECOMMENDATIONS FOR SUSTAINABLE ENERGY DURING 21ST CENTURY
Solar energy based generation seems promising and environmental friendly option to meet the growing demands. India is blessed with the good solar potential and harvesting this potential would minimize the environmental implications associated with the fossil fuels. Solar PV technology has the potential to meet the domestic and irrigation demandsin the decentralized way. Appropriate policy incentives might help in the large scale deployment of solar devices at household levels. There is a need to focus on energy efficient decentralized electricity generation technologies with micro grid and smart grid architecture, which would go long way in meeting the energy demand. In this regard, suggestions are:
-
Electricity generation using SPV and CSP technologies would bridge the demand supply gap as India receives abundant solar energy of more than 5 kWh/m2/day for about 300 days in a year. The adequate potential with mature technologies and apt policy incentives would help in meeting the electricity demand in a region.
-
Roof top based SPV would help in meeting the household energy demand in rural as well as urban households. Rural household require about 70-100 kWh per month and to meet this requirement 5-6 m2 rooftop is adequate (at η=10%, and insolation of 5 kWh/m2/day) and the average rooftop in rural locations in Karnataka is about 110 m2 and about 115 m2 in urban localities.
-
Adequate barren /waste land is available in Karnataka as the available waste land is about 7% of the total geographical area less than 1% area is sufficient to generate electricity required for irrigation and domestic sector through SPV installation.
-
SPV installation in waste/barren lands supports decentralized electricity generation and enables multi utilization of the area for activities such as grazing, livestock farming, etc. About 45 million households are still not electrified in India, which have potential to generate enough electricity from rooftop SPV installation; rooftop SPV installation would be the revolutionary method of rural electrification.
-
Rooftop SPV installation is the most adoptable technology in highly populous countries like India, where the monthly electricity consumption of a household ranges from 50 to 100 kWh.Encouragement for roof top SPV based electricity generation rather than centralized generation through incentives, financial aid for initial installation and tax holidays.
-
Rs. 4.00 per unit for first five years (comparable to subsidies granted to mini hydel projects, the power purchase at Rs 3.40) and Rs.3.50 for the next two years for the electricity generated from roof top solar PV.
-
Buyback programmes for the electricity generated at household level and in micro grid -GBI of Rs. 5 to be provided for electricity generation (< 5 kW) feeding to the grid by SPV.
-
Free solar home lighting (with LED lamps) under the Chief Minister’s Solar Powered Green House Scheme (CMSPGHS), Government of Karnataka or JNNSM (Jawaharlal Nehru National Solar Mission, Government of India).
-
All street lights and water Supply installations in local bodies to be energized through solar power (or hybrid mechanism) in a phased manner
-
Install solar rooftops in all new government/local body buildings - implementation of solar rooftops could be in a phased manner in the existing government/local body buildings, etc.
-
Exemption from payment of electricity tax to the extent of 100% on electricity generated from solar power projects used for self-consumption/sale to utility to be allowed for at least10 years.
-
Fixing of standards for quality installation.
-
Commercial lighting in advertisement boards should only be from SPV panels. Complete ban on usage of grid electricity for these purposes.
-
Impetus to energy research through generous funding for the R and D activities to ensure further improvements in the grid, technologies, two way communication energy meters (to connect rooftop generation with existing grid), efficient luminaries’ production, low cost wiring, switchgears, appliances, etc.
-
Energy education (focusing mainly on renewable energy technologies, end-use energy efficiency improvements, energy conservation) at all levels. School curriculum shall include renewable energy (RE) concepts.
-
Awareness about energy independence and the necessity of RE sources in the present gloomy energy scenario to the consumers
-
Education and awareness about applications and importance of renewable energy sources.
-
Capacity building of youth through technical education for installation and servicing of SPV panels.
-
Diploma /ITI courses with hand-on training on renewable energy technologies in all taluks
-
Setting up service centers in block development offices to meet the requirement of service support for RE technologies (Solar, biogas, energy efficient chulas, etc.).
-
Periodic revision of FIT structure and incentives to encourage the consumers.
- Mandatory one week capacity building / training programmes to all bureaucrats and energy professionals at the initial stages of the career. This is essential as lack of awareness/knowledge among the bureaucrats is the major hurdle for successful dissemination of renewable energy technologies in India
To supply electricity to households in remote areas entails investment on infrastructure apart from transmission and distribution (T&D) loss of electricity. Current assessment reveals that T&D loss in Karnataka is about 19.5% resulting in the loss of 7,210.16 GWh (annual demand is 36,975.2 GWh in 2010-11) of energy. Cost of energy loss ranges from Rs. 1,514.13 crores (@ Rs. 2.10/kWh) to Rs. 5,047.11 crores (@ Rs. 7/kWh) depending upon the tariff (in the respective state).
Decentralized generation of electricity through SPV would help in meeting the respective household’s electricity demand apart from the removal of T&D losses. Generation based incentives (GBI) would herald the decentralized electricity generation, which would help in boosting the regional economy. Considering the current level of T & D losses in centralized system, inefficient and unreliable electricity supply, it is necessary to promote decentralized energy generation. Small capacity systems are efficient, economical and more importantly would meet the local electricity demand. The incentive could be
7. CONCLUSION
Solar energy is the most widely available RE source for decentralized energy generation through PV and thermal energy conversion. Geographic information system (GIS) based insolation data is used for assessing the potential and design of the system where the variations are in acceptable limit and comparison with ground measurements have given better accuracy. With the knowledge of insolation reception and rooftop digitization, potential assessment is done which revealed only about 5 to 7% of the available rooftop area is sufficient to meet household electricity demand. The fraction of open/wastelands (1 to 3%) in the region can be utilized to meet the electricity demand of irrigation pump sets using solar PV system with micro-grid architecture. Incentives for the generation of electricity from RE sources would boost up the number of installations in future leading to decentralized generation which will scale down dependency on conventional power plants.REFERENCES
- Tariq Muneer, Muhammad Asif and Saima Munawwar 2005. Sustainable production of solar electricity with particular reference to the Indian economy, Renewable and Sustainable Energy Reviews, October 2005.
- Mark Naylor F. and Kevin Farmer C. 1995. Sun Damage and Prevention, Electronic textbook of dermatology, The Internet Dermatology Society, 1995
- Ted Soubdhan, Richard Emillion and Rudy Calif 2009. Classification of daily solar radiation distributions using a mixture of Dirichlet distributions, Solar Energy, July 2009
- Mani A. 1981. Handbook of solar radiation, Allied Publishers, New Delhi, 1981
- Wilbur L. C. 1985. Handbook of Energy Systems Engineering, John Wiley & Sons, USA, 1985
- Ministry of New and Renewable Energy, GoI, Annual Report 2010-11, Viewed on 15th December 2012.
<mnre.gov.in/file-manager/.../strategic_plan_mnre_2011_17.pdf> - Ramachandra T. V., Rishabh Jain and Gautham Krishnadas 2011. Hotspots of solar potential in India, Renewable and Sustainable Energy Reviews, vol. 15, Issue 6, 2011
- Progress Report on Village Electrification, Central Electricity Authority, Government of India, Viewed on December 25 2011 <http://www.cea.nic.in/god/dpd/village_electrification.pdf>
- Ramachandra T. V., Gautham Krishnadas and Rishabh Jain, 2012. Solar Potential in the Himalayan Landscape, International Scholarly Research Network, ISRN Renewable Energy, 2012.
- Ramachandra T V, 2011. Renewable energy transition: Perspective and Challenges, In: Energy India 2020- A Shape of Things to come in Indian Energy Sector, Saket Projects Ltd., Ahmedabad, Pp:175-183
- Ministry of New and Renewable Energy, GoI. Renewable Energy Regulatory Framework. Viewed on January 20th 2013. <http://www.mnre.gov.in/information/renewable-energy-regulatory-framework/>
- Renewable Energy Certificate Registry of India, GoI. Viewed on February 10th 2013. <https://www.recregistryindia.nic.in/index.php/general/publics/index>
- Renewable Purchase Obligation for States. Viewed on 11th 28t March 2013. <ceew.in/pdf/Appendix_F-Renewable_Purchase_Obligation_for_States.pdf>
- Toby Couture D. et al. 2010. A Policymaker’s Guide to Feed-in Tariff Policy Design, Technical Report by NREL, July 2010.
- Pablo del Rio and Miguel Gual A., 2007. An integrated assessment of the feed-in tariff system in Spain, Energy Policy, March 2006.
- Jonathan Lesser A. and Xuejuan Su, 2007. Design of an economically efficient feed-in tariff structure for renewable energy development, Energy Policy, December 2007.
- Surface Meteorology and Solar Energy Release 6.0 Methodology, NASA. Viewed on October 17, 2012. <http://eosweb.larc.nasa.gov/sse/ documents/SSE6Methodology.pdf>
- NREL GHI data furnished by National Renewable energy Laboratory, 2010.