RESULTS & DISCUSSION
Land use Land Cover analysis:
- Vegetation cover of the study area analysed through NDVI (Figure 3), shows that area under vegetation has declined to 9.24% from 51.09%.

Figure 3: Temporal Land cover changes during 1973 – 2009
Table 3: Temporal Land cover details
| Year |
Vegetation |
Non vegetation |
| % |
Ha |
% |
Ha |
| 1973 |
51.09 |
10255.554 |
48.81 |
9583.83 |
| 1989 |
57.58 |
34921.69 |
42.42 |
8529.8 |
| 1999 |
44.65 |
8978.2 |
55.35 |
11129.77 |
| 2009 |
09.24 |
1857.92 |
90.76 |
19625.41 |
- Land use analysis for the period 1973 to 2009 is computed using Gaussian maximum likelihood classifier is given in figure 4. Overall accuracy of the classification of was 75% (1973), 79% (1989), 78% (1999), and 84% (2009) respectively. There has been an enormous growth in built-up area during 1999 to 2009 it can be observed that there was 514% of growth from 1999 to 2010 whereas growth of built up was 1685 % in past four decades. Vegetation cover declined by 923% in past four decades. Other category also had an enormous increase and covers 166 % of the land use. The water category seems to increase which can be attributed to large scale waste water treatment STP’s (ex. Vidyaranyapura, Rayankere, Kesare) covering large area post 90’s. The temporal land use details are given in Table 2. Kappa stats and overall accuracy was calculated and is as listed in Table 5.
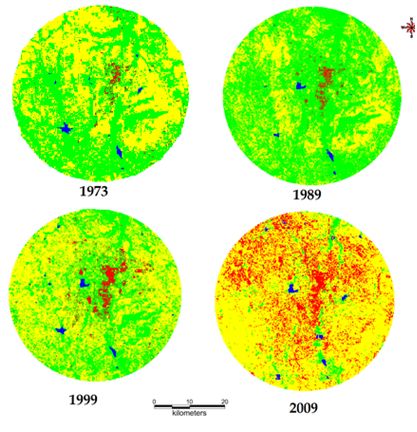
Figure 4:.Classification output of Mysore
Table 4: Temporal land use details for Mysore
| Land use |
Urban |
Vegetation |
Water |
Others |
| Year |
| 1973 |
222.93 |
10705.68 |
124.47 |
9054.99 |
| 1989 |
229.41 |
13242.51 |
78.75 |
6557.4 |
| 1999 |
730.8 |
8360.1 |
117.9 |
10899.2 |
| 2009 |
3757.489 |
1159.336 |
142.58 |
15050.5 |
Total (Land in ha) 20108.91 |
Table 5: Kappa statistics and overall accuracy
| Year |
Kappa coefficient |
Overall accuracy (%) |
| 1973 |
0.76 |
75.04 |
| 1989 |
0.72 |
79.52 |
| 1999 |
0.82 |
78.46 |
| 2009 |
0.86 |
84.58 |
Built up Density Gradient Analysis:
Built up density was minimal in the year 1973 and had a maximum value of 0.026 (considering 3km buffer) in the North east directionin the year 1973. The policy of the government to develop the tier 2 cities other than Bangalore during 1990 gave a boost to the urban area which periodically increased till 1999 which has a maximal value of 0.06 in NE direction. There was a sharp growth in the region in almost all direction from 1999 till 2009, maximum value reaching 0.216 in the NE direction(considering 3km buffer) and. This can be attributed to development of this region with the IT & BT industry which were till then were confined to locations in Bangalore.

Figure 7: Urban density analysis of Mysore (considering 3km buffer)
Calculation of Shannon’s Entropy
Shannon entropy was calculated for the all the years and is listed in Table 6. The value of entropy ranges from zero to log (n). Greater Bangalore grew in all the directions and has almost reached the threshold value of growth (log (n) = log (8) = 0.9). Higher the value or closer to log (n) indicates the sprawl or dispersed or sparse development. Lower the entropy values the development is either aggregated or compact. Lower entropy values of 0.007 (NW), 0.008 (SW) during 70’s shows an aggregated growth. However, the region grew phenomenally with dispersed growth in 90’s and reached higher values of entropy during post 2000’s and reached 0.352 (NE), 0.241 (NW) in 2009. These values may look comparatively lower as the buffer zone is taken into consideration where in the sprawl is rampant and other land use also exists in large hectares. When the Shannon entropy is calculated with just Mysore boundary it has a value of 0.582(NE) and 0.431(NW) indicating the occurrence of sprawl.
Shannon's entropy value of recent time confirms of dispersed haphazard urban growth in the city, particularly in the boundary regions of the city. This also illustrates and establishes the influence of drivers of urbanization in various directions. In order to understand this urbanization phenomena, landscape metrics one of the valuable indicator was then calculated.
Table 6: Shannon Entropy
| |
NE |
NW |
SE |
SW |
| 2009 |
0.352 |
0.341 |
0.234 |
0.205 |
| 1999 |
0.139 |
0.043 |
0.071 |
0.050 |
| 1992 |
0.060 |
0.010 |
0.029 |
0.007 |
| 1973 |
0.067 |
0.007 |
0.026 |
0.008 |
Citation: Bharath H. Aithal, Bharath Setturu, Sreekantha S, Sanna Durgappa D and T. V. Ramachandra, 2012. Spatial patterns of urbanization in Mysore: Emerging Tier II City in Karnataka., Proceedings of NRSC User Interaction Meet- 2012, 16th & 17th, February 2012, Hyderabad.
Dr. T.V. Ramachandra
Energy & Wetlands Research Group, Centre for Ecological Sciences, Centre for Sustainable Technologies (astra), Centre for
infrastructure, Sustainable Transportation and Urban Planning [C
iSTUP], Indian Institute of Science, Bangalore – 560 012, INDIA.
E-mail : cestvr@ces.iisc.ac.in
Tel: 91-080-22933099/23600985,
Fax: 91-080-23601428/23600085
Web: http://ces.iisc.ac.in/energy
Bharath H. AithalCentre for Sustainable Technologies (astra),
Indian Institute of Science, Bangalore 560 012
E-mail:
bharath@ces.iisc.ac.in
Bharath SetturuEnergy & Wetlands Research Group, Centre for Ecological Sciences,
Indian Institute of Science,
Bangalore 560 012
E-mail:
settur@ces.iisc.ac.in
Sreekantha S Centre for
infrastructure, Sustainable Transportation and Urban Planning [C
iSTUP], Indian Institute of Science, Bangalore 560 012
E-mail:
sreekantha.s.rao@gmail.com


