|
Results and Discussion
Based on the consideration and inclusion of various components in ecological perspectives we present four scenarios of total value of provisioning goods and services as follows:
-
Scenario-I: provisional services include timber, NTFP, litter and mulching leaves, fodder, medicinal plants, fuelwood, food, inland fishing and hydrological services;
-
Scenario-II: components in Scenario-I and ecological water;
-
Scenario-III: components in Scenario-II and oxygen services;
-
Scenario-IV: components in Scenario-IV and wild fruits.
The estimated total value of provisioning goods and services are presented in Table 1. Further, Figure 5 portrays the share of different components of total provisioning goods and services in four scenarios. In all four scenarios, NTFP is the major contributor to the total value. The share of the value of food, inland fishing, medicinal plants, fuel wood, fodder, litter and mulching leaves varies from 14% in Scenario-I to 8% in Scenario-IV. These goods have an important bearing on the livelihood of people and especially the livelihood of local people.The value of ecological water, oxygen provision and wild fruits comprises to about forty per cent share in the total value in Scenario – IV. These components are often neglected in valuation of forest and policy making but they play an important role in ecosystem sustenance, biodiversity and thus in human wellbeing in the long run. Talukwise share of provisioning goods and services is given in Figure 6 considering Scenario-IV. The share of value of food, inland fishing, medicinal plants, fuelwood, fodder, litter and mulching leaves in all taluks is around 10 percent of the total share. Figure 6 illustrates that the share of timber is higher in Haliyal and Mundgodtaluks which are under deciduous forests. Considerable share of NTFP is evident in all taluks except Haliyal and Mundgodtaluks.. The value of hydrological services varies across taluks depending upon the extent of water utilization for domestic purpose, irrigation, industrial use and power generation. The other major contributors to the total value of provisioning goods and services are the value of ecological water, oxygen and wild fruits across taluks. Figure 7 presents the talukwise breakup in the total provisioning goods and services of the district. This illustrates that Supataluk contributes the highest amount of provisioning goods and services with Rs. 3,218 crores per year (21% of the district), while Mundgodtaluk contributes the least of Rs. 540 crores per year (3.5% of the district).
Table 1: Total Value of Provisioning Goods and Services in different scenario
| Scenario |
Total Value (in Rs. crore) |
| Scenario – I |
8650.66 |
| Scenario – II |
9282.08 |
| Scenario – III |
12543.62 |
| Scenario – IV |
15159.43 |

Figure 5: Share of Total Value of Provisioning Goods and Services from Forest
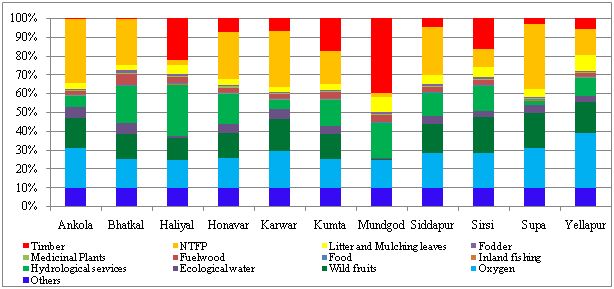
Figure 6: Talukwise Share of Total Provisioning Goods and Services from Forest

Figure 7: Talukwise Total Value of Provisional Goods and Services
Valuation of provisioning goods and services from forest ecosystems is about Rs. 2,05,388/hectare/year, which is implicit in the subsistence, income and local employment. Forestry sector contributes significantly to the district, state and national economy and also to the linked sectors industries, agriculture, fisheries, tourism, health, rural development, energy, etc. Sector-wise district’s Gross District Domestic Product (GDDP) given in Table 2. GDDP of Uttara Kannada is about Rs 5998 croresand forests’ goods is about 180 crores (3% of GDDP), in contrast to the valuation of ecological provisioning services from forest ecosystems of Uttara Kannada district is about Rs.15,159 crores.
Table 2: GDDP of Uttara Kannada with Sectors
| Sector |
Share in Rs. crore |
Share % |
| Primary Sector (Agriculture, Forestry, Fishing, Mining) |
1060 |
18 |
| Forestry and Logging Sector |
180 |
3 |
| GDDP of Utttara Kannada |
5978 |
100 |
Source: Directorate of Economics and Statistics, Government of Karnataka.
The forest products included in the national income account framework includes: (a) Industrial wood (timber, match and pulpwood) and fuelwood and (b) minor forest products (Haripriya, 2001). It includes only the recorded values by forest department and thus all other benefits from forests are unaccounted in the national income. This necessitates relook at the current approach of computations of Gross domestic district product (GDDP), State Domestic Product (SDP) and Gross Domestic Product (GDP). Gross underestimation and non-accounting of natural resources and forest resources in particular is responsible for unsustainable utilization of natural resources. Under valuation of ecosystem goods and services is evident from GDDP of Rs. 5978 crore in 2009-10 (at current prices), which accounts as the sectoral share of forests of Rs. 180 crores contrary to Rs. 15159 crores.
|
