Results and Discussion
Physico-chemical monitoring of selected lakes
Table 3 lists physico-chemical properties of water samples across 12 lakes chosen for the current study, which showed marked variations in all the physico-chemical parameters due to seasonal variations and anthropogenic activities.
Water temperature
Water temperature is one of the important factor in an aquatic environment influencing all the metabolic and physiological activities and life processes (like feeding, reproduction, movements and distribution) of aquatic organisms (Rani et al. 2012). Water temperature showed both the seasonal and diurnal variations with higher values in Begur, Doddakalsandra, Chunchunghatta, Subbrayankere, Hulimavu, Madivala, and Kodagisingasandra lakes (sampled during the afternoon). The average water temperature ranged from 23.05°C-28.07°C.
pH
pH of water changes with time due to exposure to air, variation in temperature and due to biological activities. pH is governed by the equilibrium between carbon dioxide, carbonate and bicarbonate ions. pH in most of the lakes except Arekere was alkaline due to the excessive growth of algae. Average pH ranged from 7.8-9.38 except Arekere and beyond the limits of BIS (IS: 10500, 1992; guidelines of 6.5–8.5). Relatively lower pH in Arekere is due to the luxuriant growth of emergent (Typha angustata, Alternanthera phyloxeroides) macrophytes, similar to the earlier report of Yamoussoukro’s lake system by Parinet et al. (2004).
Electrical conductivity (EC)
Electrical conductivity (EC) depends on the concentration and nature of the ionized substances dissolved in water representing the total ion content (Zacheus and Martikainen 1997). EC in sampled lakes ranged from 472.88-2589.95μS/cm. Average EC of Doddakalsandra, Begur and Kodagisingasandra exceeded the WHO (2004) guidelines of 1500 μS/cm denoting the high inputs of sewage and domestic waste waters, comparable to Yamoussoukro’s lake system (Parinet et al. 2004). Increased evaporation during the dry period has concentrated the ionic contents in water which also raised the conductivity values. Electrical conductivity of 2589.95μS/cm was recorded at Begur due to sodium ion concentrations with excessive use of detergents for washing clothes and vehicles in the lake.
Total Dissolved Solids (TDS)
TDS indicate the concentrations of common ions (e.g., sodium, potassium, calcium, magnesium, chloride, sulfate, and bicarbonate) in freshwaters. TDS of most lakes excluding Lalbagh, Sankey, Yediyur and Subbrayankere exceeded the limits of 500mg/l according BIS and ICMR standards. TDS ranged from 211.64mg/l-1319.67mg/l. Highest TDS at Begur Lake was due to the presence of high concentrations of major cations as well as anions in the lake. A high content of dissolved solids elevates density of water, influences osmoregulation, and reduces gas solubility and utility of water for drinking, irrigation and industries (Manivasakam 2003).
Dissolved Oxygen (DO)
Dissolved oxygen in aquatic systems is a very important as it affects physical, chemical and biological processes in the system. The depletion of oxygen also indicates the presence of high organic loads in the lake (Trivedy and Goel 1986). DO range from 1.87mg/l -15.47mg/l in the studied lakes. The lowest DO was observed in Arekere due to the excessive growth of floating macrophytes in the lake that prevented light penetration into the water, resulting in lower rates of photosynthesis by phytoplankton. Invasive macrophytes covering the water surface of a lake induces anaerobic conditions by deprivation of air water interface (Durga et al. 2010). This leads to the decline of algal growth due to lack of photosynthesis with deprivation of sun light. The high DO in Kodagisingasandra and Doddakalsandra is mainly due to the high photosynthetic activities in algae. Algal mats were seen floating in Doddakalsandra Lake.
Chemical oxygen demand (COD)
Chemical oxygen demand (COD) is the measure of total oxygen required for the complete oxidation of organic matter present in the water body by using a strong chemical oxidant such as dichromate (APHA 2005). COD is an indicator of organic pollution in aquatic ecosystems (Siraj et al. 2010). COD values ranged from 31.67 mg/l in Yediyur to 332 mg/l in Hulimavu. The highest COD was observed in Hulimavu due to the inflow of sewage into the lake as well as high anthropogenic activities on the lake banks. Khuhawari et al. (2009) associated higher values of COD with increased anthropogenic pressures on lakes and it is evident from the results that COD values of all the lakes were very high, an indication of flooded organic matter.
Alkalinity
Alkalinity is a measure of the ability of water to neutralize acids. It is due to the presence of bicarbonates, carbonates and hydroxide of calcium, magnesium, sodium, potassium and salts of weak acids and strong bases as borates, silicates, phosphates, etc. (APHA 2005). Large amount of alkalinity imparts a bitter taste, harmful for irrigation as it damages soil and hence reduces crop yields (Sundar and Saseetharan 2008). The alkalinity ranged from 143.1 mg/l (in Sankey) to 442.50 mg/l (in Doddakalsandra). The alkalinity values were well within the permissible limit of 500 mg/l (BIS 1998) in all lakes.
Chloride
Chloride ions are generally present in natural waters in the form of salts of sodium, potassium and calcium. The main sources of chlorides in lakes are the dissolution of salt deposits, discharges of effluents from industries, sewage discharges, irrigation, etc (Manivasakam 2003). The average chloride concentration in sampled lakes ranged from 66.10 mg/l (Sankey) to 714.29 mg/l (Begur) and the values were within the permissible limit of 1000mg/l.
Total Hardness
Hardness primarily due to the presence of calcium and magnesium ions measures the capacity of water to precipitate soap. Some cations (like iron, strontium and manganese) and anions (such as carbonates, bicarbonates, sulphate, chloride, nitrate and silicates) contribute to hardness in aquatic ecosystems (APHA 2005). The hardness ranged from 92.9 mg/l (Lalbagh) to 330.72 mg/l (in Doddakalsandra). The degree of hardness of drinking water has been classified (WHO 2004) in terms of its equivalent CaCO3 concentration and accordingly Lalbagh and Sankey fall in medium hard category (75 mg/l –150 mg/l), Yediyur, Begur, Kothnur, Subbrayankere, Chunchunghatta, Madivala and Kodagisingasandra in hard category (150 mg/l –300 mg/l) and Arekere, Hulimavu, and Doddakalsandra in very hard category (Above 300 mg/l). The calcium hardness ranged from 16.9 mg/L (Lalbagh) to 76.29 mg/L (Doddakalsandra) and was well below the permissible limits of 200 mg/L (BIS 1998) in all the lakes. The magnesium ranged from 18.5 (Lalbagh) to 61.90mg/L (Doddakalsandra).
Sodium and Potassium
The average concentration of major cations Na and K ranged from 106.9 mg/L 6 (Sankey) to 1142.95 mg/L (Begur) and 19.99 mg/l (Sankey) to 190 mg/l (Begur) respectively. The average Na concentrations of all lakes except Lalbagh, Sankey and Yediyur are above the permissible limit of 200 mg/l. The average K concentration of all the lakes is above the permissible limit of 10 mg/l (BIS 1998). The high sodium and potassium concentration shows that the lakes are fed by sewage (Bhat et al. 2001).
Nitrate
Nitrate concentration in groundwater and surface water is normally low but can reach high levels as a result of agricultural runoff or contamination with human or animal wastes (Nas and Berktay 2006). The average nitrate content ranged from 0.28 mg/l (Arekere) to 0.86 mg/l (Begur). All lakes showed nitrate values below the permissible limit of 45 mg/L.
Phosphate
The average phosphate concentration ranged from 0.09 mg/l (Sankey) to 0.94mg/l (Chunchunghatta). Average phosphate concentration of Begur, Arekere, Chunchunghatta, Doddakalsandra was above the permissible limit of 0.3 mg/L. The surplus amount of phosphate along with nitrate results in nutrient enrichment in aquatic ecosystems and enhances phytoplankton growth (Pandit and Yousuf 2002).
Lake ID |
Summary |
Te |
pH |
EC |
TDS |
DO |
COD |
Al |
CI |
Na |
K |
Ha |
Ca |
Mg |
NO |
PO |
1 |
Mean |
23.05 |
9.30 |
560.80 |
249.50 |
8.50 |
48.00 |
143.10 |
85.20 |
141.10 |
41.04 |
92.90 |
16.90 |
18.50 |
0.43 |
0.09 |
|
SD |
1.50 |
0.53 |
43.20 |
19.80 |
2.60 |
45.22 |
10.90 |
10.24 |
31.20 |
8.60 |
4.90 |
2.70 |
1.10 |
0.05 |
0.01 |
|
Range |
21.5-26.2 |
8.2-10.3 |
493-611 |
220-275 |
4.9-13.7 |
16-160 |
120-160 |
68.16-97.58 |
38.4-169.6 |
27.6-52 |
84-100 |
13.62-23.25 |
16.71-20.48 |
0.37-0.51 |
0.08-0.1 |
2 |
Mean |
22.98 |
9.30 |
472.88 |
211.64 |
9.80 |
44.78 |
149.67 |
66.10 |
106.96 |
19.99 |
94.61 |
16.74 |
18.95 |
0.38 |
0.09 |
|
SD |
2.11 |
0.55 |
24.42 |
10.62 |
4.65 |
36.96 |
12.33 |
3.16 |
27.81 |
7.15 |
4.67 |
3.43 |
0.96 |
0.08 |
0.02 |
|
Range |
21.1- 26.5 |
8.2 -10.3 |
420.33 -504.00 |
197 -228 |
4.90- 18.78 |
16- 160 |
130- 174 |
58.22 -70.29 |
21.6 -156.8 |
12.4- 35.6 |
87 -106 |
12.83- 24.85 |
16.80-21.26 |
0.278 -0.504 |
0.068- 0.119 |
3 |
Mean |
24.09 |
8.68 |
702.88 |
317.63 |
5.45 |
31.67 |
213.33 |
93.64 |
140.44 |
32.44 |
185.25 |
42.28 |
30.88 |
0.43 |
0.16 |
|
SD |
1.91 |
0.17 |
91.91 |
43.64 |
1.90 |
20.73 |
39.99 |
12.72 |
29.10 |
8.89 |
45.97 |
5.90 |
5.37 |
0.17 |
0.09 |
|
Range |
22.3- 27.2 |
8.4 -8.9 |
575- 848 |
259- 382 |
2.31- 8.66 |
8 -80 |
154- 284 |
71.0 -113.6 |
100.8- 193.2 |
16.8 -41.6 |
120-284 |
32.06 50.50 |
20.98 -41.04 |
0.291 -0.685 |
0.085 -0.277 |
4 |
Mean |
27.15 |
9.37 |
2589.95 |
1319.67 |
9.30 |
176.00 |
214.83 |
714.29 |
1142.95 |
190.00 |
194.67 |
43.43 |
36.75 |
0.86 |
0.31 |
|
SD |
4.71 |
0.46 |
776.14 |
479.94 |
1.54 |
10.37 |
85.13 |
41.06 |
56.23 |
14.25 |
68.53 |
14.95 |
7.23 |
0.11 |
0.09 |
|
Range |
23.3 -33.4 |
8.9-9.7 |
1786-3380 |
845-1804 |
8-8.46 |
80-520 |
160-464 |
310-1272.32 |
446.4-1800.8 |
94.4-304.8 |
148-246 |
36.67-54.5 |
26.03-46.72 |
0.73-1.00 |
0.19-.41 |
5 |
Mean |
26.82 |
9.38 |
1706.33 |
836.67 |
13.55 |
50.00 |
442.50 |
310.36 |
475.62 |
72.54 |
330.72 |
76.29 |
61.90 |
0.47 |
0.68 |
|
SD |
3.78 |
0.33 |
80.93 |
22.90 |
6.58 |
20.68 |
57.62 |
47.07 |
203.09 |
7.27 |
39.70 |
10.29 |
7.93 |
0.01 |
0.19 |
|
Range |
24.3-31.7 |
8.9-9.8 |
1570-1786 |
807-855 |
6.06-21.53 |
20-96 |
384-548 |
227.2-357.84 |
210.4-743 |
59-78 |
284-381 |
61.72-88.18 |
53.62-74.72 |
0.45-0.49 |
0.49-0.94 |
6 |
Mean |
24.56 |
9.18 |
1266.95 |
594.71 |
8.07 |
58.00 |
230.86 |
229.18 |
330.14 |
31.14 |
182.86 |
37.53 |
35.36 |
0.34 |
0.09 |
|
SD |
2.00 |
0.51 |
309.30 |
155.57 |
2.32 |
53.30 |
16.34 |
40.97 |
26.69 |
8.07 |
8.44 |
3.61 |
2.77 |
0.16 |
0.02 |
|
Range |
22.5-27.7 |
8.4-9.8 |
575-1544 |
259-752 |
4.88-1156 |
12-200 |
196-248 |
180.34-284 |
300.4-376 |
22-44.4 |
162-192 |
32.87-45.69 |
29.63-38.43 |
0.14-0.51 |
0.06-0.11 |
7 |
Mean |
25.35 |
8.68 |
1347.25 |
635.25 |
7.64 |
84.00 |
406.67 |
171.13 |
246.20 |
57.60 |
286.83 |
70.00 |
52.77 |
0.42 |
0.94 |
|
SD |
1.47 |
0.39 |
38.64 |
23.66 |
3.11 |
80.12 |
52.58 |
12.35 |
50.74 |
6.50 |
23.28 |
3.79 |
5.92 |
0.08 |
0.07 |
|
Range |
24.2-27.5 |
8.3-9.1 |
1294-1382 |
602-685 |
4.88-11.63 |
24-232 |
304-444 |
157.62-186.87 |
169.6-300 |
46.4-64 |
256-320 |
64.12-74.55 |
45.26-61.65 |
0.36-0.47 |
0.9-0.99 |
8 |
Mean |
28.43 |
8.85 |
859.50 |
398.75 |
13.38 |
58.67 |
217.33 |
148.86 |
222.23 |
29.12 |
173.20 |
45.42 |
31.09 |
0.40 |
0.10 |
|
SD |
2.87 |
0.40 |
127.42 |
71.19 |
5.33 |
42.83 |
46.92 |
47.57 |
48.35 |
6.86 |
32.17 |
8.81 |
5.78 |
0.08 |
0.00 |
|
Range |
25.8-31.8 |
8.5-9.4 |
701-970 |
309-464 |
9.43-20.95 |
20-136 |
164-284 |
82.36-201.64 |
152.4-271.2 |
22-37.6 |
134-207.2 |
33.66-54.25 |
23.89-37.25 |
0.34-0.45 |
0.094-0.099 |
9 |
Mean |
26.70 |
8.70 |
1495.00 |
755.50 |
6.28 |
332.00 |
344.00 |
243.85 |
300.57 |
58.22 |
309.17 |
61.40 |
60.30 |
0.34 |
0.09 |
|
SD |
2.00 |
0.42 |
191.10 |
35.14 |
4.70 |
16.97 |
28.09 |
47.24 |
114.24 |
6.75 |
18.29 |
17.63 |
5.82 |
0.05 |
0.01 |
|
Range |
25.2-29.6 |
8.3-9.3 |
1211-1609 |
710-794 |
1.89-12.05 |
320-344 |
314-384 |
184.4-297.49 |
164-449 |
45.2-64.4 |
294-340 |
32.86-80.16 |
52.74-68.95 |
0.304-0.37 |
0.082-0.95 |
10 |
Mean |
24.26 |
7.80 |
1420.13 |
675.25 |
1.87 |
90.00 |
441.43 |
242.82 |
293.91 |
44.37 |
316.14 |
81.76 |
55.14 |
0.28 |
0.81 |
|
SD |
4.00 |
1.04 |
536.22 |
263.19 |
0.52 |
75.93 |
151.05 |
13.60 |
43.66 |
11.95 |
18.73 |
3.44 |
9.20 |
0.20 |
0.07 |
|
Range |
20.53-29.9 |
6.8-8.7 |
623-1761 |
282-827 |
1.17-2.31 |
16-200 |
116-560 |
214.42-254.18 |
224.6-341.6 |
22.2-52.8 |
278-334 |
75.35-84.97 |
38-64.86 |
0.052-0.44 |
0.73-0.86 |
11 |
Mean |
27.95 |
8.78 |
1290.00 |
608.50 |
8.58 |
81.00 |
301.71 |
182.98 |
243.77 |
30.89 |
201.63 |
44.34 |
39.63 |
0.31 |
0.08 |
|
SD |
3.05 |
0.61 |
191.80 |
87.55 |
3.79 |
70.23 |
51.28 |
29.56 |
29.52 |
7.00 |
7.33 |
4.57 |
4.40 |
0.24 |
0.02 |
|
Range |
24.6-31.3 |
8-9.4 |
1111-1553 |
508-710 |
3.05-11.39 |
16-160 |
208-360 |
149.1-221.52 |
216.4-282 |
22-39 |
188-210 |
36.07-50.5 |
33.41-47.90 |
0.04-0.5 |
0.06-0.11 |
12 |
Mean |
27.78 |
9.30 |
1509.50 |
727.50 |
15.40 |
123.33 |
236.67 |
395.11 |
594.46 |
74.06 |
216.17 |
41.34 |
40.16 |
0.44 |
0.12 |
|
SD |
2.51 |
0.59 |
543.63 |
286.58 |
4.02 |
112.72 |
30.92 |
44.95 |
267.89 |
15.31 |
15.56 |
12.41 |
4.39 |
0.23 |
0.02 |
|
Range |
25.6-30.1 |
8.5-9.8 |
701-1869 |
309-954 |
9.43-18.16 |
40-320 |
192-268 |
333.28-454.4 |
297.2-912.8 |
59.6-95.2 |
200-235 |
33.67-65.73 |
31.12-44.74 |
0.25-0.7 |
0.09-0.14 |
Table 3: physico-chemical properties of water samples across 12 lakes.
Identification of possible factors affecting the water quality of lakes
Wetlands in Bangalore are interconnected, allowing the transaction of water from wetlands at higher gradient to subsequent low gradient ones. All sampled wetlands are located in the Bellandur catchment. Correlation (Table 4) and Scatter matrix (Fig. 3) were computed in order to analyze to correlation among the variables. In scatter matrix pink box show high and significant degree of correlation between the variables, the blue boxes show moderate degree of correlation and the yellow boxes show no correlation between the variables. From the scatter matrix and the Pearson’s correlation matrix, variables in the data set are correlated. Considering the large no of interrelated variables PCA (Principal Component Analysis) was applied to reduce the dimensionality of the variables by transforming the data into a new set of variables—the principal components (PCs), which are orthogonal (non-correlated) and are arranged in decreasing order of importance.
Table 4: Correlation matrix of The Physico-chemical parameters.
|
Te |
pH |
EC |
TDS |
DO |
COD |
Al |
CI |
Na |
K |
Ha |
Ca |
Mg |
NO |
PO |
Te |
1 |
|
|
|
|
|
|
|
|
|
|
|
|
|
|
pH |
0.1 |
1 |
|
|
|
|
|
|
|
|
|
|
|
|
|
EC |
0.55 |
0.08 |
1 |
|
|
|
|
|
|
|
|
|
|
|
|
TDS |
0.54 |
0.1 |
1* |
1 |
|
|
|
|
|
|
|
|
|
|
|
DO |
0.54 |
0.73* |
0.09 |
0.09 |
1 |
|
|
|
|
|
|
|
|
|
|
COD |
0.36 |
-0.11 |
0.51 |
0.53 |
-0.15 |
1 |
|
|
|
|
|
|
|
|
|
Al |
0.24 |
-0.54 |
0.42 |
0.4 |
-0.25 |
0.21 |
1 |
|
|
|
|
|
|
|
|
CI |
0.49 |
0.26 |
0.93* |
0.94* |
0.22 |
0.43 |
0.12 |
1 |
|
|
|
|
|
|
|
Na |
0.47 |
0.35 |
0.9* |
0.91* |
0.27 |
0.37 |
0.04 |
0.99* |
1 |
|
|
|
|
|
|
K |
0.35 |
0.31 |
0.86* |
0.88* |
0.15 |
0.42 |
0.04 |
0.94* |
0.96* |
1 |
|
|
|
|
|
Ha |
0.36 |
-0.48 |
0.55 |
0.54 |
-0.19 |
0.41 |
0.95* |
0.28 |
0.2 |
0.19 |
1 |
|
|
|
|
Ca |
0.32 |
-0.59# |
0.49 |
0.48 |
-0.25 |
0.25 |
0.96* |
0.22 |
0.15 |
0.15 |
0.97* |
1 |
|
|
|
Mg |
0.39 |
-0.41 |
0.58# |
0.56 |
-0.15 |
0.48 |
0.94* |
0.29 |
0.21 |
0.2 |
0.99* |
0.93* |
1 |
|
|
NO |
0.22 |
0.51 |
0.62# |
0.64# |
0.27 |
0.15 |
-0.25 |
0.78* |
0.84* |
0.91* |
-0.13 |
-0.13 |
-0.13 |
1 |
|
PO |
-0.08 |
-0.43 |
0.34 |
0.31 |
-0.27 |
-0.11 |
0.8 |
0.13 |
0.1 |
0.18 |
0.68# |
0.79* |
0.63# |
|
1 |
* p<0.01
# p<0.05
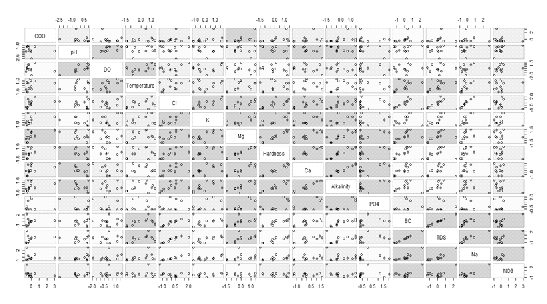 Figure 3. Scatter matrix showing the correlation strength between variables
Principal component analysis (PCA)
PCA provides information on the most meaningful parameters, which describes a whole data set affording data reduction with minimum loss of original information (Helena et al. 2000; Sarbu and Pop 2005).
The data set of the physico-chemical parameters was first standardized by taking the z-scores (Table 5). The standardization tends to minimize the influence of difference on variance of variables and eliminates the influence of different units of measurements and renders the data dimensionless. PCA was done with these normalized data sets of 15 physicochemical parameters across 12 lakes
Table 5: Z scores of physico-chemical parameters.
Lake ID |
Te |
pH |
EC |
TDS |
DO |
COD |
Al |
CI |
Na |
K |
Ha |
Ca |
Mg |
NO |
PO |
1 |
-1.39 |
0.77 |
-1.22 |
-1.19 |
-0.13 |
-0.47 |
-1.06 |
-0.94 |
-0.74 |
-0.08 |
-1.24 |
-1.25 |
-1.47 |
0.04 |
-0.63 |
2 |
-1.43 |
0.77 |
-1.37 |
-1.32 |
0.22 |
-0.51 |
-1.00 |
-1.12 |
-0.86 |
-1.19 |
-1.22 |
-1.26 |
-1.44 |
-0.31 |
-0.65 |
3 |
-0.86 |
-0.58 |
-0.98 |
-0.97 |
-0.94 |
-0.67 |
-0.47 |
-0.86 |
-0.75 |
-0.54 |
-0.22 |
-0.15 |
-0.63 |
0.06 |
-0.42 |
4 |
0.72 |
0.92 |
2.28 |
2.33 |
0.08 |
-0.60 |
-1.47 |
-1.32 |
2.77 |
-1.21 |
-1.48 |
-1.35 |
-0.23 |
2.93 |
0.03 |
5 |
0.54 |
0.95 |
0.76 |
0.74 |
1.21 |
-0.45 |
1.47 |
1.19 |
0.43 |
1.58 |
1.39 |
1.33 |
1.48 |
0.29 |
1.20 |
6 |
-0.62 |
0.50 |
0.00 |
-0.05 |
-0.24 |
-0.35 |
-0.32 |
0.42 |
-0.08 |
-0.60 |
-0.25 |
-0.36 |
-0.32 |
-0.59 |
-0.65 |
7 |
-0.21 |
-0.58 |
0.14 |
0.08 |
-0.36 |
-0.03 |
1.17 |
-0.13 |
-0.38 |
0.79 |
0.90 |
1.06 |
0.86 |
-0.06 |
2.01 |
8 |
1.37 |
-0.20 |
-0.71 |
-0.70 |
1.17 |
-0.34 |
-0.43 |
-0.34 |
-0.46 |
-0.71 |
-0.35 |
-0.01 |
-0.61 |
-0.16 |
-0.62 |
9 |
0.48 |
-0.52 |
0.39 |
0.48 |
-0.72 |
3.01 |
0.64 |
0.56 |
-0.18 |
0.82 |
1.15 |
0.68 |
1.37 |
-0.59 |
-0.65 |
10 |
-0.77 |
-2.47 |
0.26 |
0.21 |
-1.89 |
0.04 |
1.46 |
0.55 |
-0.21 |
0.09 |
1.23 |
1.57 |
1.02 |
-0.95 |
1.59 |
11 |
1.13 |
-0.36 |
0.04 |
-0.01 |
-0.11 |
-0.07 |
0.28 |
-0.01 |
-0.38 |
-0.62 |
-0.04 |
-0.06 |
-0.03 |
-0.77 |
-0.66 |
12 |
1.04 |
0.77 |
0.42 |
0.38 |
1.71 |
0.45 |
-0.27 |
2.00 |
0.85 |
1.66 |
0.12 |
-0.19 |
0.00 |
0.12 |
-0.56 |
Table 6: Eigen values of the first three principal components.
Parameters |
PC1 |
PC2 |
PC3 |
Te |
-0.133 |
0.295 |
-0.253 |
pH |
0.206 |
0.249 |
-0.344 |
EC |
-0.158 |
0.421 |
0.197 |
TDS |
-0.150 |
0.425 |
0.196 |
DO |
0.059 |
0.235 |
-0.532 |
COD |
-0.200 |
-0.013 |
-0.161 |
Al |
-0.377 |
-0.117 |
0.041 |
CI |
-0.295 |
0.052 |
-0.377 |
Na |
-0.010 |
0.472 |
0.141 |
K |
-0.300 |
0.047 |
-0.320 |
Ha |
-0.390 |
-0.088 |
-0.039 |
Ca |
-0.380 |
-0.105 |
0.056 |
Mg |
-0.384 |
0.094 |
0.069 |
NO |
0.134 |
0.412 |
0.204 |
PO |
-0.261 |
0.005 |
0.338 |
Standard deviation |
2.500 |
2.038 |
1.438 |
Proportion of Variance |
0.415 |
0.277 |
0.138 |
Cumulative Proportion |
0.415 |
0.692 |
0.830 |
Table 6 provides the results of PCA are indicated in the table 6. The principal component analysis showed that the eigen values of first two principal components accounted for 69.2% of total variance (PC1 41.52%; PC2 27.2%) in the data set. The percentage of the explained variability rises up to 83.01% when taking into account three components. However, considering large number of variables (15) studied, PC1 and PC2 were considered for further analysis.
The PC1 which accounted for 41.2% of the variability in the data set with strong positive loadings for pH, DO and Nitrate. The positive values of these variables for this component indicate the colonization of the lakes by phytoplanktons. Nitrate facilitates the growth of phytoplanktons in tropical lakes which in turn result in an increase in pH and DO.
PC2 accounted for 27.2% of variability in the data set with strong positive loadings for T, Na, K, EC, TDS, Cl, Mg, nitrate and phosphate. The positive values for these variables for this component show allochthonous inputs due to urban pollution in lakes. This component mainly represents the anthropogenic pollution of sewage and domestic waste waters into the lakes. These are in consistent with those observed for Yamoussoukro’s lake system (Parinet et al. 2004).
The scores of 12 lakes and the loadings of 15 variables are shown in fig. 4. A close look at this figure shows that well correlated variables of pH, DO and NO3-contribute to the construction of PC1. The observation of the data shows that these variables are linked to the dominance of algae in lakes number 4 and 12. Strong loadings of TDS, EC, Na, T, and moderate loadings of Mg, K, Cl and PO43- contribute to the construction of PC2. These variables are linked to the discharge of sewage, domestic and industrial wastes in lakes (sampled lakes at 4, 5, 9 and12)

Figure 4Loadings of the 15 experimental variables and scores of the lakes (1-12) on the plane defined by
principal components 1 and 2
Cluster analysis
The Cluster Analysis (CA) clusters variables based on internal (within-cluster) homogeneity and high external (between-cluster) heterogeneity. Hierarchical agglomerative clustering, illustrated by a dendrogram (tree diagram) provides similarity relationships between any one sample and the entire data set (Mc Kenna, 2003) . The dendrogram depicts various groups and their proximity, with a reduction in dimensionality of the original data. The Euclidean distance provides the similarity between two samples, and a distance can be represented by the difference between analytical values from the samples (Otto 1998; Varol et al. 2009).
In the present study, hierarchical agglomerative CA was performed on the normalized data set by means of the Ward’s method, using squared Euclidean distances as a measure of similarity. Cluster analysis resulted in a dendrogram, grouping all the 12 lakes into four statistically significant clusters (Fig. 5). The cluster 1 comprises less polluted lakes like Lalbagh and Sankey. Subbrayankere, Madivala, Yediyur and Kothnur were grouped into the second cluster, which corresponds to the moderately polluted lakes. Cluster 3 includes Doddakalsandra, Kodagisingasandra, Chunchunghatta, Hulimavu, and Arekere corresponds to highly polluted lakes. Begur showed an abnormal behavior because of its relatively higher value of variables which contributed to the construction of both PC1 and PC2 and thus is classified in a separate, very highly polluted cluster 4. This lake is characterized by extreme degree of physical and biological pollution. The CA had grouped the restored (Lalbagh and Sankey) and maintained lakes (Madivala, Yediyur and Kothnur) into the same cluster of low and moderately polluted lakes respectively. Thus, more attention is to be paid on lakes in cluster three and four through regular monitoring of their water quality and by adopting restoration measures in order to prevent their degradation as well as disappearance from the landscape. Immediate steps need to be taken by the policy makers to prevent these ecologically sensitive habitats as well as the associated diversity from becoming extinct.
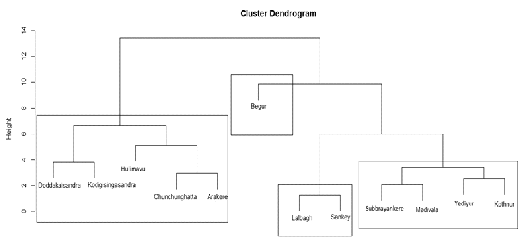
Figure 5. Dendrogram of cluster analysis based on surface water quality of 12 lakes.