Methods
Study area
Uttara Kannada (13.92o to 15.53o North and 74.09o to 75.09o East) is the fifth largest district of Karnataka State in India with abundant natural resources, perennial (water flows throughout the year) rivers, abundant flora, fauna and a long coastal line (about 140 km). The district consists of three distinct agro-climatic zones covering 11 taluks (local administrative divisions), i.e., the coastal taluks Karwar, Ankola, Kumta, Honnavar and Bhatkal, the Sahyadri Interior taluks Supa, Yellapura, Sirsi and Siddapur and two eastern plains (connected to Deccan plateau) Haliyal and Mundgod. The total population of the district is 1,437,169 (as per 2011 census) with a density of 140 persons per km2. The district covers about 15,055 km of road length, ranging from national and state highways to village roads. The four forest types (Fig. 2) are dry deciduous, moist deciduous, evergreen to semi evergreen and coastal mixed deciduous forests, the result of its varied geographical features. Recent changes in the forest cover and associated habitat fragmentations are due to unplanned developmental activities. The implementation of hydroelectric and nuclear power projects with the consequent submergence of large tracts of evergreen forests and croplands has displaced thousands of families affecting their livelihood as well as the sustainability of natural resources. This necessitates a better understanding of forest dynamics with disturbance regimes, including the extent of fragmentations.
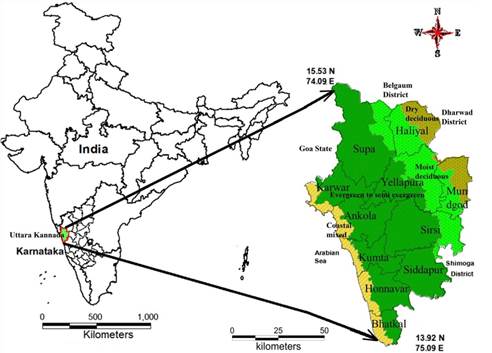
Figure 2 Study area and forest type description
Quantification of spatial-temporal forest changes and extent of fragmentation
Land use (LU) changes in Uttara Kannada District were assessed using temporal remote sensing (RS) data with ancillary data and information obtained from the field. Figure 3 outlines the method adopted for the analysis of spatial patterns of forest changes. RS data used in the study are Landsat MSS (1979), TM (1989, 1999), Landsat ETM+ (2013) (downloaded from the archive - http://glovis.gov.in) and Google Earth (http://earth.google.com). Slope maps were generated by using ASTER DEM (30 m) (http://gdem.ersdac.jspacesystems.or.jp/). Rainfall data was procured from the Directorate of Economics and Statistics, Government of Karnataka (http://des.kar.nic.in). Population data was procured from the Directorate of Census Operations, Karnataka (http://censuskarnataka.gov.in). Ancillary spatial data include cadastral revenue maps (1:6000), the Survey of India (SOI) topographic maps (1:50,000 and 1:250,000 scales) were procured from the Survey of India (http://surveyofindia.gov.in), etc. Ground control points (GCP’s) used to geo-rectify remote sensing data were digitized from the topographic maps and from field observations. Various forest cover types to classify RS data from the 1980’s were obtained from the vegetation map of South India at a scale of 1:250,000 (Pascal 1986). Training data required for classification and validation of the latest remote sensing data were compiled from field observations using a pre-calibrated hand-held GPS (Global Positioning System). GPS calibration was carried out from known ground coordinates (benchmarks, intersection of roads and other landmarks) as per the most commonly adopted protocol (Yuan 2008). FCC (false color composites) helped in identifying heterogeneous land use patches. Select land use patches (uniformly distributed in the study region covering at least 10% of the study region), were digitized and loaded to the GPS. Attribute information are collected (land use type, vegetation details) for these patches (training polygons) from the field.
Land use analysis and detection of change
Changes in land use during the last four decades were assessed using temporal RS data. This helped in determining the extent and causes of transitions in the landscape. Spatial data analyses involved (i) pre-processing, (ii) vegetation cover and (iii) land use analyses. Pre-processing involved geo-referencing, rectification and cropping of data pertaining to the study region. Geo-referencing was carried out through ground control points collected from the field using pre calibrated GPS and from known points, such as road intersections, collected from geo-referenced topographic maps published by the Survey of India. The Landsat data of 1979, with a spatial resolution of 57.5 m × 57.5 m, was resampled to 30 m comparable to the 1989‒2013 data, which are 30 m × 30 m (nominal resolution). The Landsat ETM+ bands of 2013 were corrected for the SLC-off (Scan Line Corrector failed) by using image enhancement techniques and nearest-neighbor interpolation.
Land use analysis involved (i) the generation of False Color Composites (FCC) of remote sensing data (bands–green, red and NIR), which helped in locating heterogeneous patches in the landscape, (ii) selection of training polygons by covering 15% of the study area (polygons are uniformly distributed over the entire study area), (iii) loading the co-ordinates of these training polygons into GPS, (vi) the collection of corresponding attribute data (land use types) for these polygons from the field, where the GPS helped in locating respective training polygons in the field, (iv) supplementing this information with Google Earth. In the end, 60% of the training data was used for classification, with the balance going for validation or accuracy assessment (Ramachandra et al. 2012c). The land use analysis was performed using a supervised classification technique based on the Gaussian maximum likelihood (GML) algorithm with training data (collected from the field using GPS). This evaluated quantitatively the variance and covariance of spectral response patterns of land uses based on a GML estimator (Atkinson and Lewis 2000; Ramachandra et al. 2012c). Land use classifications using temporal data was carried out through the open source program GRASS - Geographical Resources Analysis Support System (http://ces.iisc.ac.in/grass). Accuracy assessments of the classified information have been performed (Lillesand et al. 1987; Liu et al. 2007) to evaluate the performance of classifiers through the computation of an error matrix, kappa (κ) statistics and overall accuracies.
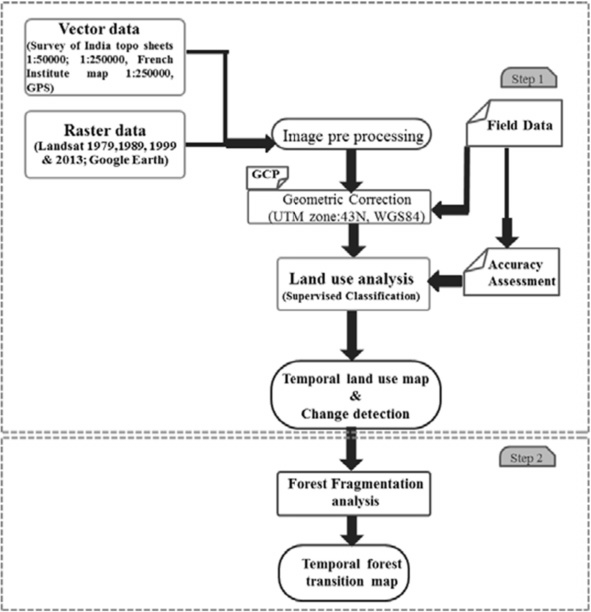
Figure 3 Method for LULC and fragmentation analysis
Forest fragmentation model implementation
Fragmentation of forests at the pixel level are estimated through the computation of Pf (the ratio of the number of pixels that are forested to the total number of non-water pixels in the window) and Pff (the proportion of all adjacent (in cardinal directions) pixel pairs that include at least one forest pixel, for which both pixels are forested) as given in equations 1 and 2 (Riitters et al. 2002; Kuèas et al. 2011; Ramachandra and Kumar 2011).
Pf = Proportion of number of forest pixels / Total number of non ‒ Water pixels in window
(1)
Pff = Proportion of number of forest pixel pairs/ Total number of adjacent pairs of at least one forest pixel
(2)
Pff estimates the conditional probability that, given a pixel of forest its neighbor is also forest based, the proportion of all adjacent (cardinal directions) pixel pairs. Pf and Pff were computed through a moving window of 5 x 5 pixels (Fig. 4), given that the results of the model are scale-dependent and threshold dependent. A kernel of size 5 x 5 is selected for spatial data of 30 m, based on earlier work (Riitters et al. 2002; Wickham et al. 2007; Kuèas et al. 2011; Prasad et al., 2009; Ramachandra and Kumar, 2011), which maintain a fair representation of the proportion (Pf) of pixels and also interior forest at an appropriate level (Ritters et al. 2000; 2002, Wickham et al. 2007, Kuèas et al. 2011). Riitters et al. (2004) demonstrated the appropriateness of 5 x 5 kernels. Kernel sizes smaller than 5 x 5 have an effect of decreasing the average inter patch distance, indicating less fragmentation, even though disintegration of interior forests might be evident (Bogaert et al. 2004; Lindenmayer et al. 2008). Similarly, an increase of kernel size decreases the core area and this process may transform small core areas to form a discontinuous landmass (Ostapowicz et al. 2008; Kuèas et al. 2011). Depending on the indices Pf and Pff, spatial extent of forest fragmentation were mapped and details are presented in Table 1. Water bodies or river courses are considered non-fragmenting features, for these constitute natural corridors in a forested landscape, while anthropogenic landscape elements (such as buildings, roads, agricultural field and barren land) are drivers of forest fragmentation.
Principal Component Analysis (PCA)
Unplanned urbanization, geography, industrialization, government policies, economic reforms and population growth are the major factors driving landscape changes (Gong et al. 2013). Socio-economic and bio-geophysical variables elucidate the role of anthropogenic forces in forest transitions, altering landscape structures and their composition (Ramachandra et al. 2014a). These geophysical variables and socio-economic factors aid as drivers of land use changes in the landscape (Nelson et al. 1999; Barbier 2001; Timar 2011; Cho et al. 2015).
The primary objective of geospatial statistical analysis is to quantify the correlation between socio-economic and bio-geophysical variables with the fragmentation of forests over a set of non-water pixels in a landscape through multiple linear regression (MLR). But, MLR explains the output data as a weighted sum of individual correlations with the assumption that any individual variable/feature in the input set is linearly independent. A high level of interdependence among input variables imply that forest fragmentation correlations do not have an independent biological interpretation. To reduce redundancy in multivariate data, a decomposition of eigen values is used in Principal Component Analysis (PCA). It helps in noise reduction and also in prioritizing variables, responsible for the variation in spatial landscape processes (Morris et al. 2009). Prioritizing these variables based on their role in land use changes will help to evolve management strategies and sustain landscape elements with their interactions (Todd and Kerr 2009).
PCA explores multivariate patterns of all forest patch types versus spatial processes based on correlation matrices and frames clusters and relates spatial heterogeneity among variables correlated with one another and responsive to multiple principal components (PC). These derived components are linear function of the original data set. The components derived are ordered by decreases in variance, i.e., PC1 will have the largest variance among n components and PCn will have the smallest variance. After the extraction of the PCA eigenvalues, Scree plot is generated to prioritize the number of significant principal components (Jackson 1993). Finally, a series of ordinations were created to interpret the PCs visually and determine their fragmentation patterns. The sum of the eigenvalues is equal to the variance of the original data set, which preserves the original variation. The table of factor loadings explains the contribution of each variable to the derived components. A component is oriented towards that variable which has the maximum loading on it.
PCA with geo-physical variables aid in understanding the causal factors of environmental vulnerability. The positively correlated spatial parameters with geophysical and socio-economic variables serve as key descriptors of land use transitions (Salvati et al. 2008). PCA analyzes the variance of variables and reorganizes it into a new set of uncorrelated independent components (principal components) equal to the number of original variables as linear combinations of the measured variables (Swan and Sandilands 1995). These combinations are based on weights (eigenvectors) and the loading for each item/variable is the correlation between components, which serve to demarcate clusters of similar patterns (Colson et al. 2011). PCA aided in prioritizing bio-geophysical and socio variables that act as agents of changes in vegetation cover. The variables used in PCA were normalized (Abdi et al. 2010; Bell et al. 2015) by computing Z-scores (Normalized (X)).
Fragmentation component |
Description |
Computation |
Interior |
Forest pixels are far away from the forest-non forest boundary. Interior forested areas are surrounded by thicker forested areas. |
(Pf = 1). All pixels surrounding the center pixel are forest. |
Patch |
Forest pixels comprising small forested areas surrounded by non-forested land cover. |
(Pf < 0.4). A pixel is part of a forest patch on a non-forest background, such as a small wooded lot within a built-up area. |
Perforated |
Forest pixels forming the boundary between an interior forest and relatively small clearings (perforations) within the forested landscape. |
(Pf > 0.6 and Pf‒Pff > 0). Most pixels in the surrounding area are forested, but the center pixel appears to be part of the inside edge of a forest patch. This would occur if small clearings were made within a patch of forest. |
Edge |
Forest pixels that define the boundary between interior forest and large non forested land cover features. |
(Pf > 0.6 and Pf‒Pff < 0). Most pixels in the surrounding area are forested, but the center pixel appears to be part of the outside edge of a forest. This would occur along the boundary of a large built-up area, or agricultural field. |
Transitional |
Areas between edge type and non-forest types. If higher pixels are non-forest then they will be tending to non-forest cover with higher degree of edge. |
(0.4 < Pf < 0.6). About half of the cells in the surrounding area are forested and the center forest pixel may appear to be part of a patch, edge, or perforation depending on the local forest pattern. |
Table 1 Fragmentation components and their description
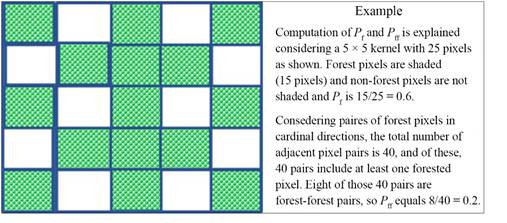
Figure 4 KERNEL (5 × 5) for computation of Pf, Pff values
Citation : Ramachandra T.V., bharath Setturu, Subash chandran, Geospatial analysis of fragmentation in uttara kannada district,India, T V et al. Forest Ecosystems (2016) 3:10DOI 10.1186/s40663-016-0069-4
|