|
|
Unabated Violations in Agara Bellandur Wetland
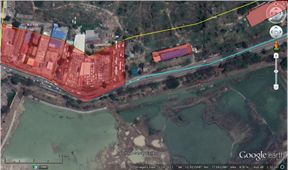
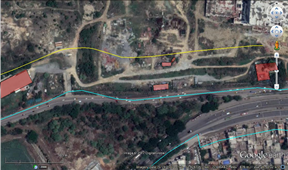
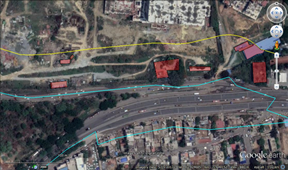
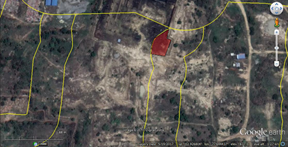
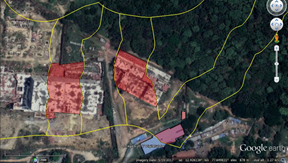
Belladur Agara wetland is the pristine wetland in the valley zone of south-east Bangalore. Agara Bellandur wetland is being abused with the numerous unplanned senseless developmental activities violating the environmental norms. Figure 1 illustrates the persisting violations in the buffer zones of lakes, stream as on 2017 December despite sensible NGT order. Large number of structures still exist in the buffer zones violating norms of NGT.
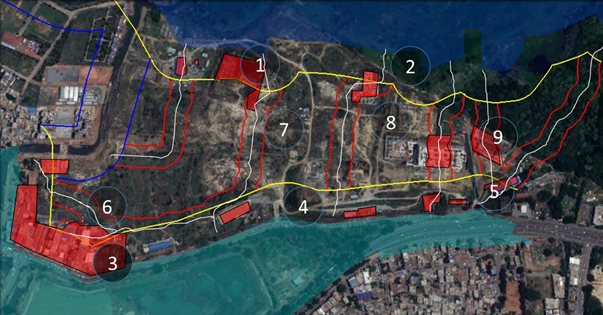
Figure 1: Lakes, Streams, Buffer zones, Violations and Sections (1, 2, 3,…9)
Note: Yellow lines (75 m buffer zone of Lakes), Blue lines (50 m buffer zone of Rajakaulves), Red line (25 m buffer zone from streams)
Table1: Section wise Violations in Agara Bellandur Zone
Section |
Geographic Features |
Location |
Violation |
1 |
|
12.9276690N
77.6443920E |
Existing Structures and Buildings in the buffer zone of Bellandur lake (75m) |
2 |

|
12.9275670N
77.6472270E |
Existing Structure in the buffer zone of Bellandur lake (75m) |
3 |
|
12.9237960N
77.6414430E |
Numerous Buildings Existing in the buffer zone of Agara Lake |
4 |
|
12.9249380N
77.6462240E |
Buildings Existing in the buffer zone of Agara Lake |
5 |
|
12.9249450N
77.6484600E |
Buildings Existing in the buffer zone of Agara Lake |
6 |

|
12.9275670N
77.6472270E |
Buildings Existing in the buffer zone of Stream connecting Agara and Bellandur Lake |
7 |
|
12.9270160N
77.6446860E |
Structure Existing in the buffer zone of Stream connecting Agara and Bellandur Lake |
8 |

|
12.9272660N
77.6472190E |
Structure Existing in the buffer zone of Stream connecting Agara and Bellandur Lake |
9 |
|
12.9260250N
77.6495080E |
Buildings and Structures Existing in the buffer zone of Stream connecting Agara and Bellandur Lake |
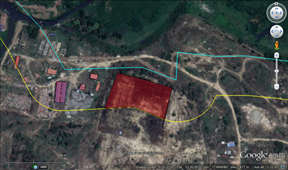
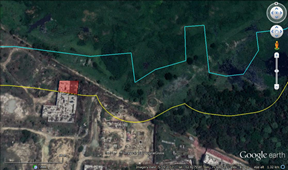
GPS data (Waypoints and Tracks) overlay on Google earth is as depicted in Figure 2, based on field visit carried out on 12 December 2017.
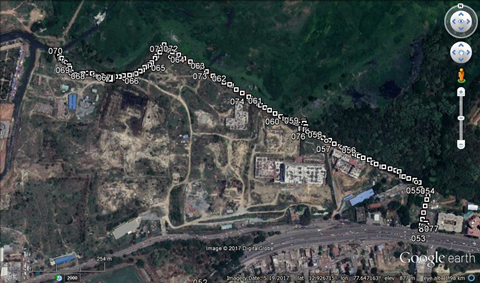
Figure 2: GPS overlay on Google earth

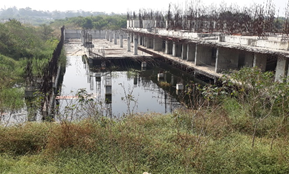
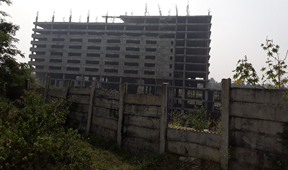
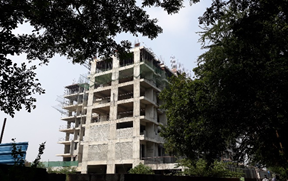
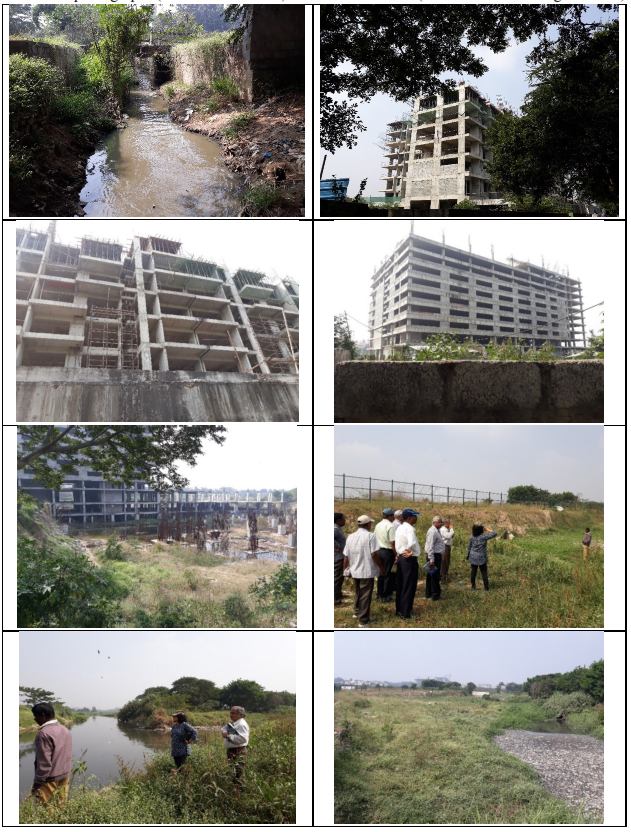
Figure 3: Field visit (GE + Photographs)
Field work photographs (12 December 2017) – Violations Galore (where are law abiding citizens?)
Flooding: Floods in an urbanised landscape refer to the partial or complete inundation from the rapid accumulation or run-off resulting in the damage to property and loss of biotic elements (including humans). Urban flooding is a consequence of increased impermeable catchments resulting in higher catchment yield in a shorter duration and flood peaks sometimes reach up to three times. Thus, flooding occurs quickly due to faster flow times (in a matter of minutes). Causal factors include combinations of loss of pervious area in urbanising landscapes, inadequate drainage systems, blockade due to indiscriminate disposal of solid waste and building debris, encroachment of storm water drains, loss of inter connectivity among lakes, housing in floodplains and natural drainage and loss of natural flood-storages sites. Flood mitigation in urban landscape entails integrated ecological approaches combining the watershed land-use planning with the regional development planning. This includes engineering measures and flood preparedness with the understanding of ecological and hydrological functions of the landscape.
Bangalore is experiencing unprecedented urbanisation and sprawl in recent times due to concentrated developmental activities with impetus on industrialisation for the economic development of the region. This concentrated growth has resulted in the increase in population and consequent pressure on infrastructure, natural resources and ultimately giving rise to a plethora of serious challenges such as climate change, enhanced green-house gases emissions, lack of appropriate infrastructure, traffic congestion, and lack of basic amenities (electricity, water, and sanitation) in many localities, etc. This study shows that there has been a growth of 1028% in urban areas of Greater Bangalore across 45 years (1973 to 2017). Urban heat island phenomenon is evident from large number of localities with higher local temperatures. The study unravels the pattern of growth in Greater Bangalore and its implication on local climate (an increase of ~2 to 2.5 ºC during the last decade) and also on the natural resources (88% decline in vegetation cover and 79% decline in water bodies), necessitating appropriate strategies for the sustainable management.
|
Dr. T.V. Ramachandra
Centre for Sustainable Technologies, Centre for infrastructure, Sustainable Transportation and Urban Planning (CiSTUP), Energy & Wetlands Research Group, Centre for Ecological Sciences, Indian Institute of Science, Bangalore – 560 012, INDIA.
E-mail : tvr@iisc.ac.in
Tel: 91-080-22933099/23600985,
Fax: 91-080-23601428/23600085
Web: http://ces.iisc.ac.in/energy
Vinay SEnergy & Wetlands Research Group, Centre for Ecological Sciences, Indian Institute of Science, Bangalore – 560 012, INDIA.
E-mail: svinay@iisc.ac.in
Sudarshan BhatEnergy & Wetlands Research Group, Centre for Ecological Sciences, Indian Institute of Science, Bangalore – 560 012, INDIA.
E-mail: sudarshanb@iisc.ac.in
Bharath SetturEnergy & Wetlands Research Group, Centre for Ecological Sciences, Indian Institute of Science, Bangalore – 560 012, INDIA.
E-mail: setturb@iisc.ac.in
Bharath H. AithalEnergy & Wetlands Research Group, Centre for Ecological Sciences, Indian Institute of Science, Bangalore – 560 012, INDIA.
E-mail: bharathh@iisc.ac.in
Citation:Ramachandra T V, Vinay S, Sudarshan Bhat, Bharath Settur, Bharath H. Aithal, 2017. Unabated Violations in Agara Bellandur Wetland, ENVIS Technical Report 134, Environmental Information System, CES, Indian Institute of Science, Bangalore 560012
| Contact Address : |
| |
Dr. T.V. Ramachandra
Energy & Wetlands Research Group,
Centre for Ecological Sciences, TE 15, New Biology Building, Third Floor, E Wing, [Near D Gate], Indian Institute of Science, Bangalore – 560 012, INDIA.
Tel : 91-80-22933099 / 22933503-extn 107
Fax : 91-80-23601428 / 23600085 / 23600683 [CES-TVR]
E-mail : tvr@iisc.ac.in, energy@ces.iisc.ac.in,
Web : http://wgbis.ces.iisc.ac.in/energy |
|