NAME
d.vect.chart - Displays charts of vector data in the active frame on the graphics monitor.KEYWORDS
display, cartography, chart mapsSYNOPSIS
d.vect.chart
d.vect.chart --helpd.vect.chart [-cl3] map=name [type=string[,string,...]] [layer=string] [chart_type=string] columns=name[,name,...] [size_column=name] [size=integer] [scale=float] [outline_color=name] [colors=name[,name,...]] [max_ref=float[,float,...]] [--help] [--verbose] [--quiet] [--ui]
Flags:
- -c
- Center the bar chart around a data point
- -l
- Create legend information and send to stdout
- -3
- Create 3D charts
- --help
- Print usage summary
- --verbose
- Verbose module output
- --quiet
- Quiet module output
- --ui
- Force launching GUI dialog
Parameters:
- map=name [required]
- Name of vector map
- Or data source for direct OGR access
- type=string[,string,...]
- Input feature type
- Options: point, line, boundary, centroid, area
- Default: point,line,boundary,centroid
- layer=string
- Layer number or name
- Vector features can have category values in different layers. This number determines which layer to use. When used with direct OGR access this is the layer name.
- Default: 1
- chart_type=string
- Chart type
- Options: pie, bar
- Default: pie
- columns=name[,name,...] [required]
- Attribute columns containing data
- size_column=name
- Column used for pie chart size
- size=integer
- Size of chart (diameter for pie, total width for bar)
- Default: 40
- scale=float
- Scale for size (to get size in pixels)
- Default: 1
- outline_color=name
- Outline color
- Either a standard color name or R:G:B triplet
- Default: black
- colors=name[,name,...]
- Colors used to fill charts
- Either a standard color name or R:G:B triplet
- Default: black
- max_ref=float[,float,...]
- Maximum value used for bar plot reference
DESCRIPTION
d.vect.chart displays charts for GRASS vector data in the active frame on the graphics monitor.NOTES
The charts are positioned as follows:- vector points: on point position,
- vector lines: on line centers,
- vector areas: on area centroids.
The 'sizecol' parameter is proportionate to the radius.
The optional max_ref parameter accepts a list of values that represent the maximum value for each column listed in the values for the parameter columns. These values are used to create a framed bar plot if chart_type is bar (See Example 2).
EXAMPLES
Example 1
Pie-charts of monthly winter precipitation (North Carolina sample dataset):g.region vector=nc_state -p d.vect nc_state d.vect.chart precip_30ynormals chart_type=pie columns=nov,dec,jan,feb -l # show pie chart as 3D d.erase d.vect nc_state d.vect.chart precip_30ynormals chart_type=pie columns=nov,dec,jan,feb -l -3
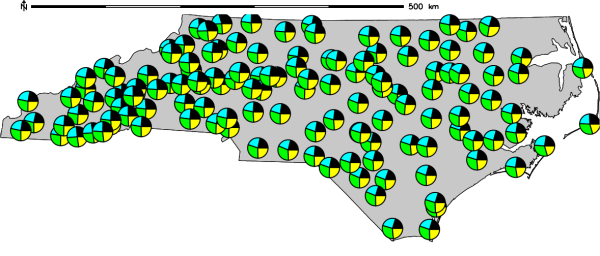
2D pie-chart of monthly winter precipitation in North Carolina
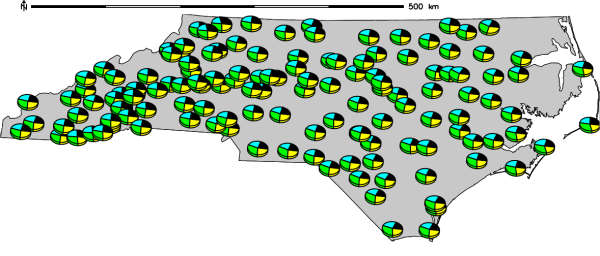
3D pie-chart of monthly winter precipitation in North Carolina
Example 2
Bar-chart of different census map values:d.vect.chart map=vectmap columns=cens51,cens61,cens71,cens81 chart_type=bar
Example 3
Creation of framed bar charts of an erodibiliy index from the Spearfish sample dataset:
g.region raster=erode.index -p
r.to.vect -s input=erode.index output=erode_index type=area
v.extract input=erode_index output=erode_index_ctrds type=centroid
d.rast aspect
d.vect.chart map=erode_index_ctrds chart_type=bar columns=cat \
             size=10 max_ref=12 scale=0.05 colors=yellow
d.vect erode_index_ctrds icon=basic/circle fcol=black col=black size=5
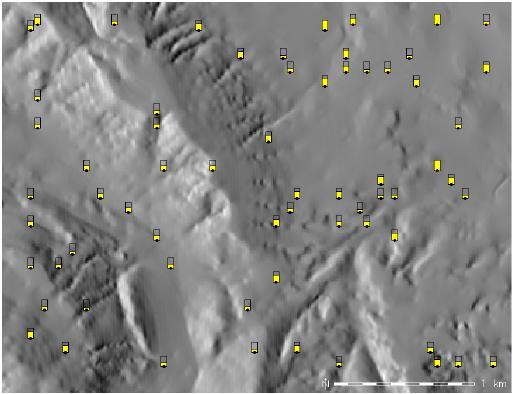
Bar charts of an erodibiliy index (spatial subset)
SEE ALSO
d.erase, d.vect, d.vect.thematic, d.what.vect, d.rastAUTHOR
Radim Blazek, ITC-Irst, Trento, ItalySOURCE CODE
Available at: d.vect.chart source code (history)
Latest change: Thursday Feb 03 11:10:06 2022 in commit: 547ff44e6aecfb4c9cbf6a4717fc14e521bec0be
Main index | Display index | Topics index | Keywords index | Graphical index | Full index
© 2003-2023 GRASS Development Team, GRASS GIS 8.2.2dev Reference Manual